
 Could eight obesity-related indices be effective in predicting the risk of metabolic syndrome in young and middle-aged adults? A cross-sectional study
ABSTRACT
Objective Metabolic syndrome is common endocrine disease worldwide. Anthropometric measurements and obesity-related indices can be used effectively in its diagnosis. This study investigates the use of obesity-related indices in defining metabolic syndrome.
Methods Cross-sectional data from 2,720 young and middle-aged individuals were analyzed. A body shape index, abdominal volume index, body adiposity index, body roundness index, conicity index, lipid accumulation product, visceral adiposity index, and waist-triglyceride index were evaluated. Receiver operating characteristic analysis was performed.
Results The odds ratio and 95% confidence interval (95% CI) values for the risk of metabolic syndrome were 1.035 (1.021-1.049) for waist-triglyceride index, 1.045 (1.012-1.079) for body adiposity index (p0.05), 1.084 (1.051-1.119) for lipid accumulation product, and 5.789 (4.536-7.388) for visceral adiposity index (No-BreakpNo-Break0.001).
Conclusion It was concluded that waist-triglyceride index, body adiposity index, lipid accumulation product, and visceral adiposity index can be used as alternatives for identifying metabolic syndrome in adults. Cut-off values for waist-triglyceride index, lipid accumulation product, and visceral adiposity index indices were found for the presence of metabolic syndrome.
Keywords
Abdominal volume index; Lipid-accumulation product; Metabolic syndrome; Visceral adiposity index; Waist-triglyceride index
RESUMO
Objetivo A síndrome metabólica é uma doença endócrina comum em todo o mundo. Medidas antropométricas e índices relacionados à obesidade podem ser utilizados de forma eficaz no diagnóstico. Este estudo investiga o uso de índices relacionados à obesidade na definição da síndrome metabólica.
Métodos Analisamos os dados transversais de 2.720 indivíduos, jovens e de meia-idade. Utilizamos índice de forma corporal A, índice de volume abdominal, índice de adiposidade corporal, índice de redondeza corporal, índice de conicidade, Produto de acúmulo de lipídios, índice de adiposidade visceral, foi avaliado o índice de triglicerídeos Cintura. E também foi realizada uma análise receiver operating characteristic.
Resultados Os valores de odds ratio e intervalo de confiança de 95% (IC 95%) para o risco de síndrome metabólica foram 1,035 (1,021-1,049) no índice de triglicerídeos cintura, 1,045 (1,012-1,079) no índice de adiposidade corporal (p0,05), 1,084 (1,051- 1,119) no produto de acúmulo de lipídios, 5,789 (4,536-7,388) no índice de adiposidade visceral (p0,001).
Conclusão Concluiu-se que índice de triglicerídeos cinturas, índice de adiposidade corporal, produto de acúmulo de lipídios, índice de adiposidade visceral pode ser utilizados como alternativa para identificação de síndrome metabólica em adultos. Foram encontrados valores de corte dos índices índice de triglicerídeos cinturas, produto de acúmulo de lipídios e índice de adiposidade visceral para a presença de síndrome metabólica.
Palavras-chave
Índice de volume abdominal; Produto de acumulação lipídica; Síndrome metabólica; Índice de adiposidade visceral; Índice de triglicerídeos na cintura
INTRODUCTION
Metabolic Syndrome (MetS) is an endocrinopathy, polymorphic condition that doubles the likelihood of developing abdominal obesity, which beggins with insulin resistance and can lead to Cardiovascular Diseases (CVD), stroke, and Type 2 Diabetes Mellitus (T2DM). Many diseases such as polycystic ovary syndrome, Alzheimer’s disease, carcinomas, obstructive sleep apnea, hepatic steatosis, non-alcoholic fatty liver disease, and systemic, life-threatening risk factor disorders are also seen in conjunction with MetS. It is accepted that MetS is a critical determinant of all-cause mortality and early death from cardiovascular events [1]. While the prevalence of MetS is estimated to be 7.9-39% in developed countries, in a study conducted according to the criteria of the National Cholesterol Education Program: Adult Treatment Panel III (NCEP ATP III) [2], it was approximately 36.0-51.0% among adults. In another study, it was determined to be 39.7% [3]. It has been found that the prevalence of MetS is three times higher in individuals with T2DM in the USA, and it affects about one-third of the adult population [4]. However, according to the National Health and Nutrition Examination Survey (NHANES), the prevalence of MetS decreased by 24.0% in males and 22.0% in females [5].
A study linked the development of MetS to various lifestyle and environmental factors such as lack of physical activity and overeating, in addition to genetic and epigenetic factors [6]. Several criteria are used for diagnosing MetS, with many organizations adopting their particular diagnostic criteria typically referred to as harmonized MetS diagnostic criteria [7]. There is a strong and direct relationship between MetS and obesity, especially central obesity. Obesity is commonly accepted as one of the core components of MetS in different criteria sets [8]. A growing body of epidemiological evidence indicates that simple, easy-to-implement, and inexpensive anthropometric measures and indices can be used to predict MetS [9]. Measurements such as Body Mass Index (BMI), Waist Circumference (WC), and Waist-to-Height Ratio (WHtR) have been used in clinical practice for years. In addition to these measurements, obesity-related indices such as A Body Shape Index (ABSI), Body Roundness Index (BRI), Conicity Index (CI), and Visceral Adiposity Index (VAI) can also be used [10,11]. For the early diagnosis of MetS, non-invasive, simple, different, and easy-to-use indices associated with obesity are recommended [12].
The scope of this study is to investigate the use of obesity-related indices in defining MetS among adults.
METHODS
Design
This is a cross-sectional survey that focused on 2,720 adult volunteers from Ankara, the capital of Turkey. The data were collected by the researchers between August and October 2021. The study was approved by the institutional ethics review board (approval number: 08.27.2021/31). All procedures involving participants adhered to the institutional and/or national research committee’s ethical standards, and those described in the Declaration of Helsinki. All subjects provided written informed consent. Individuals who were pregnant, lactating, under the age of 18, over the age of 65, who used drugs for psychological reasons, who had any chronic diseases, or who did not wish to participate, were not included in the study.
Initially, 3,012 participants (M=442, F=2,570) aged 30-65 years participated in the study. All participants underwent a baseline assessment at the start of the study. Some participants did not wish to share their biochemical and anthropometric measurements and thus left the study. As a result, the final cohort comprised 2,720 participants: 410 males and 2,310 females. The number of participants with MetS was 90 males and 667 females, and the number of participants without MetS was 320 males and 1,643 females.
Anthropometric Measurement
All anthropometric measurements were taken by trained dieticians with participants wearing light clothes and no shoes. A portable scale was used to measure body weight to the nearest half-kilogram. Height was measured to the nearest 0.1cm with a wall-mounted stadiometer. Waist Circumference (WC) was measured above the iliac crest and below the lowest rib margin at minimum respiration. Hip Circumference (HC) was measured at the widest part of the hip at the level of the greater trochanter to the nearest half-centimeter [13]. Neck Circumference (NC) was measured at the midpoint of the neck, between the mid-cervical spine and mid-anterior neck, to within 0.1cm, using non-stretchable plastic tape with the subject standing and the head in the horizontal plane position. In men with a laryngeal prominence (Adam’s apple), it was measured just below the prominence. Waist-to-Hip Ratio (WHR) and Waist-to-Height Ratio (WHtR) were also evaluated. The percentage of total body fat (%), body water percentage (%), lean body mass (kg), and abdominal fat quotient were assessed using a Tanita BC 545 N multi-frequency bioimpedance analyzer (BIA).
Biochemical Parameters
Fasting Plasma Glucose (FPG) in participants was measured using a conventional method after 12 hours of overnight fasting. Venous blood samples were obtained from each participant early in the morning for biochemical screening tests. Venipuncture was performed to obtain 15mL of whole blood using a vacutainer by trained personnel. Serum Triglyceride (TG), High-Density Lipoprotein Cholesterol (HDL-C), and Total Cholesterol (TC) levels were measured by enzymatic colorimetric methods. The Low-Density Lipoprotein Cholesterol (LDL-C) was calculated by Friedewald and colleagues’ formula; LDL-C= TC - (HDL-C + (TG/5) [14].
Blood pressure (BP) was measured twice per person, and the mean of the consecutive measurements was determined (SBP: Systolic Blood Pressure, DBP: Diastolic Blood Pressure). Measurements were performed using a mercury sphygmomanometer with the patient in a sitting position.
Calculation of Indices
NCEP ATP-III criteria were used in the evaluation of MetS. Using anthropometric measurements, the MetS risk status was determined based on the definition criteria. Individuals were diagnosed with MetS if they met at least three of the five criteria below [15]:
Abdominal obesity (waist circumference ≥102cm in men, ≥88cm in women)
Fasting triglyceride level ≥150mg/dL
HDL-cholesterol level (<40mg/dL in men, <50mg/dL in women)
Blood pressure ≥130/85mmHg
Fasting blood sugar ≥100mg/dL
Calculations of obesity-related indices were made with the following formulas:
A body Shape Index (ABSI) = WC / (BMI2/3 × Height1/2) [16]
Abdominal Volume Index (AVI)= (2 × (WC)2 + 0.7 × (WC- HC)) / 1000 [17]
Body Adiposity Index (BAI) = (HC (cm) / Height (m)1.5) – 18 [18]
Body Roundness Index (BRI) = 364.2 – 365.5 × √(1 – ((WC / 2π)²/ (0.5 × Height )²) [12]
Conicity Index (CI) = WC / (0.109 x √(weight / height) ) [19]
Lipid-Accumulation Product (LAP) [20]
Male = (WC – 65) x TG
Female = (WC – 58) x TG
Visceral Adiposity Index (VAI) [21]
Male = [WC / (39.68 + (1.88 x BMI))] x (TG / 1.03) x (1.31 / HDL-C)
Female = [WC / (36.58 + (1.89 x BMI))] x (TG / 0.81) x (1.52 / HDL-C)
Waist-Triglyceride Index (WTI) = WC x TG [22]
Statistical Analysis
Statistical analyses were performed using the IBM®SPSS® (version 22) package program. Continuous variables (quantitative variables) obtained by measurement are given as mean, standard deviation, and minimum and maximum values, while categorical variables (qualitative variables) are given as frequency and percentage values. In the study, the suitability of the variables to normal distribution was tested, and in cases where parametric test conditions were not met, the Mann-Whitney U test was used for comparison of two independent groups. The chi-square (χ2) test was used in the evaluation of categorical variables. The significance level was accepted as p<0.05. In the logistic regression analysis, the dependent variable was the presence of MetS, the continuous variables were WTI, AVI, BAI, LAP, VAI, and BRI, and the independent variables were categorical factors of sex and age. Binary logistic regression was performed. ABSI and CI were not included in the logistic regression as they have collinearity (r>0.80). Results from the regression analysis were presented as odds ratios (OR) and 95% Confidence Intervals (CIs). Coxs and Snell 39% (0.39) and Nagelkerke 56% (0.56) were found as explanation rates in logistic regression and the significance level was accepted as p<0.05. The cut-off point was found using Receiver Operating Characteristic (ROC) analysis for the variables found to be effective as a result of logistic regression.
RESULTS
The study population consisted of 2,720 participants of both sexes (410 males, 2,310 females) with ages ranging from 30 to 65 years. The number of participants with MetS was 757, comprising 667 females and 90 males. The clinical characteristics of the participants are shown in Table 1, with 44.1% of the male participants in the age range of 30-50 years, while 55.9% of them were aged ≥51 years. On the other hand, 63.7% of the female participants were aged 30-50 years, whereas 36.3% of them were aged ≥51 years (p<0.001). Also, 45.5% of the males had a WC of ≥102cm and 71.8% of females had a WC of ≥88cm (p<0.001). The prevalence of fasting blood glucose levels ≥100mg/dL was 35.9% among males and 31.0% among females (p<0.05). Additionally, 40.4% of males and 28.9% of females had TG levels ≥150mg/dL (p<0.001). The percentages of males with an HDL-C <50mg/dL and females with an HDL-C <40mg/dL were 19% and 43.7%, respectively (p<0.001). Males with metabolic syndrome represented 22% of all participants, while females represented 28.9% (p<0.001).
Some clinical characteristics, anthropometric measurements, and biochemical parameters of study participants.
Anthropometric measurements and body compositions by MetS status of the participants are shown in Table 2. When male with MetS were compared with male without MetS, respectively: WC (107.1±9.63cm; 98.6±10.32cm), HC (107.6±8.67cm; 104.1±9.99cm), WHR (0.99±0.08; 0.95±0.08), WHtR (0.6±0.06; 0.5±0.05), NC (41.5 ± 3.72cm; 39.7±3.54cm), body fat (30.1±7.09%; 26.2±7.00%), and lean body mass (58.5-8.13kg; 55.8±7.27kg) were statistically significant (p<0.001). When females with MetS were compared with females without MetS, respectively: WC (104.0±11.31cm; 93.1±13.47cm), HC (113.6±10.75cm; 107.2±10.61cm), WHR (0.9±0.06; 0.8±0.08), WHtR (0.6±0.07; 0.5±0.09), NC (36.76±2.91cm; 34.8±2.75cm), body fat (40.3±5.47%; 35.9±7.04%), and lean body mass (44.9±5.55kg; 42.6±5.20kg) were statistically significant (p<0.001).
Anthropometric measurements and body composition by metabolic syndrome status of study participants.
Obesity-related indices values by MetS status of the participants are shown in Table 3. When males with MetS were compared with males without MetS, respectively: ABSI (0.083±0.00; 0.082±0.00), AVI (23.2±4.26; 19.7±4.10), BAI (29.8±4.39; 28.5±5.11), BRI (6.0±1.47; 5.0±1.45), CI (1.36±0.07; 1.31±0.07), LAP (109.1±68.99; 50.0±24.82), VAI (3.9±3.68; 1.5±0.82), and WTI (2804±168.24; 147.2±61.63) were statistically significant (p<0.001). When females with MetS were compared with females without MetS, respectively: ABSI (0.08 ± 0.00; 0.07±0.00), AVI (22.0±4.81; 17.9±5.07), BAI (40.2±6.38; 36.3±6.38), BRI (7.1±2.06; 5.4±2.1), CI (1.3±0.09; 1.2±0.10), LAP (95.0±52.06; 44.2±23.37), VAI (3.7±2.39; 1.7±0.72), and WTI (215.8±108.12; 117.3±44.97) were statistically significant (p<0.001).
Binary logistic regression analysis of MetS presence is shown in Table 4. Compared to males, the odds ratio (OR) and 95% confidence interval (95% CI) values for the risk of MetS were 2.652 (1.437-4.878) in females (p<0.001). Similarly, individuals aged 51 years and older had odds ratio (OR) and 95% confidence interval (95% CI) values of 1.587 (1.244-2.026) compared to those aged 30-50 years (p<0.001).
The odds ratio (OR) and 95% confidence interval (95% CI) values for the risk of MetS were 1.035 (1.021-1.049) for WTI, 1.045 (1.012-1.079) for BAI, 1.084 (1.051-1.119) for LAP, and 5.789 (4.536-7.388) for VAI (p<0.001).
It was deemed appropriate to investigate the cut-off values that can be used in the diagnosis of metabolic syndrome for the variables WTI, BAI, VAI, and LAP, which were found to be effective in logistic regression. Table 5 shows the ROC Area Under the Curve (AUC) values and significance of the variables, and Figure 1 shows the ROC graphs. In Table 5, since the AUC values for WTI, VAI, and LAP variables were determined as >0.75, it was concluded that a cut-off could be identified for these variables.
Considering the ROC curves in Figure 1 and the AUC values shown in Table 5, cut-off values were identified for the WTI, VAI, and LAP variables. In the prediction of the presence of metabolic syndrome, the AUC was statistically significant for WTI (0.858±0.008 (0.842-0.874); p<0.05), VAI (0.872±0.008 (0.857-0.887); p<0.05), and LAP (0.873±0.007 (0.858-0.887); p<0.05). The cut-off value with 80.10% sensitivity and 77.0% specificity for the WTI variable was 151.510, the cut-off value with 80.10% sensitivity and 77.30% specificity for VAI was 2.211, and the cut-off value with 80.20% sensitivity and 78.10% specificity for LAP was 6.252.
DISCUSSION
It has been suggested that abdominal visceral adiposity plays a role in the development of MetS [9]. Although WC and BMI were seen by a study as the best predictors for MetS or the best tools for defining MetS in a certain age or sex group, it also emphasized that using alternative indices can provide better estimates [23].
In individuals with T2DM, BRI is associated with the presence of MetS in both men and women [24], and a significant positive correlation is found between the presence of MetS and HDL-C levels and inversely, whereas a significant negative correlation is found between MetS and TG, fasting plasma glucose, and systolic blood pressure [25]. In another study, a higher incidence of metabolic abnormalities, including high fasting blood glucose and low HDL-C, was found in women [8]. In this study, 35.9% of men and 31% of women had a fasting blood glucose of ≥100mg/dL, and 40.4% of men and 28.9% of women had a TG of ≥150mg/dL. Additionally, HDL-C was <50mg/dL in 19% of men and <40mg/dL in 43.7% of women (p<0.001, Table 1).
Thomas et al. [12] developed BRI and suggested that it is a good indicator of body fat. BRI is also defined, among other indices, as the most suited for predicting MetS [26]. VAI was found to be a better predictor of MetS than BRI [10]. In the study of Endukuru, body weight, BMI, WC, WHR, WHtR, and body fat (%) were lower, and body lean (%) was higher in men and women with MetS compared to the control group. In addition, all obesity-related indices (ABSI, AVI, BAI, BRI, CI, LAP, VAI, and WTI) were statistically higher in men and women with MetS [1]. In this study, WC, HC, WHR, WHtR, NC, body fat (%), and lean body mass were higher in men and women with MetS compared to those without MetS (Table 2), and all obesity-related indices were higher in individuals with MetS (p<0.001, Table 3).
It has been determined that LAP is a better index than some anthropometric measurements and atherogenic indices for predicting MetS [27]. According to a study to determine the prevalence of MetS in rural China, VAI, LAP, BAI, and WHtR were strongly associated with the likelihood of MetS in both men and women. According to the ROC analysis, the index with the highest AUC value among the indices is LAP, and it has been determined as the index that most accurately describes the MetS status for both sexes [28]. Similarly, in this study, according to ROC analysis, LAP was found to be the index with the highest AUC value among the indices (Table 5).
In the cohort study conducted by Zhang et al. [29], it was concluded that every 5-unit increase in LAP increases the risk of MetS, and LAP can be a reliable index to detect individuals with MetS. In another study, it was stated that LAP in adults was a better indicator than VAI and WTI for identifying individuals with MetS [30]. In the study by Chiu et al. [11], TyG index and VAI performed best in determining MetS among obesity-related indices (BMI, WHR, WHtr, ABSI, AVI, BAI, BRI, CI, VAI, and triglyceride glucose index) evaluated in adults. ABSI was found to be the weakest predictor of MetS [11]. In the comprehensive systematic review and meta-analysis study by Bijari et al. [31] it was determined that VAI performed quite well as a screening tool for MetS [31]. In a study conducted with a Turkish population of older individuals with MetS, VAI was found to be more effective in predicting MetS than the other seven indexes (BMI, WC, WHR, WHtR, CI, AVI, ABSI, and BRI) [32]. In another study, the prevalence of MetS was determined as 48% in adults, and BRI and LAP were found to be the most effective indicators for diagnosing MetS [33]. In this study, BRI and LAP values were also high in participants with MetS (p<0.001, Table 3). In the study conducted by Yilmaz et al. [34] VAI cut-off values (male 3.1 and female 4.1) were found to predict MetS similarly to the study conducted in Iran (male 4.1 and female 4.2) [10]. In a prospective study, the risk of MetS was evaluated in the context of WC, BMI, WHtR, ABSI, AVI, BAI, BRI, CI, and VAI, with the latter being regarded as the best index for the diagnosis of MetS [35]. In the present study, the VAI value was found to be high in participants with MetS (p<0.001, Table 3). In addition, VAI was more effective in predicting the risk of MetS than other indexes (WTI, BAI, and LAP) (p<0.001, Table 4).
It has been determined that AVI can be a useful screening tool to identify MetS in both sexes [36]. In the study by Wang et al. [35], it was found that BMI in men and AVI in women were effective in predicting MetS, although there were no significant differences compared to WC. It has been reported that BAI is less predictive for the diagnosis of MetS than BMI and other adiposity indices (WC and WHtR) [37]. In the present study, BAI was a predictor of MetS risk, while AVI was not (Table 4). In a study, it has been shown that some anthropometric indices, including the LAP and CI, are better predictors of MetS [33].
In a systematic review, it was emphasized that the presence of MetS has the potential to increase abdominal obesity, WHtR, and BMI values, and thus increase the risk of obesity-related chronic diseases and the associated public health burden [38]. In the study by Stefanescu et al. [9] BRI was effective in predicting MetS in Peruvian men and women 2.43 (OR, 95%) and 1.89 (OR, 95%), respectively. BRI has been identified as a useful clinical predictor of MetS in adults. However, in this study, BRI was not found to be a predictor of MetS (Table 4).
In a study, it has been shown that the frequency of MetS steadily and significantly increases with age. When the analysis of results by sex in different age groups was examined, it was found that the prevalence was higher in men aged 30-39 than in women. MetS was found to be significantly more common in women than in men [39]. In the systematic review and meta-analysis, it was found that women have a higher prevalence of MetS compared to men [40]. The present study found that compared to males, the odds ratio (OR) and 95% confidence interval (95% CI) values for the risk of MetS were 2.652 (1.437-4.878) in females (p<0.001). At the same time compared to 30-50 year olds, the odds ratio (OR) and 95% confidence interval (95% CI) values for the risk of MetS were 1.587 (1.244-2.026) in 51-year-olds and older (p<0.001, Table 4). Generally, it can be said that a collection of unhealthy behaviors such as unhealthy diet, obesity, reduced physical activity, untreated dyslipidemia and high blood pressure, changes in serum insulin, and other physiological and environmental factors are responsible for increased prevalence of MetS at older ages [41]. Reduced physical activity and increased subcutaneous fat due to anatomic reasons in women of all ages may explain the higher prevalence of obesity and subsequent MetS compared to men.
The study’s strengths include the assessment of both men and women, allowing for a comparison of data based on sex. The study’s limitations include the fact that it was conducted solely in Ankara, the capital of Turkey, making it difficult to generalize the results. In order to generalize the research results, comprehensive studies involving participants from different regions are needed.
CONCLUSION
MetS is a complex syndrome that can be assessed using criteria from various authorities. While different obesity-related indices and predictors vary in strength, they all play a role in determining MetS. In this study, WTI, BAI, LAP, and VAI, which are different obesity-related indices, were found to be predictive of MetS. It was found that VAI was more effective in predicting the risk of MetS than other indices (WTI, BAI, and LAP). The presence of metabolic syndrome was identified at values exceeding the cut-offs determined for the WTI, BAI, and LAP variables. In addition, according to ROC analysis, LAP was found to be the index with the highest AUC value among the indices.
These different obesity-related indices, which were developed due to the limitations of traditional anthropometric measurements, may be advantageous for their clinical use, as they are non-invasive and cost-effective. Therefore, they can be used as a complement to the commonly used traditional anthropometric measurements in predicting MetS. Although it is thought that different obesity-related indices are effective in the determination of MetS and their use may be an alternative, it is suggested that clinical and epidemiological studies will be a more effective step in the detection, reduction, and prevention of MetS.
ACKNOWLEDGEMENTS
We thank the volunteers who participated in the study.
-
How to cite this article: Sanlier N, Yildiz E, Özyalçın B, Ejder ZB, Irmak E, Kocabaş S. Could eight obesity-related indices be effective in predicting the risk of metabolic syndrome in young and middle-aged adults? A cross-sectional study. Rev Nutr. 2024;37:e230203. https://doi.org/10.1590/1678-9865202437e230203
REFERENCES
- 1 Endukuru CK, Gaur GS, Dhanalakshmi Y, Sahoo J, Vairappan B. Cut-off values and clinical efficacy of body roundness index and other novel anthropometric indices in identifying metabolic syndrome and its components among Southern-Indian adults. Diabetol Int. 2021;13(1):188-200.
- 2 Obeidat AA, Ahmad MN, Haddad FH, Azzeh FS. Alarming high prevalence of metabolic syndrome among Jordanian adults. Pak J Med Sci. 2015;31(6):1377-82.
- 3 Venugopal V, Dongre AR, Saravanan S. Prevalence and determinants of metabolic syndrome among the rural adult population of Puducherry. Indian J Community Med. 2019;44(1):21-5.
- 4 Saklayen MG. The global epidemic of the metabolic syndrome. Curr Hypertens Rep. 2018;20(2):12.
- 5 Swarup S, Goyal A, Grigorova Y, Zeltser R. Metabolic syndrome. Treasure Island (FL): StatPearls; 2022.
- 6 Fathi Dizaji B. The investigations of genetic determinants of the metabolic syndrome. Diabetes Metab Syndr. 2018;12(5):783-9.
- 7 Nilsson PM, Tuomilehto J, Rydén L. The metabolic syndrome: What is it and how should it be managed? Eur J Prev Cardiol. 2019;26(2):33-46.
- 8 Al-Shami I, Alkhalidy H, Alnaser K, Mukattash TL, Al Hourani H, Alzboun T, et al. Assessing metabolic syndrome prediction quality using seven anthropometric indices among Jordanian adults: A cross-sectional study. Sci Rep. 2022;12(1):21043.
-
9 Stefanescu A, Revilla L, Lopez T, Sanchez SE, Williams MA, Gelaye B. Using A Body Shape Index (ABSI) and Body Roundness Index (BRI) to predict risk of metabolic syndrome in Peruvian adults. J Int Med Res. 2020;48(1):300060519848854. http//doi.org/10.1177/0300060519848854
» https://doi.org/10.1177/0300060519848854 - 10 Baveicy K, Mostafaei S, Darbandi M, Hamzeh B, Najafi F, Pasdar Y. Predicting metabolic syndrome by visceral adiposity index, body roundness index and a body shape ındex in adults: A cross-sectional study from the Iranian RaNCD cohort data. Diabetes Metab Syndr Obes. 2020;13:879-87.
- 11 Chiu TH, Huang YC, Chiu H, Wu PY, Chiou HYC, Huang JC, et al. Comparison of various obesity-related indices for identification of metabolic syndrome: A population-based study from Taiwan biobank. Diagnostics. 2020;10(12):1081.
- 12 Thomas DM, Bredlau C, Bosy-Westphal A, Mueller M, Shen W, Gallagher D, et al. Relationships between body roundness with body fat and visceral adipose tissue emerging from a new geometrical model. Obesity. 2013;21(11):2264-71.
- 13 Lohman TG, Roche AF, Martorell R, editors. Anthropometric standardization reference manual. Champaign, IL: Kinetics Books; 1988.
- 14 Friedewald WT, Levy RI, Fredrickson DS. Estimation of the concentration of low-density lipoprotein cholesterol in plasma, without use of the preparative ultracentrifuge. Clin Chem. 1972;18(6):499-502.
- 15 Alberti KG, Zimmet P, Shaw J. Metabolic syndrome: A new world-wide definition. A Consensus Statement from the International Diabetes Federation. Diabet Med. 2006;23(5):469-80.
- 16 Krakauer NY, Krakauer JC. A new body shape index predicts mortality hazard independently of body mass index. Plos One. 2012;7(7):e39504.
- 17 Abdominal volume index. An anthropometry-based index for estimation of obesity is strongly related to impaired glucose tolerance and type 2 diabetes mellitus. Arch Med Res. 2003;34(5):428-32.
- 18 Bergman RN, Stefanovski D, Buchanan TA, Sumner AE, Reynolds JC, Sebring NG, et al. A better index of body adiposity. Obesity (Silver Spring). 2011;19(5):1083-89.
- 19 Valdez R, Seidell JC, Ahn YI, Weiss KM. A new index of abdominal adiposity as an indicator of risk for cardiovascular disease: A cross-population study. Int J Obes Relat Metab Disord. 1993;17(2):77-82.
- 20 Kahn HS. The lipid accumulation product is better than BMI for identifying diabetes: A population-based comparison. Diabetes Care. 2006;29(1):151-3.
- 21 Amato MC, Giordano C, Galia M, Criscimanna A, Vitabile S, Midiri M, et al. Visceral adiposity index: a reliable indicator of visceral fat function associated with cardiometabolic risk. Diabetes Care. 2010;3(4):920-22.
- 22 Yang RF, Liu XY, Lin Z, Zhang G. Correlation study on waist circumference-triglyceride (WT) index and coronary artery scores in patients with coronary heart disease. Eur Rev Med Pharmacol Sci. 2015;19(1):113-8.
- 23 Guo X, Ding Q, Liang M. Evaluation of eight anthropometric indices for identification of metabolic syndrome in adults with diabetes. Diabetes Metab Syndr Obes. 2021;14:1431-43.
- 24 Liu B, Liu B, Wu G, Yin F. Relationship between body roundness index and metabolic syndrome in type 2 diabetes. Diabetes Metab Syndr Obes. 2019;12:931-5.
- 25 Bakaloudi DR, Chrysoula L, Kotzakioulafi E, Theodoridis X, Chourdakis M. Impact of the level of adherence to Mediterranean diet on the parameters of metabolic syndrome: A systematic review and meta-analysis of observational studies. Nutrients. 2021;13(5):1514.
- 26 Xu J, Zhang L, Wu Q, Zhou Y, Jin Z, Li Z, et al. Body roundness index is a superior indicator to associate with the cardio-metabolic risk: Evidence from a cross: Sectional study with 17,000 Eastern-China adults. BMC Cardiovasc Disord. 2021;21(1):97.
- 27 Zhang XH, Zhang M, He J, Yan YZ, Ma JL, Wang K, et al. Comparison of anthropometric and atherogenic indices as screening tools of metabolic syndrome in the Kazakh adult population in Xinjiang. Int J Environ Res Public Health. 2016;13(4):428.
- 28 Guo SX, Zhang XH, Zhang JY, He J, Yan YZ, Ma JL, et al. Visceral adiposity and anthropometric indicators as screening tools of metabolic syndrome among low income rural adults in Xinjiang. Sci Rep. 2016;6:36091.
- 29 Zhang X, Hong F, Liu L, Nie F, Du L, Guan H, et al. Lipid accumulation product is a reliable indicator for identifying metabolic syndrome: The China Multi-Ethnic Cohort (CMEC) Study. QJM. 2022;115(3):140-7.
- 30 Li Y, Zheng R, Li S, Cai R, Ni F, Zheng H, et al. Association between four anthropometric indexes and metabolic syndrome in US adults. Front Endocrinol. 2022;13:889785.
- 31 Bijari M, Jangjoo S, Emami N, Raji S, Mottaghi M, Moallem R, et al. The accuracy of visceral adiposity index for the screening of metabolic syndrome: A systematic review and meta-analysis. Int J Endocrinol. 2021;6684627.
- 32 Ozturk EE, Yildiz H. Evaluation of different anthropometric indices for predicting metabolic syndrome. Eur Rev Med Pharmacol Sci. 2022;26(22):8317-25.
- 33 Datta Banik S, Pacheco-Pantoja E, Lugo R, Gomez-de-Regil L, Ake RC, Gonzalez RMM, et al. Evaluation of anthropometric indices and lipid parameters to predict metabolic syndrome among adults in Mexico. Diabetes Metab Syndr Obes. 2021;14: 691-701.
- 34 Yilmaz SK, Ozcicek F, Mertoglu C. Comparison of traditional and novel obesity-related indices for identification of metabolic sydrome in adults. Cukurova Med J. 2022;47(1):62-70.
- 35 Wang H, Liu A, Zhao T, Gong X, Pang T, Zhou Y, et al. Comparison of anthropometric indices for predicting the risk of metabolic syndrome and its components in Chinese adults: A prospective, longitudinal study. BMJ Open. 2017;7(9):e016062.
- 36 Wu Y, Li H, Tao X, Fan Y, Gao Q, Yang J. Optimised anthropometric indices as predictive screening tools for metabolic syndrome in adults: A cross-sectional study. BMJ Open. 2021;11(1):e043952.
- 37 Shin KA, Hong SB, Shin KS. Body adiposity index and metabolic syndrome risk factors in Korean adults: A comparison with body mass index and other parameters. Biomed Sci Lett. 2017;23(2):57-63.
- 38 Bendall CL, Mayr HL, Opie RS, Bes-Rastrollo M, Itsiopoulos C, Thomas CJ. Central obesity and the Mediterranean diet: A systematic review of intervention trials. Crit Rev Food Sci Nutr. 2018(18);58:3070-84.
- 39 Kalan Farmanfarma K, Kaykhaei MA, Adineh HA, Mohammadi M, Dabiri S, Ansari-moghaddam A. Prevalence of metabolic syndrome in Iran: A meta-analysis of 69 studies. Diabetes Metab Syndr. 2019;13(1):792-9.
- 40 Krishnamoorthy Y, Rajaa S, Murali S, Rehman T, Sahoo J, Sekhar S. Prevalence of metabolic syndrome among adult population in India: A systematic review and meta-analysis. Plos One. 2020;15(10):e0240971.
- 41 Khosravi-Boroujeni H, Sarrafzadegan N, Sadeghi M, Roohafza H, Talaei M, Ng S, et al. Secular trend of metabolic syndrome and its components in a cohort of Iranian adults from 2001 to 2013. Metab Syndr Relat Disord. 2017;15(3):137-44.
Edited by
-
Editors
Dirce Maria Lobo Marchioni, Luciana Bertoldi Nucci

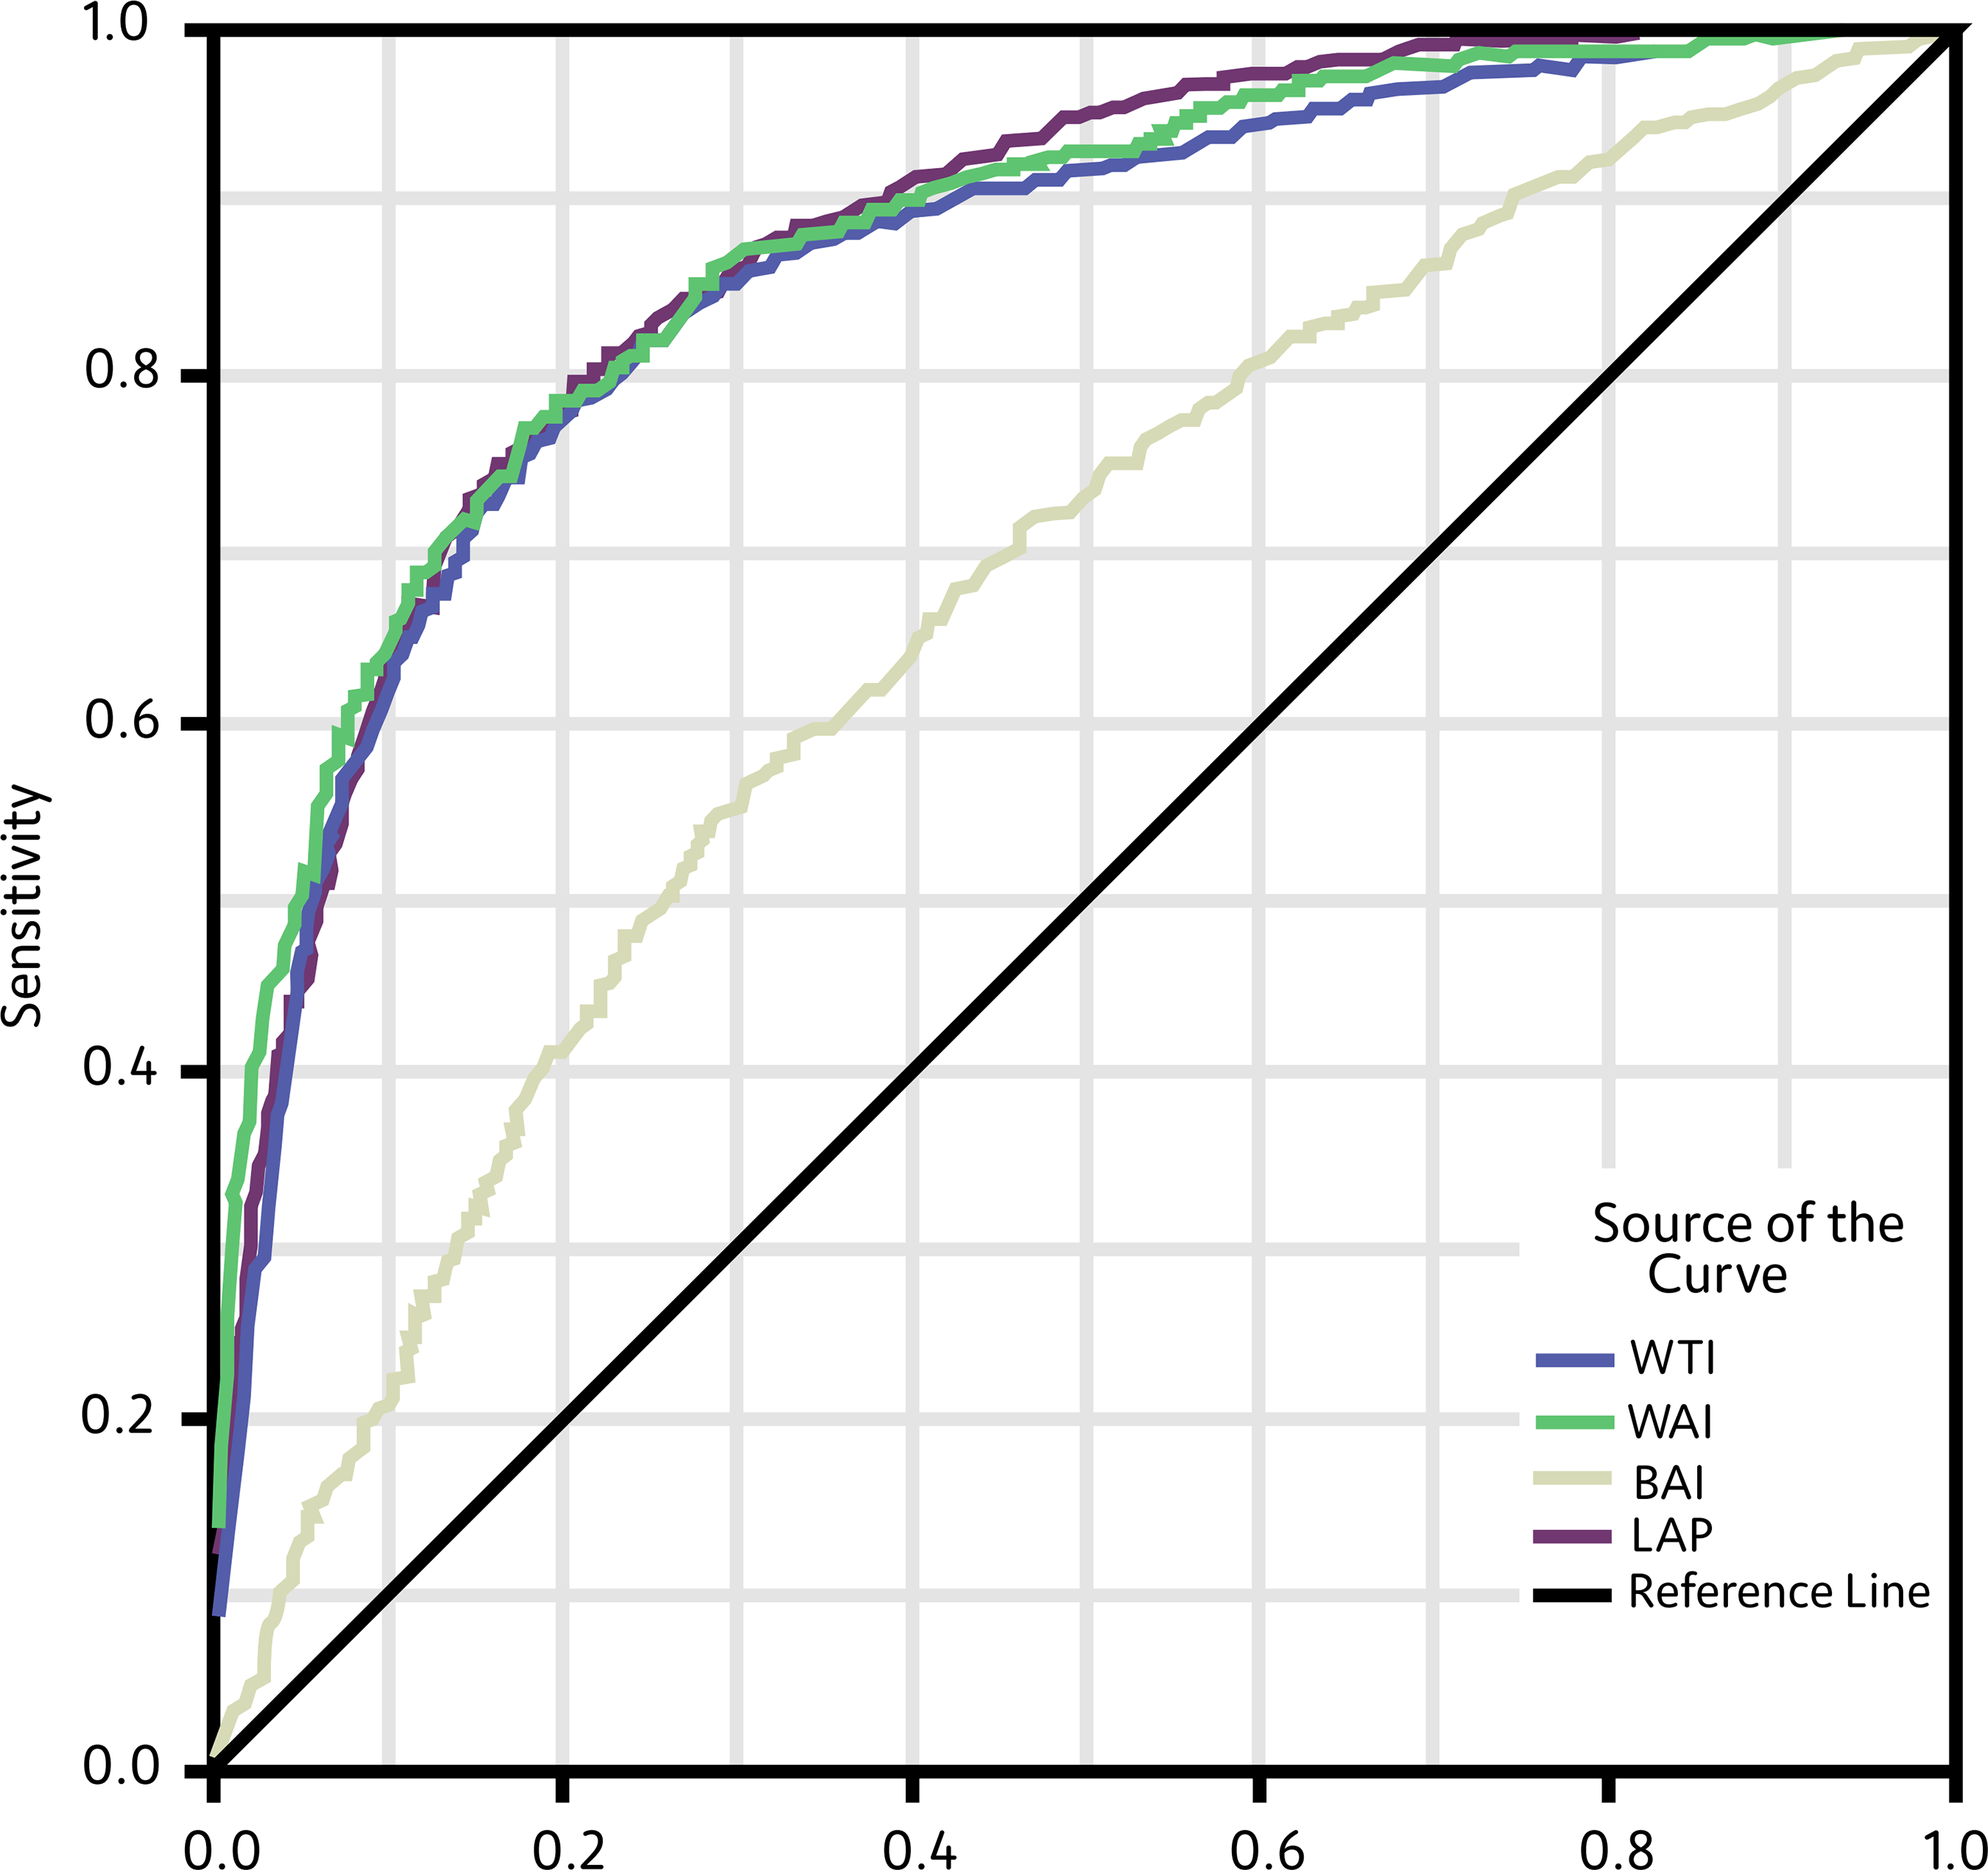 Note: WTI: Waist-Triglyceride İndex; VAI: Visceral Adiposity İndex; BAI: Body Adiposity İndex; LAP: Lipid-Accumulation Product.