Spectral and vocal tract diagram differences in spoken and sung vowel production by soprano singers
ABSTRACT
Purpose: to describe and analyze possible acoustic differences in the vowel /a/ emitted in speech at habitual pitch and in singing at a low pitch by soprano singers, through fundamental frequency, formants, and the association between Fast Fourier Transform (FFT), Linear Predictive Coding (LPC), and vocal tract diagram (VTD).
Methods: an exploratory study with samples of 32 adult professional sopranos, without complaints and/or self-reported vocal alterations. Three repetitions of the vowel /a/ were analyzed in habitual speech pitch and in sung emission at a low pitch (C3, 261 Hz), totaling 192 samples. In addition to analyses by LPC, FFT, and VTD, measurements of the fundamental frequency (f0) and the first five formants (F1, F2, F3, F4, and F5) were extracted.
Results: in the sung vowel, the average f0 was 259 Hz, F1 was close to the value observed in spoken emission, F1 values were higher than f0, in F2, correspondence was observed in the FFT and LPC overlaps and in the VTD tracing.
Conclusion: the increase in F2 in the sung vowel as compared to the spoken vowel was probably caused by modifications in the vocal tract, as observed in the VTD. The FFT, LPC, and VTD analyses indicated distinctions between the spoken vowel in habitual pitch and the sung vowel in low pitch by soprano singers.
Keywords:
Voice; Acoustics; Speech Acoustics; Speech-Language Pathology
RESUMO
Objetivo: descrever e analisar possíveis diferenças acústicas apresentadas na vogal /a/ emitida na fala em tom habitual e no canto em tom grave por cantoras sopranos, por meio da frequência fundamental, dos formantes e da associação entre Fast Fourier Transform (FFT), Linear Predictive Coding (LPC) e diagrama do trato vocal (DTV).
Métodos: estudo exploratório com amostras de 32 sopranos profissionais adultas, sem queixas e/ou alterações vocais autorreferidas. Foram analisadas três repetições da vogal /a/ em tom habitual de fala e na emissão cantada no tom grave (C3, 261Hz), totalizando 192 amostras. Além de serem realizadas as análises por LPC, por FFT e pelo DTV, foram extraídas as medidas da frequência fundamental (f0) e as dos cinco primeiros formantes (F1, F2, F3, F4 e F5).
Resultados: na vogal cantada, a f0 média foi de 259 Hz, F1 aproximou-se do valor observado na emissão falada, os valores de F1 foram maiores que a f0, em F2, observou-se correspondência nas sobreposições de FFT e LPC e no traçado do DTV.
Conclusão: o aumento do segundo formante na vogal cantada em relação à falada provavelmente foi ocasionado pelas modificações do trato vocal, como se observou no DTV. As análises apresentadas de FFT, LPC e DTV indicaram distinções entre a vogal falada no tom habitual e cantada no tom grave realizadas por cantoras sopranos.
Descritores:
Voz; Acústica; Acústica da Fala; Fonoaudiologia
INTRODUCTION
Vocal assessment is an integral component of speech-language-hearing clinical treatment. A comprehensive voice assessment is a multidimensional process that includes a medical history survey, patient-centered self-assessment measures, imaging exams to diagnose and understand laryngeal function and structural condition, such as fiberoptic nasolaryngoscopy, and auditory-perceptual and acoustic evaluation to detail aspects of vocal quality1-4.
Acoustic analysis provides quantifiable data on vocal emission, in addition to visual resources, such as spectrography, which allows the correlation of these data with each other and with auditory-perceptual and physiological aspects of vocal production5,6.
Although spontaneous speech is the most accurate reflection of natural communication patterns, sustained vowels constitute a central task in all vocal assessment procedures7,8. The relative stability of sustained vowels facilitates obtaining reliable acoustic measures and identifying the characteristics of voice quality7-9. However, singers commonly use their voices in singing, especially in low tones, which can make it difficult to acoustically distinguish it from a sustained spoken vowel10.
Thus, this acoustic similarity can interfere with the understanding of the vocal adjustment made at the time of voice recording, making it challenging to determine whether the patient is sustaining a spoken vowel or performing a prolonged musical note in a low tone11. In addition, sustaining a sung vowel, compared to a spoken one, can generate differences in acoustic measurements due to variations in vocal spectra, formant bandwidths, and intensity levels between singing and speech12-14.
One of the analyses of interest refers to formants. The literature describes the existence of four formants: F1 occurs in the posterior cavity of the mouth, ranging from 250 to 700 Hz, and is related to the opening of the mandible, the height of the tongue in the oral cavity, and pharyngeal constriction, F2 is associated with modification of the tongue body, horizontal displacement of the tongue, and posterior elevation of the tongue, ranging from 700 to 2500 Hz, F3 refers to the influence of the cavity located immediately behind the lower incisors, and F4 is associated with the length of the vocal tract, configuration of the laryngeal tube, and volume of the laryngeal ventricle15,16.
Other acoustic analyses that help to understand source and filter characteristics are Linear Predictive Coding (LPC), which determines formant peaks of sound, and digital analysis of the Fast Fourier Transform (FFT) spectrum, which shows the amplitude of the fundamental frequency (f0) and harmonics17,18.
The combination of these analyses, FFT and LPC, provides important information for understanding the sound behavior in singers, expanding the investigation beyond spectrographic analysis. This approach allows observation of the interaction between harmonics and formants through overlapping harmonic spectrum diagrams (FFT) and formant curves (LPC), making it possible to verify tonal variations in a specific time window and identify modifications in the vocal tract11,17-22. These techniques are consolidated in the literature, applied in different contexts, including the description of vocal acoustic behavior in male singers, especially in the characterization of the singer's formant15,23. In contrast, in female voices, specifically sopranos, studies regarding the acoustic description in the lower register are more limited compared to research studying high tones24,25.
A previous study with 30 sopranos without vocal complaints analyzed the variation of f0 and formants from the emission of the vowel /a/ and demonstrated differences in the behavior of the sound f0 and formants. By comparing different f0 tones in the singing voice: low (261 Hz), medium (622 Hz), and high (932 Hz), it pointed out specific modifications of the vocal tract, with an extra gain range at 261 Hz, tuning between formant and harmonic peaks at 622 Hz and equalization of f0 and F1 at 932 Hz. This study also conducted an initial test with the vocal tract diagram (VTD), using the free software Praat, as an alternative for visualizing constrictions and expansions compatible with the acoustic measurements analyzed in the three tones investigated22.
The acoustic investigation with VTD allows the union of combined FFT and LPC analyses and the observation of the vocal tube, with its modifications, by algorithmic graphic prediction. Its practical applicability in the care of singers, including sopranos, could be part of the speech-language-hearing assessment, as an additional and relevant imaging tool in understanding adjustments in singing. This instrument could contribute to the improvement of vocal technique in different areas, such as singing pedagogy, vocal speech-language-hearing assessment, and clinical reasoning. Furthermore, no studies were found that had used acoustic formant measurements in association with the investigation modalities mentioned above in the analysis of soprano singers' voices.
Therefore, this study aimed to describe and analyze possible acoustic differences in the vowel /a/ emitted in speech in habitual tone and in singing in low tone by soprano singers, through f0, formants, and the association between FFT, LPC, and VTD.
METHODS
This is an exploratory, descriptive, analytical study of retrospective samples of sustained vowels in habitual speech and sung vowels by sopranos, using the data collection database from previous research. The continuation of the study was approved as an amendment to the original project (opinion number 6.752.277, CAAE 56690616.1.0000.0065, Medical School of the University of São Paulo, SP, Brazil).
The study included 32 soprano opera singers, native speakers of Brazilian Portuguese, from different professional choirs in the city of São Paulo, the OSESP Foundation, the Theatro Municipal Foundation, and the Opera Center of the São Paulo State Music School (EMESP). As an inclusion criterion, all sopranos had to present values within the normal range in the selected acoustic measures of disturbance and noise, extracted from the habitual speech sample: local jitter (%) > 1.040, jitter rap (%) 0.680, local shimmer (%) > 3.810, local shimmer (dB) > 0.350, and the harmonicity measure (HNR) > 20 dB26.
The sample characterization consisted of soprano singers aged 20 to 45 years (mean = 27.2 years), without reported vocal complaints, with an average professional performance time of 7.2 years, and completed classical singing training27,28.
Samples of the sustained vowel /a/ were analyzed, corresponding to three repetitions of each task, in habitual speech and in sung emission in the low tone, C3 (middle C), low pitch 261 Hz, in the same way as Weiss et al. (2001)29. The analysis was performed using Praat software, version 6.1.34, on a 64-bit Windows 10 operating system. For formant extraction, the first 5 seconds of stable emission were considered for both speech and singing, in the same way as Weiss et al. (2001)29 and Sundberg (2009)30.
The procedures were carried out as described below.
The measures were extracted considering the following acoustic parameters: 1) In the spoken emission in habitual tone, the measurements of f0, F1, F2, F3, F4, and F5 of the vowel /a/ were extracted; 2) In the sung vowel emission, the extractions of f0, F1, F2, F3, F4, and F5 were analyzed, in the key of C3 (Middle C), low pitch, 261 Hz. For this procedure, all samples were segmented, selecting the stable emission on the spectrographic plate and the identification of pulse marking in the sound wave18,22,26; the extraction of f0 values considered the opening of the spectrographic window for pitch identification in the range of 75 to 500 Hz and the scale for formants F1, F2, F3, F4, and F5. The “Maximum Formant” parameter of Praat was adjusted to 5500 Hz, suitable for female voices; the extraction of formants F1, F2, F3, and F4 used the wideband window, considering the values standardized by the Praat software. The F5 values were obtained from the selection of the sound wave pulse17,18,22,26.
After segmenting and checking the sound waves, the extracted data were organized into Excel spreadsheets, and descriptive statistical analysis was performed using Jamovi software (version 2.3.28).
The following sequence was performed to extract the harmonic spectrum via FFT: resampling the audio file in WAV format; in the object window, in the “Convert” menu, adjusting the sampling rate to 10000 Hz, with a sampling precision of 50; then, in “View & Edit”, analyzing the spectrogram of the WAV file to confirm that the window was in a narrow band; after inspecting the sound wave cycles, selecting the wave pulse marked by the software and viewing the spectral window; after opening this window, selecting up to approximately 5000 Hz, preserving the frequency range of speech; then, verifying all the activity performed in the Praat object window. The “spectrum” file, with the analyzed temporal marking, is then available for the following steps of overlap and image generation; for image generation, the Praat “Pictures” window was kept open, with the previously established pink border. Then, the objects window was accessed again, in the previously analyzed “spectrum” file, and the “Draw” command was used, maintaining the software settings for plotting the illustration; this drawing window is intended for graphics generated by Praat.
Next, the LPC curves were obtained, and for this, the following actions were necessary: converting the file with the sampling rate, as performed in the FFT graph, to guarantee the sharpness of the tracing and definition of the first five formants; selecting the desired file in the Praat object window; the “Convert” menu enables new analysis functions, and selecting “LPC smoothing” will open a new window to enter the desired number of peaks for analysis. This study considered five formant peaks; for this, the definition indicated by the program “Pre-emphasis 50.0 Hz” must be maintained. The “Draw” command is used to generate the illustration, following the software's instructions. It is possible to establish the sizing in the drawing window, if it is necessary to increase or decrease the graph, by selecting the pink margin rectangle, as described in previous studies18,22,26. The graphs can be saved individually or overlapped, as proposed in this study, so that the harmonic behavior, the formant curve, and their possible source-filter correspondences can be visualized together.
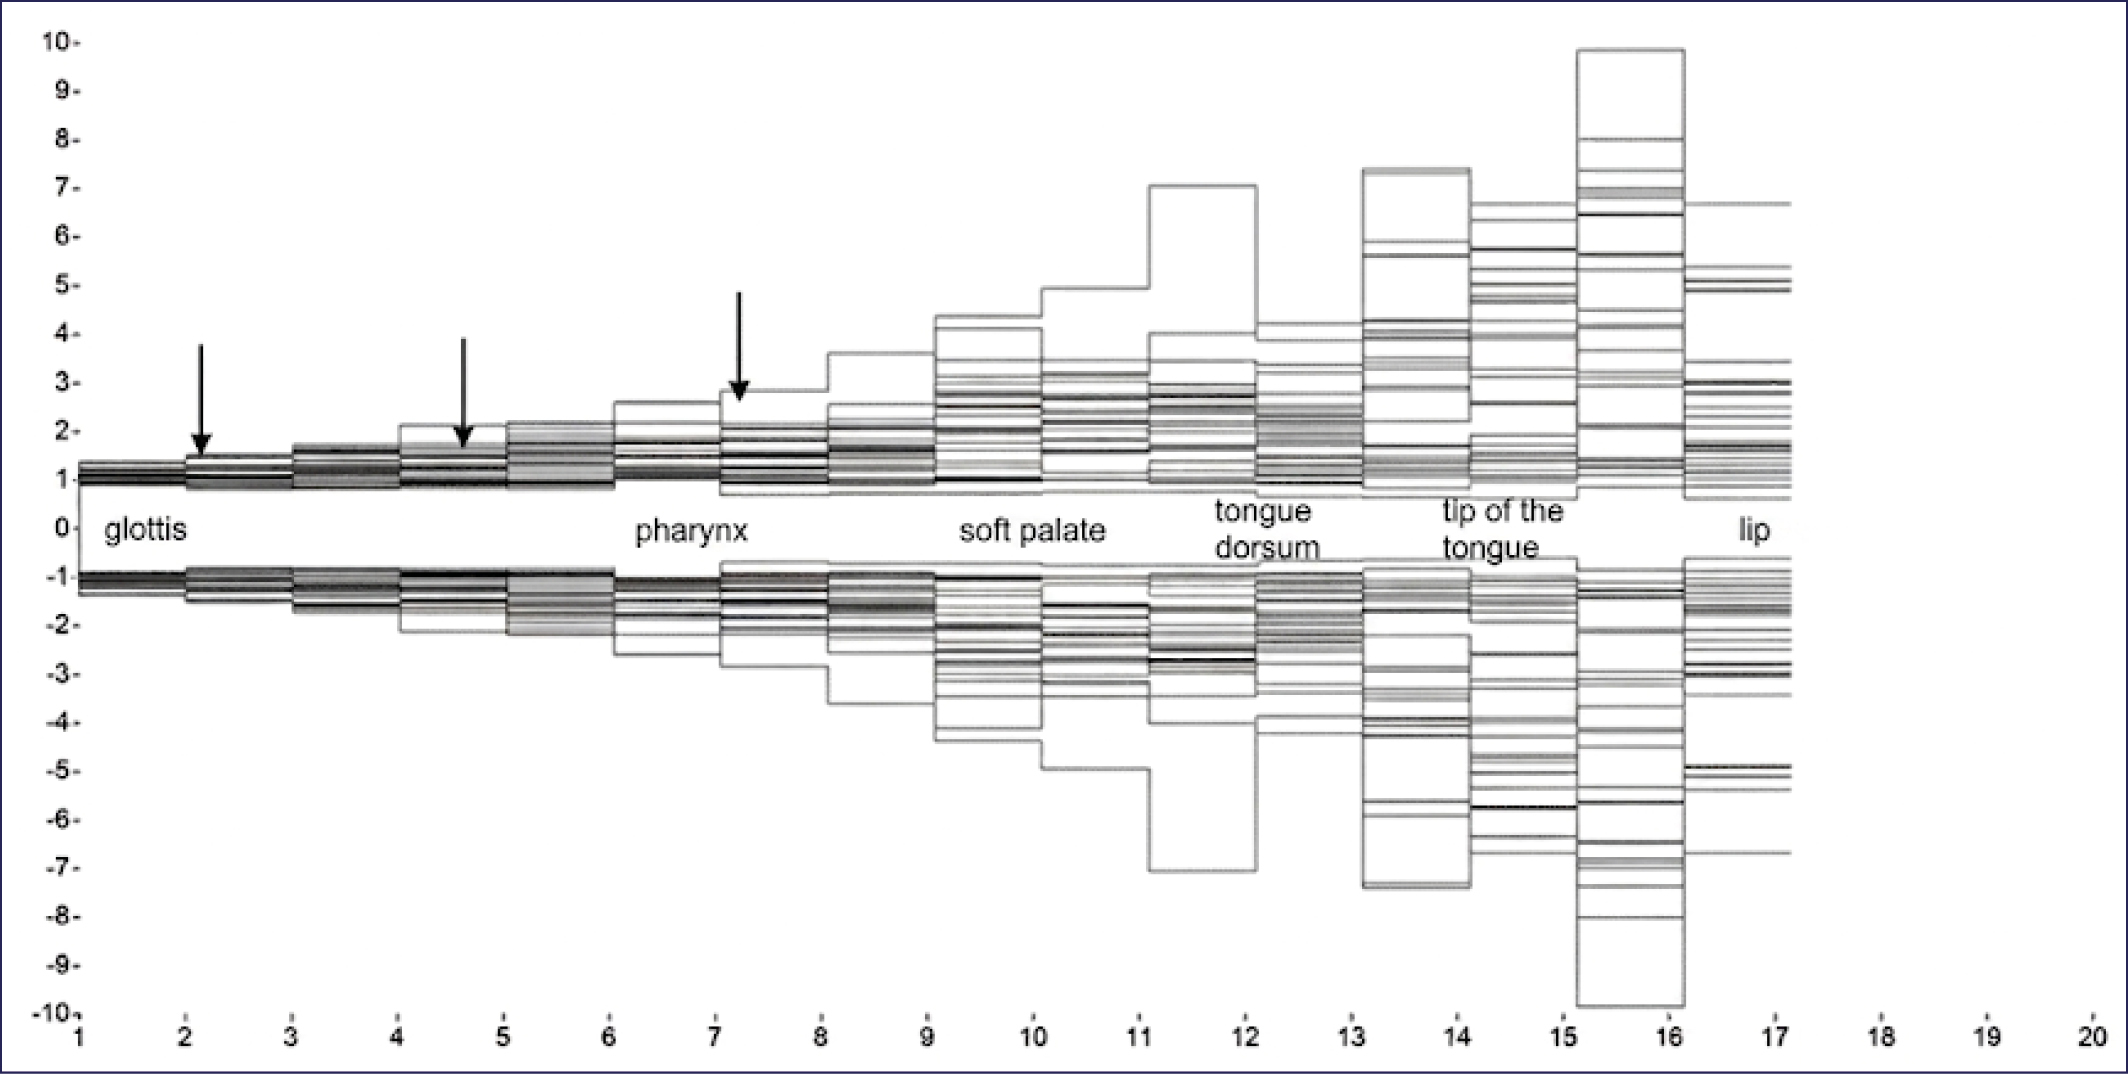
After that, the vocal tract diagrams were manually extracted, comparing the findings from the spoken and sung vowels in the researched tone. The diagrams in the sustained spoken and sung vowels were overlapped by task, on a signaled screen; on the x-axis, with the average vocal tract measurement predefined at 17 cm, the length was changed to 20 cm; on the y-axis, the possibility of observing the height and reference point for dilation or constriction of the tube was established between 10 cm and -10 cm. The scale was defined to assist in visualization in the “Picture” window from the “Margins” menu, “Axes” command, defined as “left 1.0” and “right 20.0” for the x-axis of length; a "bottom" of -10 and a "top" of 10 were established for visualization of y, height, and reference point.
Having selected the file, resampling was performed in the "Convert" menu in the object window to formulate the VTD; in the "Analyze spectrum" command, the option "To LPC (autocorrelation)" should be chosen, keeping the established values; after formulation, in the "Extract" section, the command "To Vocal Tract (slice)" should be selected, and a new file is created with the name "Vocal Tract". To perform the illustration in the "Draw" section, the command "Draw segments" should be selected. The VTD will then appear in the drawing window.
The set of illustrations and commands established in the previous steps was considered for overlapping the VTDs. In the object window, the dataset was saved as “Praat Collection” in the “Save” menu, using the “save as a text file” option for each research participant to facilitate opening and selecting the files named “Vocal Tract” and plotting them graphically in the Praat drawing window, using the same commands indicated in the “Draw” section, “Draw segments”. The overlaps were organized by task (spoken and sung vowel emission) to facilitate the visualization of possible convergences in the VTD and the participants' tube variability.
The data analysis considered the description of the values found for f0, F1, F2, F3, F4, and F5; the overlap of the peak formant curves LPC (black) and FFT (gray) in the spoken and sung vowel emission; and the overlaps of the VTDs of all participants, following the same protocol.
RESULTS
Regarding the measures of central tendency of the f0 and formant measurements (Table 1), F1 values were higher than f0 values in the average of the low-pitched voices. The analysis of the sustained vowel /a/ revealed an average f0 of 218 Hz, within the expected range for healthy female voices. The formants presented average values consistent with the production of the vowel /a/. F1 (871 Hz) indicated the expected mouth opening, F2 (1525 Hz) reflected the tongue positioning for the vowel characteristics, and the values of F3 to F5 (3193 Hz, 4212 Hz, 4337 Hz) did not show significant deviations.
The disturbance measurements demonstrated stability, with average jitter (0.00169%) and shimmer (0.0213 dB) within the limits established by Praat (< 1% and < 0.35 dB, respectively), in addition to the average HNR (25.0 dB), which confirmed a balanced harmonic-to-noise relationship (program reference value >20 dB).
In the sung vowel emission in a low tone (middle C, 261 Hz), the average f0 was 259 Hz, a value close to the target, with minimal variation, a standard deviation of 3.73 Hz, and a restricted amplitude (245 to 266 Hz) (Table 2). The formants were consistent with the production characteristics of the vowel /a/, F1 (863 Hz) approached the value observed in the sustained vowel (871 Hz), while F2 (1633 Hz) showed a slight elevation compared to habitual speech (1525 Hz), possibly reflecting a resonance adjustment to optimize projection in the low register. The upper formants (F3 to F5) remained stable, with a variation of less than 50 Hz in relation to habitual speech.
Comparing the data from Tables 1 and 2, the greater stability of f0 in the sung emission and the lower variability of the standard deviation of f0 stand out, as well as the elevation of F2 (frequency of the second formant) as a resonance strategy in the emission of the low tone.
In the overlapping of the LPC curve onto the FFT spectral diagram, in the spoken emission, a distribution of harmonics and a spectral drop in the formant curve were observed. In the emission of the sung vowel in a low tone, the approximation of the first two formants, F1 and F2, was observed, with an increase from F2 and in the region of F3, F4, and F5. Although it resembles the phenomenon of the singer's formant, the joining of formants does not occur, but rather the approximation and agglomeration of harmonics for projection in this tone, as exemplified in the overlapping shown in Figures 1 and 2.

The overlap of VTDs onto habitual speech emissions allowed the observation, through the saturation of darker colors, a recurring convergence of the participants' emissions in the glottis region, an area that, by algorithmic pre-definition, is more clearly demarcated. Consequently, the pharyngeal and dorsal regions of the tongue also stood out. However, in the overall analysis of the y-axis, greater amplitude variation was observed at the tip of the tongue and lips, related to mouth opening and the perceptible variability in vocal tract behavior among the speakers.

The overlap of the VTDs of the sung vowel emissions in the low register allowed one to observe, through the darker markings, a recurring convergence between the participants in the glottal region. Furthermore, it is possible to observe, on the y-axis, greater amplitude and dilation from the velum region, the back of the tongue, the tip of the tongue, and variability in lip opening.

DISCUSSION
This study aimed to investigate the differences between producing the vowel /a/ in habitual speech and singing in a low tone by soprano singers. The complexity of soprano singing justifies investigations that aim to contribute to the literature and offer new perspectives on vocal acoustic characteristics for speech-language-hearing assessment and monitoring, as well as for voice teaching.
The technical skill of singers is recognized by the way they execute safely the vocal aesthetics chosen for the vocal performance.
Lyrical singing stands out for specific high-performance adjustments and, among its main challenges, is the need to overcome the orchestra without amplification. The production of vowels constitutes an essential basis in the technical-pedagogical teaching of the singing voice. Understanding the different adjustments and tonal variations, as well as the vocal differentiations and acoustic recurrences during soprano singing, is fundamental for vocal training13,30,31.
The analysis of the FFT and LPC overlap revealed harmonic distribution and spectral decline in the formant curve typical for the oral vowel studied, in addition to the expected variability of emissions among speakers of Brazilian Portuguese18,32. This variability observed in the sustained /a/ vowel in habitual speech was also reflected in the VTD overlap, with convergence towards the glottal region, the pharynx, and the back of the tongue, and variations in the opening and narrowing of the lips in the anteroposterior axis. This convergence is consistent with the acoustic-articulatory descriptions in the literature18,32.
In the emission of the sung /a/ vowel in a low tone, the values of all formants were slightly higher than in the sustained vowel in habitual speech, especially F2, an acoustic-articulatory correlate related to the possible elevation of the back of the tongue and elevation towards the f0 target tone. These findings agree with those found in the literature for this tone30,33,34. Additionally, the grouping of formants accompanied by variations in the distribution of harmonics was observed in the association between FFT and LPC. Although it is possible to observe some similarity with the effect of the “singer formant” described in tenors15, the phenomenon observed in sopranos is distinct and characterized by the approximation of harmonic partials and the absence of the “singer formant”, as pointed out in other studies29,30. This suggests another possibility for projection and emission variability, which may be associated with technical strategies in an attempt to keep the larynx low and expand the vocal tract. Singers often use such strategies to prevent the f0 or the first harmonic (H1) from being higher than the first formant to ensure vocal projection in this region35.
In the VTD in the low register, it was possible to observe the expansion of the pharyngeal region of the laryngeal tube, relating to the acoustic interpretation through LPC and FFT in the grouping of the upper formants (F3, F4, and F5). Furthermore, it was possible to identify expansion in the regions of the soft palate and the back of the tongue, associated with control of tongue height (F3), as well as variations in lip opening (F1). These observations are consistent with the findings of other authors who used imaging studies16,30. The acoustic findings of this study corroborate the alternation of the f0 adjustment of the habitual speech region for the emission of the sung vowel in a low tone with the approximation of F1 and F236. In addition to expanding the analysis of the behavior of other formants, the association of FFT, LPC, and VTD established a distinction between the tasks of sustained spoken and sung vowels in a low tone, with a good possibility of providing tools for speech-language-hearing pathologists who work with singing voice, who would benefit from instruments that allow more specific analyses, complementary to those that already exist.
The continuation of this study foresees the investigation of other tones in soprano singing and the analysis of the behavior of the VTD in other singing styles to validate it as a feasible instrument in speech-language-hearing practice in voice and singing teaching.
CONCLUSION
FFT, LPC, and VTD analyses indicated distinctions between the sustained vowel tasks in spoken and sung low notes, performed by soprano singers, with acoustic correlates between the instruments. The increase in the second formant in the low pitch compared to the spoken voice task, possibly caused by vocal tract modifications, was confirmed by VTD.
The VTD overlap, associated with FFT and LPC analyses, proved to be a useful and accessible tool for speech-language-hearing clinics and should be investigated in different samples of singers.
REFERENCES
-
1 Dejonckere PH, Bradley P, Clemente P, Cornut G, Crevier-Buchman L, Friedrich G et al. A basic protocol for functional assessment of voice pathology, especially for investigating the efficacy of (phonosurgical) treatments and evaluating new assessment techniques. Guideline elaborated by the Committee on Phoniatrics of the European Laryngological Society (ELS). Eur Arch Otorhinolaryngol. 2001;258(2):77-82. https://doi.org/10.1007/s004050000299 PMID: 11307610.
» https://doi.org/10.1007/s004050000299 -
2 Roy N, Barkmeier-Kraemer J, Eadie T, Sivasankar MP, Mehta D, Paul D et al. Evidence-based clinical voice assessment: A systematic review. Am J Speech Lang Pathol. 2013;22(2):212-26. https://doi.org/10.1044/1058-0360(2012/12-0014) PMID: 23184134.
» https://doi.org/10.1044/1058-0360(2012/12-0014) -
3 Nemr K, Amar A, Abrahão M, Leite GCA, Köhle J, Santos AO et al. Comparative analysis of perceptual evaluation, acoustic analysis and indirect laryngoscopy for vocal assessment of a population with vocal complaint. Rev Bras Otorrinolaringol. 2005;71(1):13-7. https://doi.org/10.1590/S0034-72992005000100003 PMID: 16446885.
» https://doi.org/10.1590/S0034-72992005000100003 -
4 Nemr K, Simões-Zenari M, Duarte JMT, Lobrigate KE, Bagatini FA. Dysphonia Risk Screening Protocol. Clinics. 2016;71(3):114-27. https://doi.org/10.6061/clinics/2016(03)01 PMID: 27074171.
» https://doi.org/10.6061/clinics/2016(03)01 -
5 Leite APD, Carnevale LB, Rocha HL, Pereira CA, Filho LL. Relation between voice self-assesment and clinic evaluation data in dysphonic individuals. Rev. CEFAC. 2015;17(1):44-51. https://doi.org/10.1590/1982-021620151214
» https://doi.org/10.1590/1982-021620151214 -
6 Corazza VR, Silva VFC, Queija DS, Dedivitis RA, Barros APB. Correlation among stroboscopic, perceptual and acoustic analysis findings in adult subjects without vocal complaint. Rev Bras Otorrinolaringol. 2004;70(1):30-4. https://doi.org/10.1590/S0034-72992004000100005
» https://doi.org/10.1590/S0034-72992004000100005 -
7 Valentim AF, Côrtes MG, Gama ACC. Spectrographic analysis of the voice: Effect of visual training on the reliability of evaluation. Rev soc bras fonoaudiol. 2010;15(3):335-42. https://doi.org/10.1590/S1516-80342010000300005
» https://doi.org/10.1590/S1516-80342010000300005 -
8 Kempster GB, Gerratt BR, Abbott KV, Barkmeier-Kraemer J, Hillman RE. Consensus auditory-perceptual evaluation of voice: Development of a standardized clinical protocol. Am J Speech Lang Pathol. 2009;18(2):124-32. https://doi.org/10.1044/1058-0360(2008/08-0017) PMID: 18930908.
» https://doi.org/10.1044/1058-0360(2008/08-0017) -
9 Faham M, Laukkanen AM, Ikävalko T, Rantala L, Geneid A, Holmqvist-Jämsén S et al. Acoustic voice quality index as a potential tool for voice screening. J Voice. 2021;35(2):226-32. https://doi.org/10.1016/j.jvoice.2019.08.017 PMID: 31582330.
» https://doi.org/10.1016/j.jvoice.2019.08.017 -
10 Brown WS, Morris RJ, Hollien H, Howell E. Speaking fundamental-frequency characteristics as a function of age and professional singing. J Voice. 1991;5(4):310-5. https://doi.org/10.1016/S0892-1997(05)80061-X
» https://doi.org/10.1016/S0892-1997(05)80061-X -
11 Titze IR. Toward standards in acoustic analysis of voice. J Voice. 1994;8(1):1-7. https://doi.org/10.1016/S0892-1997(05)80313-3 PMID: 8167782.
» https://doi.org/10.1016/S0892-1997(05)80313-3 -
12 Bloothooft G, Plomp R. Spectral analysis of sung vowels. I. Variation due to differences between vowels, singers, and modes of singing. J Acoust Soc Am. 1984;75(4):1259-64. https://doi.org/10.1121/1.390732 PMID: 6725777.
» https://doi.org/10.1121/1.390732 -
13 Liu W, Wang Y, Liang C. Formant and voice source characteristics of vowels in Chinese national singing and bel canto. A pilot study. J Voice. 2023;40(2):331-9. https://doi.org/10.1016/j.jvoice.2023.10.016 PMID: 37940420.
» https://doi.org/10.1016/j.jvoice.2023.10.016 -
14 Maryn Y, Corthals P, Van Cauwenberge P, Roy N, De Bodt M. Toward improved ecological validity in the acoustic measurement of overall voice quality: Combining continuous speech and sustained vowels. J Voice. 2010;24(5):540-55. https://doi.org/10.1016/j.jvoice.2008.12.014 PMID: 19883993.
» https://doi.org/10.1016/j.jvoice.2008.12.014 -
15 Sundberg J. The acoustics of the singing voice. Sci Am. 1977;236(3):82-4,86,88-91. https://doi.org/10.1038/scientificamerican0377-82 PMID: 841298.
» https://doi.org/10.1038/scientificamerican0377-82 -
16 Echternach M, Sundberg J, Arndt S, Markl M, Schumacher M, Richter B. Vocal tract in female registers - A dynamic real-time MRI study. J Voice. 2010;24(2):133-9. https://doi.org/10.1016/j.jvoice.2008.06.004 PMID: 19185452.
» https://doi.org/10.1016/j.jvoice.2008.06.004 -
17 Roberts JE, Burchinal M, Footo MM. Phonological process decline from 2 1/2 to 8 years. Journal of Communication Disorders. 1990;23(3):205-17. https://doi.org/10.1016/0021-9924(90)90023-r PMID: 2382103.
» https://doi.org/10.1016/0021-9924(90)90023-r - 18 Barbosa PA, Madureira S. Manual de fonética acústica experimental: aplicações a dados do português. São Paulo, SP: Cortez editora. 2015.
-
19 Flanagan JL. Some properties of the glottal sound source. J Speech Hear Res. 1958;1(2):99-116. https://doi.org/10.1044/jshr.0102.99 PMID: 13576503.
» https://doi.org/10.1044/jshr.0102.99 -
20 Fant G. Acoustic theory of speech production: With calculations based on X-ray studies of Russian articulations. Berlin, Boston: De Gruyter Mounton.1971. https://doi.org/10.1515/9783110873429
» https://doi.org/10.1515/9783110873429 -
21 Roubeau B, Henrich N, Castellengo M. Laryngeal vibratory mechanisms: The notion of vocal register revisited. J Voice. 2009;23(4):425-38. https://doi.org/10.1016/j.jvoice.2007.10.014 PMID: 18538982.
» https://doi.org/10.1016/j.jvoice.2007.10.014 -
22 de Souza GVS, Duarte JMT, Viegas F, Simoes-Zenari M, Nemr K. An acoustic examination of pitch variation in soprano singing. J Voice. 2020;34(4):9. https://doi.org/10.1016/j.jvoice.2018.12.007 PMID: 30717888.
» https://doi.org/10.1016/j.jvoice.2018.12.007 -
23 Titze IR, Maxfield LM, Walker MC. A formant range profile for singers. J Voice. 2017;31(3):382.e9-.e13. https://doi.org/10.1016/j.jvoice.2016.08.014 PMID: 28029556.
» https://doi.org/10.1016/j.jvoice.2016.08.014 -
24 Brown WS, Morris RJ, Hicks DM, Howell E. Phonational profiles of female professional singers and nonsingers. J Voice. 1993;7(3):219-26. https://doi.org/10.1016/s0892-1997(05)80330-3 PMID: 8353639.
» https://doi.org/10.1016/s0892-1997(05)80330-3 -
25 Barnes JJ, Davis P, Oates J, Chapman J. The relationship between professional operatic soprano voice and high range spectral energy. J Acoust Soc Am. 2004;116:530-8. https://doi.org/10.1121/1.1710505 PMID: 15296012.
» https://doi.org/10.1121/1.1710505 - 26 Boersma P, Van Heuven V. Speak and unSpeak with PRAAT. Glot International. 2001;5(9/10):341-7.
-
27 Dromey C, Heaton E, Hopkin JA. The acoustic effects of vowel equalization training in singers. J Voice. 2011;25(6):678-82. https://doi.org/10.1016/j.jvoice.2010.09.003 PMID: 21216128.
» https://doi.org/10.1016/j.jvoice.2010.09.003 -
28 Ferguson S, Kenny DT, Mitchell HF, Ryan M, Cabrera D. Change in messa di voce characteristics during 3 years of classical singing training at the tertiary level. J Voice. 2013;27(4):523.e35-48. https://doi.org/10.1016/j.jvoice.2013.01.013 PMID: 23543135.
» https://doi.org/10.1016/j.jvoice.2013.01.013 -
29 Weiss R, Brown WS Jr., Morris J. Singer's formant in sopranos: Fact or fiction? J Voice. 2001;15(4):457-68. https://doi.org/10.1016/s0892-1997(01)00046-7 PMID: 11792022.
» https://doi.org/10.1016/s0892-1997(01)00046-7 -
30 Sundberg J. Articulatory configuration and pitch in a classically trained soprano singer. J Voice. 2009;23(5):546-51. https://doi.org/10.1016/j.jvoice.2008.02.003 PMID: 18504111.
» https://doi.org/10.1016/j.jvoice.2008.02.003 - 31 Sundberg J. Ciência da voz: fatos sobre a voz na fala e no canto. São Paulo, SP: EDUSP. 2015.
-
32 Escudero P, Boersma P, Rauber AS, Bion RAH. A cross-dialect acoustic description of vowels: Brazilian and European Portuguese. J Acoust Soc Am. 2009;126(3):1379-93. https://doi.org/10.1121/1.3180321 PMID: 19739752.
» https://doi.org/10.1121/1.3180321 -
33 Joliveau E, Smith J, Wolfe J. Vocal tract resonances in singing: The soprano voice. J Acoust Soc Am. 2004;116(4):2434-9. https://doi.org/10.1121/1.1791717 PMID: 15532674.
» https://doi.org/10.1121/1.1791717 -
34 Sundberg J. Articulatory configuration and pitch in a classically trained soprano singer. J Voice. 2009;23(5):546-51. https://doi.org/10.1016/j.jvoice.2008.02.003 PMID: 18504111.
» https://doi.org/10.1016/j.jvoice.2008.02.003 -
35 Echternach M, Burk F, Koberlein M, Selamtzis A, Dollinger M, Burdumy M et al. Laryngeal evidence for the first and second passaggio in professionally trained sopranos. Plos One. 2017;12(5):18. https://doi.org/10.1371/journal.pone.0175865 PMID: 28467509.
» https://doi.org/10.1371/journal.pone.0175865 -
36 Henrich N, Smith J, Wolfe J. Vocal tract resonances in singing: Strategies used by sopranos, altos, tenors, and baritones. J Acoust Soc Am. 2011;129(2):1024-35. https://doi.org/10.1121/1.3518766 PMID: 21361458.
» https://doi.org/10.1121/1.3518766
-
A research carried out at the Medical School of the Universidade de São Paulo, São Paulo, SP, Brazil.
-
Financial support
Nothing to declare
-
Data sharing statement
The data are not available.
-
Declaration of use of artificial intelligence tools
The authors did not use artificial intelligence tools in the preparation of this study.
The data are not available.

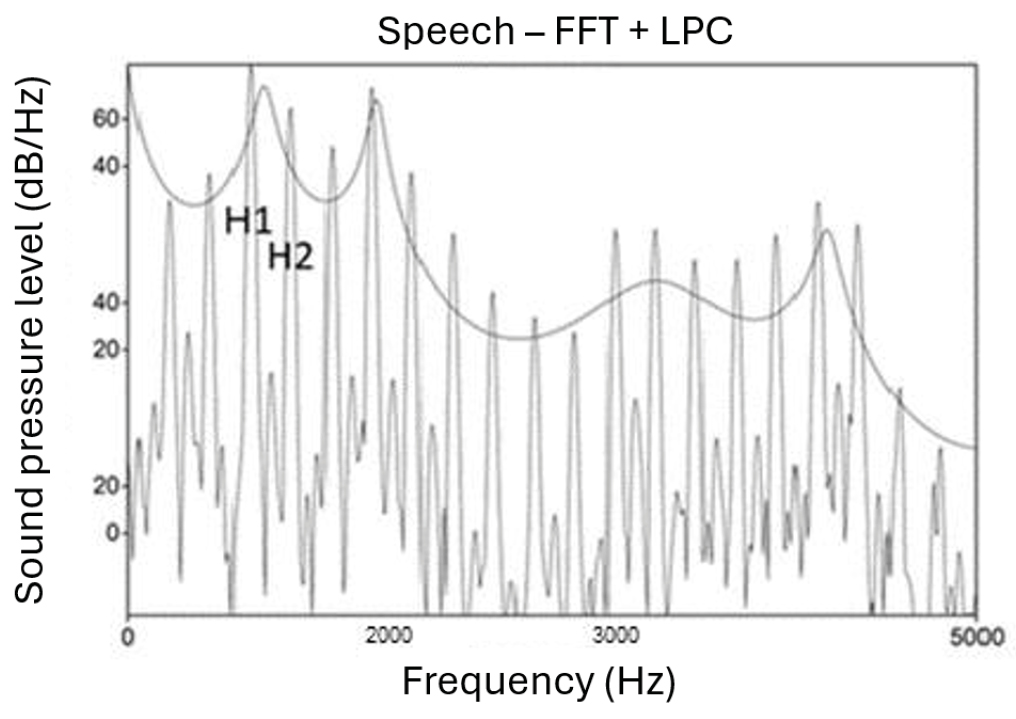 Captions: FFT = Fast Fourier Transform; LPC = Linear Predictive Coding
 Captions: FFT = Fast Fourier Transform; LPC = Linear Predictive Coding