 The bouncing mechanics of an olympic runner: a case report
ABSTRACT
This study examines the running mechanics of an elite marathon runner (ER) compared to swimmers (SWI) and soccer players (SOC) at speeds of 3.9, 4.4, and 5.0 m·s−1. ER consistently showed 22–25% higher vertical stiffness (kvert) than SWI and 4–6% higher than SOC, linked to greater peak forces and reduced vertical displacement. ER’s lower tce/tae and tbrake/tpush ratios suggest efficient transitions and enhanced energy conservation. Unlike SWI and SOC, who showed less stiffness and longer braking times, ER’s running pattern reveals adaptations for energy efficiency and endurance, particularly in rebound mechanics. These traits underscore unique biomechanical strategies that differentiate endurance athletes from those with other sports backgrounds.
Keywords:
Vertical stiffness; Sports background; Marathon runner; Running biomechanics
RESUMO
Este estudo examina a mecânica de corrida de um maratonista de elite (ER) comparado a nadadores (SWI) e jogadores de futebol (SOC) em velocidades de 3.9, 4.4 e 5.0 m·s−1. O ER mostrou 22–25% mais rigidez vertical (kvert) que o SWI e 4–6% a mais que o SOC, devido a forças máximas maiores e menor deslocamento vertical. As menores razões tce/tae e tbrake/tpush sugerem transições eficientes e melhor conservação de energia. Ao contrário do SWI e SOC, com menor rigidez e maior tempo de frenagem, o padrão de corrida do ER revela adaptações para eficiência energética e resistência, especialmente na mecânica de rebote. Essas características destacam estratégias biomecânicas exclusivas, diferenciando atletas de resistência de outros esportes.
Palavras-chave:
Rigidez vertical; Histórico esportivo; Corredor de maratona; Biomecânica da corrida
RESUMEN
Este estudio examina la mecánica de carrera de un maratonista de élite (ER) en comparación con nadadores (SWI) y futbolistas (SOC) a velocidades de 3.9, 4.4 y 5.0 m·s−1. ER mostró un 22–25% más de rigidez vertical (kvert) que SWI y un 4–6% más que SOC, asociado a mayores fuerzas máximas y menor desplazamiento vertical. Las menores razones tce/tae y tbrake/tpush sugieren transiciones eficientes y mejor conservación de energía. A diferencia de SWI y SOC, con menor rigidez y tiempos de frenado prolongados, el patrón de ER revela adaptaciones para eficiencia y resistencia, especialmente en mecánica de rebote. Estos rasgos destacan estrategias biomecánicas únicas, diferenciando a los atletas de resistencia de otros deportes.
Palabras clave:
Rigidez vertical; Antecedentes deportivos; Corredor de maratón; Biomecánica de la carrera
INTRODUCTION
When running on flat ground at a consistent speed, the body’s center of mass (COM) follows a rhythmic, bouncing motion, representing a spring-mass system (Cavagna et al., 1977). Throughout each step, the muscle-tendon units (MTUs) in the supporting limb engage in a stretch-shortening cycle, absorbing energy during the braking phase (negative work) and releasing it during propulsion (positive work) to propel the body forward (Cavagna et al., 1987). Under this steady condition, the upward and downward movements of the COM remain balanced, resulting in equal positive and negative work in each step to sustain this oscillation.
The bouncing mechanism can be investigated using spatiotemporal parameters. Indeed, the spring-mass model can be divided into distinct temporal phases, reflecting both positive and negative work of the body’s center of mass (COM) (Cavagna, 2006). The variable tₚᵤₛₕ represents the period of positive mechanical work during propulsion, whereas tbᵣaₖe denotes the period of negative mechanical work during braking (see Figure 1 for illustration). A discrepancy between tbᵣaₖe and tₚᵤₛₕ reflects deviation from an elastic model; lower tbᵣaₖe with higher tₚᵤₛₕ suggests a propulsion-biased (more elastic-like) rebound, and the opposite indicates a braking-biased (more dissipative) pattern (Cavagna, 2010). Also, the vertical oscillation of the COM throughout the step can also be divided: effective contact time (tce), when the vertical force (Fv) exceeds body weight, corresponds to the lower oscillation phase; and effective aerial time (tae), when the vertical force is less than body weight, represents the upper oscillation phase (see Figure 1 for illustration). In an ideal elastic bounce, tpush equals tbrake (symmetric landing-takeoff), while tae is greater than tce to balance vertical momentum (asymmetric rebound) (Cavagna, 2006).

Typical force–time traces of the marathon runner (ER), a soccer player (SOC), and a swimmer (SWI) while running at 5.0 m·s−1.The horizontal dotted line corresponds to body weight (BW) and divides the step into two parts: the effective contact time (tce) when Fv > BW and the effective aerial time (tae) when Fv < BW. Contact time is divided into two parts: the period during which the COM is decelerated (tbrake) and the period during which it is accelerated (tpush). Black dots indicate the first peak (Fpeak1) and the active/second peak (Fmax).
Such spatiotemporal parameters have been used to investigate running in different conditions. The two asymmetries of the rebound are modulated by the running speed (Cavagna, 2010), external factors (Dewolf et al., 2016, 2019; Mesquita et al., 2020), or by athletic background (Burns et al., 2021; Mesquita et al., 2020; Núñez Lisboa et al., 2021). The athletic background further shapes how this bouncing mechanism operates. In fact, a study highlighted the role of specific training demands in influencing vertical stiffness and rebound mechanics, noting that football players exhibit a more elastic bounce than swimmers due to the unique requirements of their sports (Núñez Lisboa et al., 2021). Even within the same athletic discipline, differences exist; The scientific literature report (Burns et al., 2021; Da Rosa et al., 2019) that athletes with similar sports discipline and performance levels could display variability in vertical stiffness and spatiotemporal parameters related to their running performance, suggesting that adaptations to training vary significantly based on individual mechanics.
Marathon runners exhibit unique adaptations, including minimized ground contact times, optimized cadence, and efficient use of the stretch-shortening cycle, which collectively contribute to running economy—a critical factor for sustaining pace over long distances (Blagrove and Hayes, 2021). In fact, Williams, (2007) suggests that elite endurance runners adapt their mechanics to limit vertical motion, which conserves energy and reduces muscle strain, helping them sustain performance over long distances (Williams, 2007). These individualized movement patterns minimize unnecessary oscillation, lower energy costs, and conserve metabolic resources, which are essential traits for marathon running.
Building on these insights, this case report aims to compare the specific bouncing mechanics of an Olympic marathon runner with athletes from other sports backgrounds, including swimmers and football players, to highlight how training influences energy use and movement dynamics. By analyzing metrics such as effective contact time (tce), aerial time (tae), push-off and braking durations (tpush, tbrake), peaks of vertical forces and vertical stiffness (kvert), this study seeks to reveal how these adaptations reflect each athlete’s specialized demands and contribute to variations in energy efficiency across disciplines.
METHODS
Participants
This study included six professional male soccer players (SOC) and six junior elite male swimmers (SWI), previously analyzed in Núñez-Lisboa et al. (2021). In that study, the inclusion of junior athletes was justified by evidence that the bouncing mechanism reaches adult patterns in adolescence (Legramandi et al., 2013; Schepens et al., 1998). In addition, we included a Chilean marathon runner (ER) who participated in the 2024 Paris Olympics, finishing 53rd in 2:14:25 (Table 1), with a marathon personal best of 2:08:04 over 42 km. Also, with ~17 years of competitive training and a weekly running distance of 199.75 km at the time of evaluation. The athlete completed two weekly strength and plyometric sessions in addition to running; no other cross-training was performed. This case report utilizes data from ER who participated in the project titled 'Effects of Exercise-Induced Muscle Damage on the Rebound System and Electrical Muscle Activity of the Lower Limb During Running.' This project was approved by the Scientific Ethics Committee of Universidad Finis Terrae, with Protocol ID 23-047.
Means and standard deviations of age, body mass, height, and body mass index (BMI) for swimmers (SWI), soccer players (SOC), and elite marathon runners (ER). Note: Data for SWI and SOC were obtained from Núñez-Lisboa et al. (2021). Data for ER is from the current case report.
Study design
All athletes performed a 10-minute warm-up, including running on a treadmill at approximately 2.8 m·s−1. Following the warm-up, participants ran on an instrumented treadmill (Treadmill: Hp/Cosmos, Germany; Force platform: Arsalis, Belgium) at three speeds: 3.9, 4.4, and 5.0 m·s−1 (corresponding to 14, 16, and 18 km·h−1). The speeds (3.9, 4.4, and 5.0 m·s−1) were tested in ascending order. Each speed was maintained for 1 minute, with a 2-minute rest between each to minimize fatigue. For ER, 13, 15, and 16 steps were analyzed at 3.9, 4.4, and 5.0 m·s−1, respectively. The remaining step data are published (Núñez Lisboa et al., 2021). These speeds were selected as they exceed typical endurance running paces, reducing the variability of spatiotemporal parameters between subjects as speed increases (Lussiana et al., 2019). Vertical (Fv), lateral, and horizontal ground reaction forces were recorded at 1000 Hz during the final 10 seconds of each running bout. From these data, we calculated the acceleration (a), velocity, and displacement of the COM, as well as the energy required to move the COM relative to the ground (Ecom) (Dewolf et al., 2019; Willems and Gosseye, 2013). Briefly, fore-aft and vertical accelerations of the COM were calculated as af = Ff/m and av = (Fv - BW)/m, where m is the subject's mass, and BW is body weight. Instantaneous velocities in the fore-aft (vf) and vertical (vv) directions were derived by integrating af and av, adding constants to ensure the treadmill belt velocity matched the stride’s average vf and the average vv remained zero. Vertical displacement of the COM (Sv) was determined by integrating vv a second time. Using these metrics, we computed the kinetic (Ek), potential (Ep), and Ecom based on its movement relative to the ground.
Where m is the mass of the subject and g is gravity.
Measurements of the bouncing mechanism of running
Spatiotemporal organization of steps
Steps were divided based on the Fv–time curves at each speed (threshold = 30N). Contact time (tc) was calculated from foot contact (FC) to toe-off (TO), and aerial time (ta) was calculated as the step period minus tc. Effective aerial time (tae) was defined as the period during which the vertical force (Fv) was less than body weight (Fv < BW) (Cavagna et al., 1987), and effective contact time (tce) as the period when Fv was equal to or greater than body weight (Fv ≥ BW) (see Figure 1 for illustration). The step period (T) was then calculated as T = tce + tae. The phases tpush and tbrake were determined as the intervals when COM mechanical energy increased (positive) and decreased (negative), respectively.
Vertical stiffness
For each step, the second peak (F max) of Fv, also known as the “active” peak (11), was recorded (see Figure 1 for illustration). The vertical displacement range of the COM (Sv) during tce (Δy) was also measured. Finally, vertical stiffness (kvert) was calculated as the best linear relationship between Fv and Sv over tce (Dewolf et al., 2016). Also, the first peak (F peak 1) of Fv was recorded. Additionally, the load rate (LR) was calculated as the ratio between the first peak of the ground reaction force (Fₚeaₖ1) and the time at which this peak occurs (tₚeaₖ1):
Statistical analysis
Since this study involved a single elite marathon runner (ER) compared with groups of swimmers (SWI) and soccer players (SOC), statistical comparisons were adjusted. Instead of traditional inferential statistics, we report the percentage differences for each dependent variable across the different running speeds. All analyses were conducted using GraphPad Prism 6 (GraphPad Software, California, USA), with outcomes described in terms of percentage change per speed to highlight variations between the elite runner (ER) and the SWI and SOC groups. Additionally, z-scores were calculated to assess the relative position of the ER's performance within the groups. The z-score formula used was:
where X represents the value of the ER, µ is the mean of the group (SWI or SOC), and σ is the standard deviation of the group. We considered a significant difference when the z-score was greater than 2 or smaller than –2, consistent with conventional thresholds for the standard normal distribution (±1.96 ≈ ±2 for α = 0.05, two-tailed (Altman, 1991).”
RESULTS
Temporal parameters of the running step across different speeds
At all speeds, the contact time (tc) was consistently shorter for the elite marathon runner (ER) compared to both swimmers (SWI) and soccer players (SOC) (Table 2). At 3.88 m·s−1, tc for ER was 9.6% shorter than SWI (z: -2.1271) and 1.0% shorter than SOC (z: -0.0914). At 4.44 m·s−1, tc was 10.2% shorter than SWI (z: -2.5047) and 2.2% shorter than SOC (z: -0.2846). At 5.00 m·s−1, tc for ER was 12.6% shorter than SWI (z: -2.8764) and 2.4% shorter than SOC (z: -0.4087). Regarding aerial time (ta), ER showed higher values than SWI and SOC at each speed. At 3.88 m·s−1, ta for ER was 5.6% higher than SWI (z: 0.5281) and 11.8% higher than SOC (z: 0.8263). At 4.44 m·s−1, ta was 11.8% greater than SWI (z: 0.7818) and 18.8% greater than SOC (z: 1.8955). At 5.00 m·s−1, ta in ER exceeded that of SWI by 23.1% (z: 2.4316) and SOC by 20.7% (z: 2.8723). ER also displayed differences in the overall step period between the two groups. At 3.88 m·s−1, the step period for ER was 3.3% shorter than SWI (z: -0.0136) and 4.2% longer than SOC (z: 1.5502). At 4.44 m·s−1, it was 0.3% shorter than SWI (z: -0.0710) and 7.1% longer than SOC (z-score: 2.1679). Finally, at 5.00 m·s−1, the step period for ER was 3.3% longer than SWI (z: 0.5452) and 8.6% longer than SOC (z: 2.7571).
Temporal Parameters (tc, ta, Step Period, tbrake and tpush) Across Different Speeds for Swimmers (SWI), Soccer Players (SOC), and Elite Marathon Runner (ER), with Percentage Differences Between Groups. Note: Data for SWI and SOC were obtained from Núñez-Lisboa et al. (2021). Data for ER is from the current case report.
Ratios of push-off to braking time (TBRAKE/TPUSH) and effective contact to aerial time (TCE/TAE)
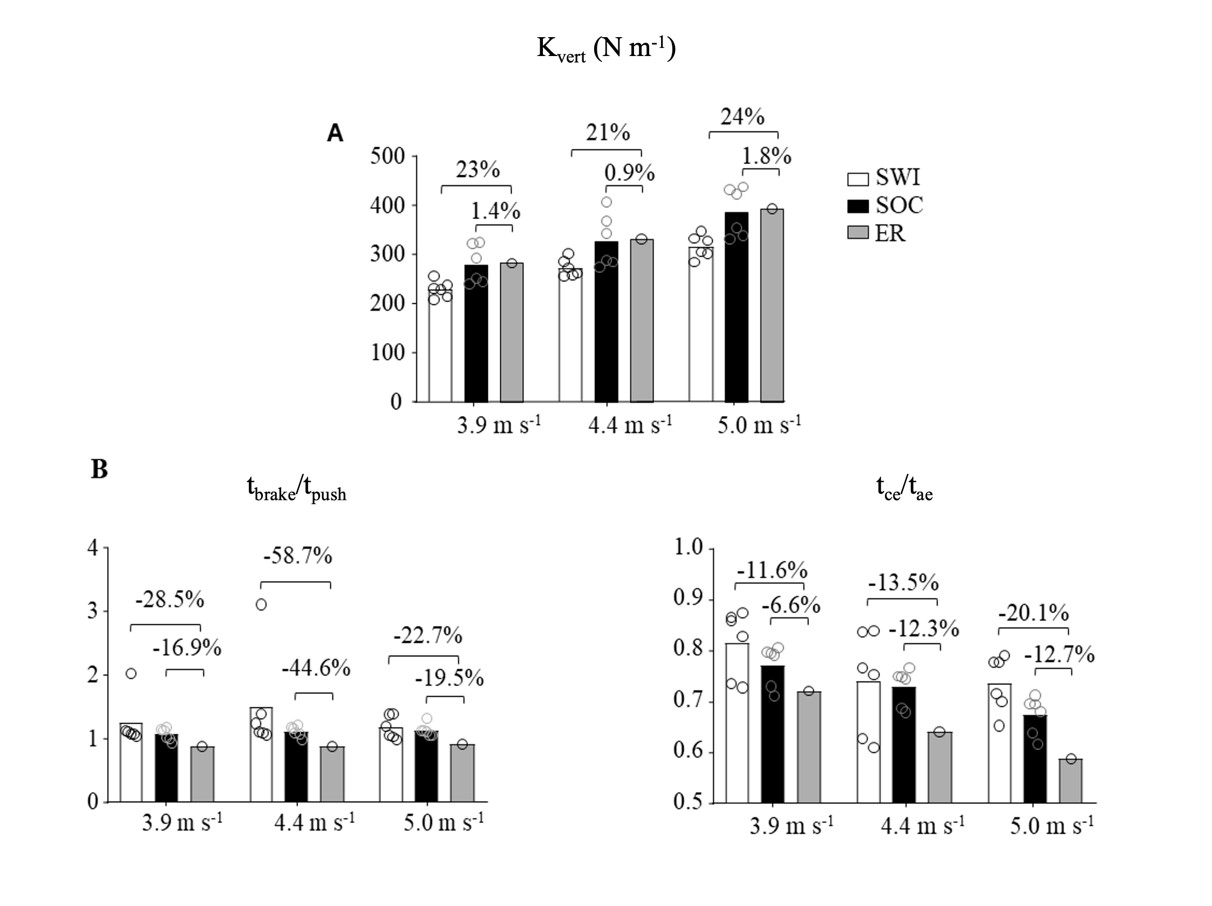
The tbrake/tpush ratio consistently shows lower values for ER compared to both SWI and SOC across all speeds. At 3.88 m·s−1, ER’s tbrake/tpush ratio is 28.5% lower than that of SWI (z: 0.3911) and 16.9% lower than SOC (z: 0.8147). At 4.44 m·s−1, this difference increases, with ER’s tbrake/tpush ratio being 44.6% lower than SWI (z: 0.5483) and 58.7% lower than SOC (z: 0.9568). At the highest speed, 5.00 m·s−1, ER’s tbrake/tpush ratio remains lower, showing a 22.7% decrease compared to SWI (z: -0.1026) and a 19.5% decrease compared to SOC (z: 1.4478). For the tce/tae ratio, ER also displayed lower values than both groups. At 3.88 m·s−1, ER’s tce/tae ratio was 11.6% lower than SWI (z: -1.4184) and 6.6% lower than SOC (z: -1.2392). This trend continued at 4.44 m·s−1, with ER’s tce/tae ratio 13.5% lower than SWI (z: -0.9977) and 12.3% lower than SOC (z: -2.4515). At 5.00 m·s−1, the tce/tae ratio for ER was 20.1% lower than SWI (z: -2.6843) and 12.7% lower than SOC (z: -2.2663).
Peak forces and load rate
The ER showed distinct values for both initial peak force (FPeak1) and FMax relative to both SWI and SOC at all speeds. For FPeak1, at 3.88 m·s−1, ER's values were 20% lower than SWI and 13% lower than SOC. At 4.44 m·s−1, ER's FPeak1 was 14% lower than SWI and 11% lower than SOC. At 5.00 m·s−1, FPeak1 for ER remained reduced, showing a 13% difference between SWI and SOC. Regarding FMax, at 3.88 m·s−1, ER's values were 18% higher than SWI (z: 5.0052) and 7% higher than SOC (z: 1.4128). At 4.44 m·s−1, FMax for ER was 19% higher than SWI (z: 5.0592) and 10% higher than SOC (z: 2.6895). Finally, at 5.00 m·s−1, ER's FMax was 23% higher than SWI (z: 6.3577) and 10% higher than SOC (z: 2.6583). The ER’s load rate (N/ms) showed distinct values compared to SWI and SOC across all speeds. At 3.88 m·s−1, ER’s load rate was 13% lower than SWI (z: -1.2129) but 4.2% higher than SOC (z: 0.1276). At 4.44 m·s−1, ER’s load rate was 10.5% lower than SWI (z: -0.8135) and 10.6% higher than SOC (z: 0.3558). At 5.00 m·s−1, ER’s load rate remained 10.5% lower than SWI (z: -0.5447) and showed an 11% increase compared to SOC (z: 0.3441).
Vertical stiffness
The ER displayed higher kvert (stiffness) than SWI and SOC across all speeds analyzed (3.9, 4.4, and 5.0 m·s−1). At 3.9 m·s−1, kvert for ER was approximately 22% higher than SWI (z: 5.0052) and around 4% higher than SOC (z: 1.4128). As the speed increased to 4.4 m·s−1, ER’s kvert remained elevated, showing a 24% difference from SWI (z: 5.0592) and a 5% increase compared to SOC (z: 2.6895). Finally, at 5.0 m·s−1, kvert for ER was 25% higher than SWI (z: 6.3577) and roughly 6% above that of SOC (z: 2.6583). The increased stiffness in ER was attributed to a greater F max and a reduced Δy during ground contact. At 5.0 m·s−1, F max for ER was approximately 15% higher than that of SWI (z: 6.3577) and around 8% higher than SOC (z: 2.6583), while Δy was roughly 12% smaller than SWI (z: -2.8764) and slightly smaller than SOC.
DISCUSSION
This case report provides a comparative analysis of the bouncing mechanics and spatiotemporal parameters between an elite marathon runner (ER) and athletes from other sports backgrounds, swimmers (SWI) and soccer players (SOC), across various speeds. The results reveal distinct ER biomechanical adaptations, reflecting the unique demands of endurance running compared to other athletic disciplines.
In the individual case of the ER, we found a consistently higher kvert across speeds, characterized by greater Fmax (Figure 3A) and a smaller vertical COM excursion during stance. This profile aligns with evidence that kvert increases with speed and is typically higher in elite runners (Arampatzis et al., 1999; Burns et al., 2021; Da Rosa et al., 2019). Overall, these findings are consistent with endurance literature linking higher kvert and a more efficient bounce with performance in trained runners (Da Rosa et al., 2019). Taken together, these observations suggest that kvert appropriately captures elite-specific distinctions and may serve as a practical indicator of an efficient bouncing mechanism in high-level endurance running.

A) This panel shows the load rate (N/ms) for swimmers (SWI), soccer players (SOC), and the elite marathon runner (ER) across three running speeds (3.9, 4.4, and 5.0 m·s−1). The ER demonstrates differences in load rate compared to SWI and SOC, with percentage differences indicated above each comparison. B) This panel presents F Peak 1 (initial peak force, %BW) and F Max (maximum peak force, %BW) for SWI, SOC, and ER at each speed. Note: Data for SWI and SOC were obtained from Núñez-Lisboa et al. (2021). Data for ER is from the current case report.
Further distinctions are captured by the time ratios tbrake/tpush and tce/tae (Figure 2B). The consistently lower tbrake/tpush ratio in ER highlights a reduced braking phase relative to push-off, indicating that the runner spends more time in propulsion than braking. This is typically optimized at intermediate running speeds (~3.61-3.89 m/s) (Figure S1), where tendon contribution predominates and muscles operate closer to isometric conditions, favoring elastic energy storage and return (Cavagna et al., 2008). In contrast, the SOC group maintained a tbrake/tpush ratio close to 1 across their typical running range (3.89-5.00 m/s), which likely reflects adaptations to the demands of soccer match play, where sustained high-speed running and repeated sprinting are common (Oliva-Lozano et al., 2020). Likewise, the lower tce/tae ratio observed in the ER reflects a reliance on increased aerial time (ta) over contact time (tc) (Table 2). As speed increases, tc shortens while ta remains relatively stable, leading to tae becoming greater than tce (Figure 4B). This asymmetry reflects a rebound where tendons store and return elastic energy more effectively, while muscles operate closer to isometric conditions, reducing the need for active work (Cavagna, 2006, 2009). This efficient adaptation minimizes ground contact and reduces the energy cost per step. These ratios suggest a more refined bouncing mechanism, crucial for conserving metabolic resources across long distances, which aligns with the need for energy efficiency in marathon running (Cavagna et al., 1987; Da Rosa et al., 2019).

A) This panel illustrates the vertical stiffness (kvert, N·kg−1·m−1) of swimmers (SWI), soccer players (SOC), and the elite marathon runner (ER) at three running speeds (3.9, 4.4, and 5.0 m·s−1). The ER consistently demonstrates higher stiffness values than SWI and SOC across all speeds, with percentage differences indicated above each pair. B) This panel presents the ratios of tbrake/tpush and tce/tae across speeds for each group, providing insights into phase asymmetries. Note: Data for SWI and SOC were obtained from Núñez-Lisboa et al. (2021). Data for ER is from the current case report.
In terms of force, the ER displayed a lower FPeak1 compared to SWI and SOC, indicating a smoother initial ground contact and reduced braking impact (Figure 3B). Such reductions in braking forces lower the strain on muscles and conserve energy, essential for endurance athletes aiming to avoid fatigue over extended efforts (Da Rosa et al., 2019). In contrast, the ER showed a higher FMax during push-off across all speeds, demonstrating the ability to generate substantial propulsive force despite a gentler initial impact. This combination of a lower FPeak1 and a higher FMax exemplifies efficient force management in the ER, enabling sustained propulsion with minimal energy loss (Da Rosa et al., 2019; Lieberman et al., 2010). The loading rate further underscores these adaptations (Figure 3A). The ER’s loading rate was lower than that of SWI, indicating a reduced braking impact that minimizes fatigue and injury risk, yet it remained slightly higher than SOC. This slight increase compared to SOC may suggest a balance maintained in endurance running, where stability and momentum are essential for rhythm without excessive deceleration.
These mechanical differences are complemented by shorter tc and longer ta, parameters associated with superior running economy and overall efficiency in trained runners (Barnes and Kilding, 2015; Van Oeveren et al., 2024). The ER also showed a VO2max of 81.9 ml·kg−1·min−1, a value recognized a predictor of running performance in elite runners (Barnes and Kilding, 2015; Joyner, 1991). His adaptations, expressed in favorable tbrake/tpush and tce/tae ratios, together with optimal force application and a balanced load rate, reflect the specific demands of marathon running and illustrate how targeted training shapes bouncing mechanics for efficiency in endurance performance (Burns et al., 2021; Da Rosa et al., 2019; Núñez Lisboa et al., 2021).
This case report used brief treadmill bouts (1 min per speed), which may not fully capture competitive demands. Future research should therefore integrate longer, fatigue-inducing protocols to assess how mechanical variables evolve over time and how elite athletes preserve their movement efficiency under stress. Combining energetic, mechanical, and perceptual measures would provide a more complete and mechanistic understanding of endurance, bridging the gap between physiological durability and biomechanical adaptability (Dewolf et al., 2025). Despite this limitation, the study offers a clear mechanical profile with practical implications for training.
CONCLUSION
This case report highlights the unique adaptations of an ER compared to SWI and SOC, focusing on the distinct biomechanics required for endurance running. The ER’s lower tbrake/tpush and tce/tae ratios underscore a refined bouncing mechanism, with prolonged propulsion phases and minimized ground contact, essential for conserving energy over long distances. Additionally, force application patterns, with a lower Fpeak1 and a higher Fmax reveal an efficient use of elastic energy for propulsion, further supporting endurance performance.
These insights underscore how marathon training shapes specific biomechanical strategies to optimize energy efficiency, and propulsion. Understanding these individualized adaptations contributes to broader knowledge of how different sports cultivate specialized movement efficiencies, with practical implications for training endurance athletes. As this is a single-athlete case report, these findings are descriptive and should not be interpreted as population-level inferential differences; the between-group contrasts are illustrative.
Supplementary Material
Supplementary material accompanies this paper.
Supplementary Figure 1
This material is available as part of the online article from https://doi.org/10.1590/rbce.47.e20240115
-
FUNDING
This research was conducted without any financial support.
-
DATA AVAILABILITY
The data that support the findings of this study are available from the corresponding author, AHD, upon reasonable request.
REFERENCES
-
Altman DG. Practical statistics for medical research [Internet]. 1st ed. Chapman & Hall/CRC; 1991 [cited 2024 Nov 6]. Chapter 7, Product and Process Comparisons. Available from: https://www.itl.nist.gov/div898/handbook/toolaids/pff/prc.pdf?utm_source=chatgpt.com
» https://www.itl.nist.gov/div898/handbook/toolaids/pff/prc.pdf?utm_source=chatgpt.com -
Arampatzis A, Brüggemann G-P, Metzler V. The effect of speed on leg stiffness and joint kinetics in human running. J Biomech. 1999;32(12):1349-53. https://doi.org/10.1016/S0021-9290(99)00133-5 PMid:10569714.
» https://doi.org/10.1016/S0021-9290(99)00133-5 -
Barnes KR, Kilding AE. Running economy: measurement, norms, and determining factors. Sports Med Open. 2015;1(1):8. https://doi.org/10.1186/s40798-015-0007-y PMid:27747844.
» https://doi.org/10.1186/s40798-015-0007-y -
Blagrove RC, Hayes PR, editors. (2021). The science and practice of middle and long distance running. 1st ed. New York: Routledge. https://doi.org/10.4324/9781003088912
» https://doi.org/10.4324/9781003088912 -
Burns GT, Gonzalez R, Zendler JM, Zernicke RF. Bouncing behavior of sub-four minute milers. Sci Rep. 2021;11(1):10501. https://doi.org/10.1038/s41598-021-89858-1 PMid:34006954.
» https://doi.org/10.1038/s41598-021-89858-1 -
Cavagna GA, Heglund NC, Taylor CR. Mechanical work in terrestrial locomotion: two basic mechanisms for minimizing energy expenditure. Am J Physiol. 1977;233(5):R243-61. https://doi.org/10.1152/ajpregu.1977.233.5.R243 PMid:411381.
» https://doi.org/10.1152/ajpregu.1977.233.5.R243 -
Cavagna GA, Franzetti P, Heglund NC, Willems P. The determinants of the step frequency in running, trotting and hopping in man and other vertebrates. J Physiol. 1987;399(1):81-92. https://doi.org/10.1113/jphysiol.1988.sp017069 PMid:3404473.
» https://doi.org/10.1113/jphysiol.1988.sp017069 -
Cavagna GA, Legramandi MA, Peyré-Tartaruga LA. The landing–take-off asymmetry of human running is enhanced in old age. J Exp Biol. 2008;211(10):1571-8. https://doi.org/10.1242/jeb.013805 PMid:18456884.
» https://doi.org/10.1242/jeb.013805 -
Cavagna GA. The landing–take-off asymmetry in human running. J Exp Biol. 2006;209(20):4051-60. https://doi.org/10.1242/jeb.02344 PMid:17023599.
» https://doi.org/10.1242/jeb.02344 -
Cavagna GA. The two asymmetries of the bouncing step. Eur J Appl Physiol. 2009;107(6):739-42. https://doi.org/10.1007/s00421-009-1179-2 PMid:19727798.
» https://doi.org/10.1007/s00421-009-1179-2 -
Cavagna GA. Symmetry and asymmetry in bouncing gaits. Symmetry. 2010;2(3):1270-321. https://doi.org/10.3390/sym2031270
» https://doi.org/10.3390/sym2031270 -
Da Rosa RG, Oliveira HB, Gomeñuka NA, Masiero MPB, Da Silva ES, Zanardi APJ, et al. Landing-takeoff asymmetries applied to running mechanics: a new perspective for performance. Front Physiol. 2019;10:415. https://doi.org/10.3389/fphys.2019.00415 PMid:31040793.
» https://doi.org/10.3389/fphys.2019.00415 -
Dewolf A, Peñailillo LE, Willems PA. The rebound of the body during uphill and downhill running at different speeds. J Exp Biol. 2016;219(Pt 15):2276-88. https://doi.org/10.1242/jeb.142976 PMid:27207641.
» https://doi.org/10.1242/jeb.142976 -
Dewolf A, Lejeune T, Willems PA. The on-off ground asymmetry during running on sand. Comput Methods Biomech Biomed Engin. 2019;22(suppl. 1):S291-3. https://doi.org/10.1080/10255842.2020.1714917
» https://doi.org/10.1080/10255842.2020.1714917 -
Dewolf A, Kisita V, Mesquita R. Integrating biomechanics into endurance performance frameworks: an urgent need. J Appl Physiol. 2025;139(6):1716-7. https://doi.org/10.1152/japplphysiol.00694.2025 PMid:41396100.
» https://doi.org/10.1152/japplphysiol.00694.2025 -
Joyner MJ. Modeling: optimal marathon performance on the basis of physiological factors. J Appl Physiol. 1991;70(2):683-7. https://doi.org/10.1152/jappl.1991.70.2.683 PMid:2022559.
» https://doi.org/10.1152/jappl.1991.70.2.683 -
Legramandi MA, Schepens B, Cavagna GA. Running humans attain optimal elastic bounce in their teens. Sci Rep. 2013;3(1):1310. https://doi.org/10.1038/srep01310 PMid:23419705.
» https://doi.org/10.1038/srep01310 -
Lieberman DE, Venkadesan M, Werbel WA, Daoud AI, D’Andrea S, Davis IS, et al. Foot strike patterns and collision forces in habitually barefoot versus shod runners. Nature. 2010;463(7280):531-5. https://doi.org/10.1038/nature08723 PMid:20111000.
» https://doi.org/10.1038/nature08723 -
Lussiana T, Patoz A, Gindre C, Mourot L, Hébert-Losier K. The implications of time on the ground on running economy: Less is not always better. J Exp Biol. 2019;222(Pt 6):jeb.192047. https://doi.org/10.1242/jeb.192047 PMid:30787136.
» https://doi.org/10.1242/jeb.192047 -
Mesquita RM, Dewolf A, Catavitello G, Osgnach C, Di Prampero PE, Willems PA. The bouncing mechanism of running against hindering, or with aiding traction forces: a comparison with running on a slope. Eur J Appl Physiol. 2020;120(7):1575-89. https://doi.org/10.1007/s00421-020-04379-5 PMid:32394064.
» https://doi.org/10.1007/s00421-020-04379-5 -
Núñez Lisboa M, Peñailillo L, Cancino J, Zbinden-Foncea H, Dewolf A. Influence of sports background on the bouncing mechanism of running. Sports Biomech. 2021;23(5):670-81. https://doi.org/10.1080/14763141.2021.1884284 PMid:33666140.
» https://doi.org/10.1080/14763141.2021.1884284 -
Oliva-Lozano JM, Gómez-Carmona CD, Pino-Ortega J, Moreno-Pérez V, Rodríguez-Pérez MA. Match and training high intensity activity-demands profile during a competitive mesocycle in youth elite soccer players. J Hum Kinet. 2020;75(1):195-205. https://doi.org/10.2478/hukin-2020-0050 PMid:33312307.
» https://doi.org/10.2478/hukin-2020-0050 -
Schepens B, Willems PA, Cavagna GA. The mechanic of running in children. J Physiol. 1998;509(3):927-40. https://doi.org/10.1111/j.1469-7793.1998.927bm.x PMid:9596810.
» https://doi.org/10.1111/j.1469-7793.1998.927bm.x -
Van Oeveren BT, De Ruiter CJ, Beek PJ, Van Dieën JH. The biomechanics of running and running styles: a synthesis. Sports Biomech. 2024;23(4):516-54. https://doi.org/10.1080/14763141.2021.1873411 PMid:33663325.
» https://doi.org/10.1080/14763141.2021.1873411 -
Willems PA, Gosseye TP. Does an instrumented treadmill correctly measure the ground reaction forces? Biol Open. 2013;2(12):1421-4. https://doi.org/10.1242/bio.20136379 PMid:24285705.
» https://doi.org/10.1242/bio.20136379 -
Williams KR. Biomechanical factors contributing to marathon race success. Sports Med. 2007;37(4-5):420-3. https://doi.org/10.2165/00007256-200737040-00038 PMid:17465624.
» https://doi.org/10.2165/00007256-200737040-00038
Edited by
-
Responsible Editors:
Executive Editor: Pedro Otavio Pimpim BezerraChief Editor: Leonardo TartarugaAssociate Editor: André Ivaniski MelloFinal Editor: Ari Lazzarotti Filho
The data that support the findings of this study are available from the corresponding author, AHD, upon reasonable request.