 Phenotypic characterization of Class III malocclusion using three-dimensional analysis on a sample of Yemeni population: a retrospective cross-sectional study
ABSTRACT
Introduction: Class III malocclusion is one of the abnormalities in the craniofacial development that can be affected mainly by genetic and environmental components. It is a clinical challenge, due to limited understanding of its etiology. Exploring its prototypical diversity helps to identify its etiological details.
Objective: This study aimed to characterize Class III malocclusion subgroups depending on the phenotypic characteristics, by using cone beam computed tomography (CBCT) in a selected group of Yemeni subjects.
Methods: A retrospective cross-sectional study was performed using 80 pretreatment CBCT of patients (46 males, 34 females), with ages of ≥18 years for males and ≥16 years for females. All cases had Class III malocclusion ranging from mild to severe. The total of 74 measurements were three-dimensionally analyzed using Invivo® 6.0 software. These measurements were categorized into 46 skeletal, 18 dentoalveolar, and 10 soft tissue variables. Principal component analysis (PCA) and cluster analysis (CA) were performed to identify the most common clusters in skeletal Class III malocclusion phenotypes.
Results: The PCA revealed 8 axis models, which were responsible for 78.9% of the variation of the data produced from the 74 variables. The first four components accounted for 56% of the total variations, explained mainly the sagittal, dental, vertical, and anteroposterior relationships in the data. The CA revealed four skeletal Class III malocclusion phenotypes: C1=32.8%; C2=28.4%; C3=28.4%; and C4=10.4%.
Conclusion: Based on CBCT, four phenotypes of skeletal Class III malocclusion were identified among Yemeni population. These findings help to provide differential diagnosis that lead to set up an accurate and effective treatment plan.
Keywords:
Angle Class III malocclusion; Principal component analysis; Cluster analysis; Cone beam computed tomography
RESUMO
Introdução: A má oclusão de Classe III é uma das anomalias no desenvolvimento craniofacial que pode ser afetada principalmente por componentes genéticos e ambientais. Constitui um desafio clínico, devido à compreensão limitada de sua etiologia. Explorar sua diversidade prototípica pode ajudar a identificar seus detalhes etiológicos.
Objetivo: O objetivo deste estudo foi caracterizar os subgrupos da má oclusão de Classe III, dependendo das características fenotípicas, usando a tomografia computadorizada de feixe cônico (TCFC) em um grupo selecionado de indivíduos do Iêmen.
Métodos: Foi realizado um estudo transversal retrospectivo usando TCFCs pré-tratamento de 80 pacientes (46 homens, 34 mulheres) com idades de ≥18 anos para homens e ≥16 anos para mulheres. Todos os pacientes tinham má oclusão de Classe III, variando de leve a grave. No total, 74 medidas foram analisadas tridimensionalmente com o software Invivo® 6.0. Essas medidas foram categorizadas em 46 variáveis esqueléticas, 18 dentoalveolares e 10 de tecidos moles. A análise de componentes principais (ACP) e a análise de clusters (AC) foram realizadas para identificar os agrupamentos mais comuns nos fenótipos esqueléticos da má oclusão de Classe III.
Resultados: A ACP revelou 8 modelos de eixos, que foram responsáveis por 78,9% da variação dos dados produzidos a partir das 74 variáveis. Os quatro primeiros componentes foram responsáveis por 56% das variações totais e explicaram principalmente as relações sagital, dentária, vertical e anteroposterior nos dados. A AC revelou quatro fenótipos esqueléticos de má oclusão de Classe III: C1=32,8%; C2=28,4%; C3=28,4%; e C4=10,4%.
Conclusões: Com base nas TCFCs, foram identificados quatro fenótipos de má oclusão esquelética de Classe III na população do Iêmen. Esses achados ajudam a fornecer um diagnóstico diferencial que leva ao estabelecimento de um plano de tratamento mais preciso e eficaz.
Palavras-chave:
Má oclusão de Classe III de Angle; Análise de componentes principais; Análise de clusters; Tomografia computadorizada de feixe cônico
INTRODUCTION
Treatment of Class III malocclusion is a challenging task for orthodontists.1 The prevalence of Class III malocclusion is low and varies depending on ethnic background.2 The prevalence of Class III malocclusion among Yemeni adolescents was 13.5% for incisor relationship and 2.5% for bilateral canine relationship.3 Class III malocclusion is affected by wide ranges of congenital and environmental factors.4 An accurate diagnosis and prognosis of Class III malocclusion is essential for its management. A normal occlusion and improved facial esthetics for skeletal Class III patients can be achieved by growth modification, orthodontic camouflage, or orthognathic surgery. The treatment strategies can be based on dental development and skeletal development or after growth cessation.5
In Dentistry field, cone beam computed tomography (CBCT) is an accurate diagnostic tool for assessing soft and hard tissues, defining treatment plans, and evaluating their outcomes.6,7 According to the literature, CBCT image has a high degree of measurement accuracy in all three planes of space.8 For example, a study using Björk and Jabarak cephalometric analysis9 on CBCT lateral cephalograms in adults with different sagittal skeletal malocclusions concluded that skeletal Class III malocclusion was strongly differentiated from the other sagittal Classes, particularly in the mandibular aspect.9 Different previous studies used multivariate analysis, such as principal component analysis (PCA) and cluster analysis (CA), to aid further detailed information about the characterization of Class III phenotypes.10-12 PCA is a dominant approach that reduces complex data into data that is easier to interpret. CA is a multivariate technique that classifies patients according to the levels of similarity. CA can be used to show distinct patterns of correlation among phenotypic variables, allowing the orthodontist to develop accurate treatment planning to address the underlying skeletal problem in Class III patients. Several studies stated that cluster analysis can better characterize the subtypes of other diseases10-12; therefore, CA has been used to find the subgroups of Class III malocclusion and then identify the severity between subgroups.10,11
Studies on Class III phenotypes revealed various sub-phenotypes among different studies and populations, ranging from fourteen15, seven13, nine14, and four10,11 different sub-phenotypes in Asian populations to five clinically distinguishable phenotypes among Caucasian individuals,12,16 and six homogeneous sub-phenotypes in southern European subjects.17
Three-dimensional analysis probably is the best way to approach the phenotypes of Class III malocclusion.11 Up to our knowledge, there is no study up to date that thoroughly defined different Class III malocclusion phenotypes in Yemeni adults. Moreover, this is the first study that aimed to use the three-dimensional radiograph, instead of conventional cephalometric radiograph, to identify Class III malocclusion phenotypes.
MATERIAL AND METHODS
STUDY SAMPLE
A retrospective cross-sectional study was designed, and the sample was collected from patients’ orthodontic records in the Orthodontics department of Sana’a University, using their pretreatment CBCT. This study was designed following the STROBE guidelines, and conducted in adherence to the Declaration of Helsinki. The study protocol was approved by the Ethical Committee of the Faculty of Medicine and Health Sciences, Sana’a University, Yemen (Approval no.: ECA/SU/203). The pretreatment CBCT images were obtained from the archives of the Orthodontics department (Sana’a University, Yemen), and were collected and studied from April 2020 to December 2022. The sample size has been estimated based on data available from previous studies.11,16 The sample size was calculated with a confidence level (1 − α) of 95%, statistical power of 90%, precision (d) of 0.30, and variance (S2) of the quantitative variable of reference group equal to 0.69. The sample was calculated as 120; however, from the total 1,000 CBCTs, unfortunately only 80 CBCT images met the inclusion criteria. All scans were taken for standard orthodontic/orthognathic diagnosis and treatment planning purposes.
The inclusion criteria of the selected sample were: molar or canine Class III malocclusion; Wits appraisal < −0.5 and/or ANB ≤ 0; postpubertal subjects (16-35 years of age) who were in phase IV or V of the cervical vertebral maturation stage (CVMS), and had practically completed their growth - to ensure that the developing malocclusion phenotype was fully expressed. The exclusion criteria were: low quality data, patients with any type of syndrome or asymmetry, and patients with history of orthodontics treatment or craniofacial trauma.
THREE-DIMENSIONAL ANALYSIS
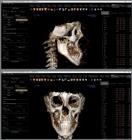
CBCT was taken using a PaX-Flex3D P2 machine (ver. 1.0.0, Vatech, Korea, serial number 055,001482). The following parameters were used for the acquisition: field of view ≥8×8cm; 50-99 kv; 4-16MAs; scanning time of 15.0s; and the image voxel size equal to 0.2-0.3 mm. CBCT image has acquired with the subjects in a standard upright position, and Frankfort horizontal plane was parallel to the floor, guided by the crossing laser guide and front mirror. According to the imaging protocol, the CBCT imaging was done while patients were in centric occlusion and instructed not to swallow or move during the scanning process. The data were extracted in DICOM format (Digital Imaging and Communications in Medicine). Seventy-four linear, angular, and ratios measurements were three-dimensionally analyzed using Invivo v.6.0 software (Anatomage, Santa Clara, CA, USA). The three-dimensional definitions of the anatomical landmarks used in this study are presented in Table 1 and Figure 1. The measurements were applied to evaluate the required variables (46 skeletal, 18 dentoalveolar, and 10 soft tissues). These landmarks represent comprehensive craniofacial data and their relationships with each other. The identification of landmarks was viewed and confirmed on the three-dimensional planes. For all bilateral landmarks, the midpoint was considered rather than averaging the values of both sides, to make the measurements more accurate and valid. After identifying the anatomical landmarks, the Invivo 6.0 software automatically drew planes and performed all measurements (Table 1, Fig. 1).
RELIABILITY ASSESSMENT
The ability to perform the analysis according to the required standard analysis protocol was verified before analyzing the data. To improve the measurement’s validity and accuracy, a six-months training has been taken with dental radiologist. The intra-examiner reliability of three-dimensional craniofacial measurements was tested, and 20% randomly chosen data were retraced and digitized three times at three weeks’ interval, by the main operator (FB). The method error between the replicated tracing was calculated using the intraclass correlation and Cronbach’s alpha tests. There was very good intra-observer agreement regarding all measurements, with Cronbach’s alpha reliability coefficients ranging from 0.754 to 0.995.
STATISTICAL ANALYSIS
Data was analyzed by using the IBM SPSS Statistics version 26.0 software. Due to the large number of variables, multivariate analysis such as PCA and CA were selected. These statistical tests aimed to determine the most homogeneous groups of individuals with various Class III phenotypes.
Firstly, the data was reduced by PCA, to dimensionally reduce a large set of variables into a smaller one that still contains most of the information of the large set prior to CA. The smaller set of new variables is known as components: 74 components were arranged in descending order by Eigenvalues - as the component order increases, less data is collected by the components. For components assessment, the Varimax rotation (Kaiser normalization) was used to transform the initial factors into new informative ones that are easier to interpret.
Secondly, a partitioned CA of extracted principal components (PCs) was performed, with methods based on the K-means algorithms. Finding the optimal number of clusters is an essential part of this algorithm. A commonly used method for finding the optimal K-value is the Elbow method, which involves plotting the variance, explained by different number of clusters, and identifying the Elbow point, where the rate of variation drops sharply, suggesting an appropriate cluster count for analysis. Means and standard variations (SD) for the variables in each cluster were calculated, and one-way ANOVA was used to detect differences between groups. The two-way cluster comparisons were performed. For comparisons between genders in each cluster, an independent t-test was used. P-values < 0.05 were considered statistically significant.
RESULTS
Initially, 1,000 CBCTs from patients’ files were collected and screened. Only 120 CBCTs were assessed for eligibility and, from this group, 40 CBCTs were excluded (n=40), according to exclusion criteria. Therefore, the final sample was 80 CBCTs. The sample consisted of 80 Yemeni adults (46 males, 66.7%, 34 females, 33.3%) with the mean age of 22.61 ± 5.13 years. This study used 74 variables; moreover, the results of the PCA identified 8 PCs that explained 78.9% of the overall variation in the data. The 8 PCs have been selected as they represented the greatest diversity in the collected data, and were obvious in their anatomic explanations (Fig. 2, Table 2).

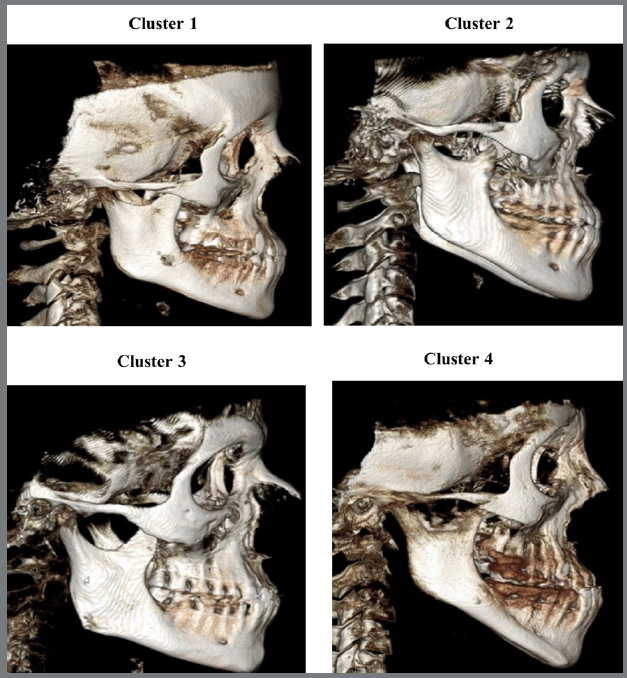
C1 was the most observed cluster (n=26, male=36.4%, female=63.6%). This cluster was characterized by short anterior and posterior cranial bases, moderate maxillary retrusion, slightly normal mandibular plane, moderate mandibular protrusion, slightly protrusive chin, slightly decreased mandibular size, increased lower facial height (LFH) and total facial height (TFH), decreased upper facial height (UFH), dentoalveolar maxillary proclination and mandibular retroclination, protrusive upper and lower lips, and average facial type.
C2 (n=21, male=63.2%, female=36.8%) was characterized by short anterior and posterior cranial bases, slight maxillary retrusion, steep mandibular plane, slight mandibular protrusion, slightly protrusive chin, increased mandibular size, increased LFH and TFH, decreased UFH, proclined maxillary and retroclined mandibular teeth, protrusive upper and lower lips, hyperdivergent facial type.
C3 (n=21, male=73.7%, female=26.3%) was characterized by short anterior and posterior cranial bases, maxilla within the normal range, flat mandibular plane, severe mandibular protrusion, protrusive chin, increased mandibular size, long ramus, decreased LFH and TFH, increased UFH, nearly normal maxilla, and lingually inclined mandibular teeth, normal upper lip, protrusive lower lip, concave profile, hypodivergent facial type.
C4 (n=12, male=57.1%, female=42.9%) was the least observed cluster, and was characterized by short anterior and posterior cranial bases, maxillary deficiency, increased mandibular plane, severe mandibular protrusion, protrusive chin, decreased total mandibular size, short ramus, increased LFH and TFH, decreased UFH, proclined maxillary and retroclined mandibular teeth, retrusive upper lip, more protrusive lower lip, hyperdivergent facial type (Fig. 3 and 4, Table 3).

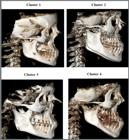
C1 (moderate phenotype), C2 (borderline phenotype), C3 (mandibular protrusion phenotype), C4 (severe phenotype).
DISCUSSION
Skeletal Class III malocclusion has its own specific characteristics, which derive from genetic process. The identification and detailed description of phenotypic subtypes in the target population may allow one to obtain accurate objective criteria for the development of future studies, analyzing responses in the treatment, and analyzing etiological and differentiating factors of each sub-phenotype. In this study, three-dimensional analysis of skeletal, dentoalveolar, and soft tissue measurements have been performed to characterize Class III malocclusion sub-phenotypes by PCA and CA. The skeletal classification of samples has been determined using the ANB and Wits appraisal. The PCA of this study revealed eight axis models, which was similar to the results of the three-dimensional study done by Al-Shoaibi et al.11 When comparing this results with two-dimensional studies, the numbers of the axis models revealed two, seven, and ten components that covered 84%, 93.4%, and 92.9%, respectively.14,17,18 This is attributed to the inclusion of large numbers of skeletal variables to construct their axis models, while excluding other variables such as dental and soft tissue measurements. According to the PCA generated in this research, the first four axis models consisted mainly of sagittal, dental parameters, vertical variables, and anteroposterior relation of maxilla and mandible.
Eight factors derived from PCA analysis were used as variables for CA to classify the skeletal Class III malocclusion. The number of clusters not only depends on ethnic groups,19 but also can be affected by the type of cluster that has been used, whether hierarchical,20 diffuse,21 mixed17 or K-mean, which have been used in previous studies10,11,16 and in the present study. Additionally, the present study classified Class III into four phenotypes, which was similar to Li et al.10 and Al-Shoaibi et al.11, as it revealed the most significant, meaningful and acceptable phenotypes.
In this study, the characteristics of C1 were similar to those found in C1 by Al-Shoaibi et al.11 This might be due to skeletal Class III of mixed origin being the most common type of this malocclusion. In Al-Shoaibi et al.11 study, the group with the lowest number of C2 subjects was characterized by severe deficiency and protrusion of mandible, which was equivalent to C4 in this study. This could be due to the severe combination of maxillary retrognathism and mandibular prognathism, which is the less frequently found in adults. In contrast, the models with slight retrusion of maxilla and mandible (C2), and near normal maxilla and severe mandibular protrusion (C3) were not reported by Al-Shoaibi et al.11 Interestingly, this could be due to the different ethnic origin of the sample population.
Overall, this study showed different clusters description of skeletal Class III malocclusion regarding vertical, sagittal, dental, and soft tissue, compared to the clusters reported by Al-Shoaibi et al.11 This might be due to the dentofacial profile of Yemeni population, which has particular characteristics when compared to Chinese population. Moreover, this suggests that race should be considered when diagnosing facial structures.
Regarding the gender dimorphism, this study showed several linear measurements that were higher in males than female patients. However, in angular measurements, the majority of measurements showed no statistically significant difference between both genders. This finding was similar to Al-Shoaibi et al.11
This study was the first one in Yemen that used multivariate analysis in three-dimensional CBCT. The clusters description of this study has been compared only to another three-dimensional study, because both studies defined comprehensive craniofacial parameter of Class III skeletal malocclusion, which is limited by conventional two-dimensional approaches. Limitations of the study included the small sample size, due to the lack of available data. Another limitation of this study was the start date, during the COVID-19 pandemic, which reduced data collection during this period. Future studies with larger samples are required to understand the differences between regional and environmental factors.
CONCLUSION
This study identified four phenotypes of skeletal Class III malocclusion, with eight PC accounting for 78.9% of the total variation in the data produced from 74 variables among Yemeni population. These included moderate phenotype, borderline Class III, Class III mandibular prognathism, and Class III severe combination of maxillary deficiency and mandibular prognathism. Skeletal Class III is mainly affected by genes, and the detection of these genes would help to predict growth changes and the possible treatment of this malocclusion. In order to understand this genetic component, it is necessary first to identify the various sub-phenotypes that are present within Class III skeletal malocclusion. Such classification is advantageous to provide differential diagnosis that lead to the definition of an accurate and effective treatment plan. Furthermore, it opens a world of possibilities for future genetic analysis, such as genotypic and linkage studies.
REFERENCES
- 1 Alhammadi MS, Halboub E, Fayed MS, Labib A, El-Saaidi C. Global distribution of malocclusion traits: a systematic review. Dental Press J Orthod. 2018;23(6):40.e1-40.e10.
- 2 Laviana A, Thahar B, Melani A, Mardiati E, Putri L, Zakyah AD. Role of matrilin-1 (MATN1) polymorphism in class III skeletal malocclusion with mandibular prognathism in Deutero-Malay race: a case-control study. Egypt J Med Hum Genet. 2021;22:11.
- 3 Al-Maqtari RA, Abdul Kadir R, Awang H, Zamzam NM. Assessment of malocclusion among Yemeni adolescents using canine and incisor classifications. J Adv Med Res. 2012;2:153-9.
- 4 Jaradat M. An overview of Class III malocclusion (prevalence, etiology and management). JAMMR. 2018;25(7):1-13.
- 5 Maruswamy K, Nayak UA, Nayak PA, Ramasamy S. Management of class III malocclusion-A review with report of four cases. Ann Dent Spec. 2018;6(4):464-71.
- 6 Aksoy S, Kelahmet U, Hincal E, Oz U, Orhan K. Comparison of linear and angular measurements in CBCT scans using 2D and 3D rendering software. Biotechnol Biotechnol Equip. 2016 Apr;30(4):777-84.
- 7 Fani S, Moudi E, Haghanifar S, Seyedmajidi S, Poursattar-Bejeh Mir A. Evaluation of the linear and volumetric measuring changes in different positions in CBCT. Clin Exp Dent Res. 2023 Jun;9(3):535-42.
- 8 Abdinian M, Baninajarian H. The accuracy of linear and angular measurements in the different regions of the jaw in cone-beam computed tomography views. Dent. Hypot. 2017;8(4):100-3.
- 9 Rodriguez-Cardenas YA, Arriola-Guillen LE, Flores-Mir C. Björk-Jarabak cephalometric analysis on CBCT synthesized cephalograms with different dentofacial sagittal skeletal patterns. Dental Press J Orthod. 2014 Nov;19(6):46-53.
- 10 Li C, Cai Y, Chen S, Chen F. Classification and characterization of class III malocclusion in Chinese individuals. Head Face Med. 2016 Nov;12(1):31.
- 11 Alshoaibi LH, Alareqi MM, Al-Somairi MAA, Al-Tayar B, Almashraqi AA, An X, et al. Three-dimensional phenotype characteristics of skeletal class III malocclusion in adult Chinese: a principal component analysis-based cluster analysis. Clin Oral Investig. 2023 Aug;27(8):4173-89.
- 12 Bui C, King T, Proffit W, Frazier-Bowers S. Phenotypic characterization of Class III patients. Angle Orthod. 2006 Jul;76(4):564-9.
- 13 Hong SX, Yi CK. A classification and characterization of skeletal Class III malocclusion on etio-pathogenic basis. Int J Oral Maxillofac Surg. 2001 Aug;30(4):264-71.
- 14 Yang IH, Choi JY, Baek SH. Characterization of phenotypes of skeletal Class III malocclusion in Korean adult patients treated with orthognathic surgery using cluster analysis. Angle Orthod. 2022 Jul;92(4):537-46.
- 15 Li S, Xu TM, Lin JX. Analysis of treatment templates of Angle's Class III malocclusion patients. Hua Xi Kou Qiang Yi Xue Za Zhi. 2009 Dec;27(6):637-41.
- 16 Uribe LMM, Vela KC, Kummet C, Dawson DV, Southard TE. Phenotypic diversity in white adults with moderate to severe Class III malocclusion. Am J Orthod Dentofacial Orthop. 2013 Jul;144(1):32-42.
- 17 Frutos-Valle L, Martín C, Alarcón JA, Palma-Fernández JC, Ortega R, Iglesias-Linares A. Novel sub-clustering of class iii skeletal malocclusion phenotypes in a southern european population based on proportional measurements. J Clin Med. 2020 Sep;9(9):3048.
- 18 Kim JY, Lee SJ, Kim TW, Nahm DS, Chang YI. Classification of the skeletal variation in normal occlusion. Angle Orthod. 2005 May;75(3):311-9.
- 19 Frutos-Valle L, Martin C, Alarcon JA, Palma-Fernandez JC, Iglesias-Linares A. Subclustering in skeletal Class III phenotypes of different ethnic origins: a systematic review. J Evid Based Dent Pract. 2019 Mar;19(1):34-52.
- 20 Abu Alhaija ES, Richardson A. Growth prediction in Class III patients using cluster and discriminant function analysis. Eur J Orthod. 2003 Dec;25(6):599-608.
- 21 Auconi P, Scazzocchio M, Cozza P, McNamara JA Jr, Franchi L. Prediction of Class III treatment outcomes through orthodontic data mining. Eur J Orthod. 2015 Jun;37(3):257-67.
-
1
» The authors report no commercial, proprietary or financial interest in the products or companies described in this article.
-
How to cite:
Bukareza F, Al-Harazi G, Al-Rai S. Phenotypic characterization of Class III malocclusion using three-dimensional analysis on a sample of Yemeni population: a retrospective cross-sectional study. Dental Press J Orthod. 2025;30(3):e2524129.