
 Machine Learning and Simulation: pathways to efficient emergency care in Brazil
Abstract
Modeling and Simulation (M&S) allows for reproducing medical procedures and services, understanding disease progression, and predicting treatment responses without risks to real patients. This study aims to simulate the ambulance service system of the Mobile Emergency Care Service (SAMU) in a Brazilian region, using the Arena software and Machine Learning (ML). The quantitative methodology combines mathematical modeling and a case study to analyze variables such as the number of ambulances, patient arrivals, waiting times, and workload. Using the Manchester Protocol as a reference, the Arena results feed a regression model to relate waiting times and the number of ambulances. Integrating these techniques allowed for predictions regarding the impact of different resource configurations. Based on real data, the numerical results indicated reduced waiting times with increased ambulances and streamlined resource allocation. Thus, by contributing to the operational efficiency of mobile emergency services, the findings also strengthen the resilient performance of the Unified Health System (SUS) in the face of adversities.
Key words:
Health System Resilience; SUS; SAMU; Computer Simulation; Machine Learning
Resumo
A Modelagem e Simulação (M&S) permite a reprodução de procedimentos médicos e serviços, a compreensão da progressão de doenças e a previsão de respostas a tratamentos sem riscos a pacientes reais. O objetivo do artigo é simular o sistema de atendimento de ambulâncias do Serviço de Atendimento Móvel de Urgência (SAMU) em uma região do Brasil, utilizando o software Arena e Aprendizado de Máquina (AM). A metodologia quantitativa combina modelagem matemática e estudo de caso para analisar variáveis como número de ambulâncias, chegada de pacientes, tempo de espera e carga de trabalho. Os resultados do Arena alimentaram um modelo de regressão para relacionar tempo de espera e quantidade de ambulâncias, tendo o Protocolo de Manchester como referência. A integração dessas técnicas permitiu prever o impacto de diferentes configurações de recursos. Os resultados numéricos indicaram, com base em dados reais, a redução no tempo de espera com o aumento de ambulâncias, otimizando a distribuição de recursos. Assim, além de contribuir para a eficiência operacional dos serviços móveis de emergência, os resultados fortalecem o desempenho resiliente do Sistema Único de Saúde (SUS) frente a adversidades.
Palavras-chave:
Resiliência de Sistemas de Saúde; SUS; SAMU; Modelagem Computacional; Aprendizado de Máquina
Resumen
La Modelación y Simulación (M&S) permite la reproducción de procedimientos médicos y servicios, la comprensión de la progresión de enfermedades y la predicción de respuestas a tratamientos sin riesgos para pacientes reales. El objetivo del artículo es simular el sistema de ambulancias del Servicio de Atención Médica de Urgencia (SAMU) en una región de Brasil, utilizando el software Arena y Aprendizaje Automático (AA). La metodología cuantitativa combina modelación matemática y un estudio de caso para analizar variables como el número de ambulancias, llegadas de pacientes, tiempos de espera y carga de trabajo. Los resultados del Arena alimentaron un modelo de regresión para relacionar los tiempos de espera y la cantidad de ambulancias, tomando como referencia el Protocolo de Manchester. La integración de estas técnicas permitió predecir el impacto de diferentes configuraciones de recursos. Los resultados numéricos, basados en datos reales, indicaron una reducción en los tiempos de espera con el aumento de ambulancias, optimizando la distribución de recursos. Así, además de contribuir a la eficiencia operativa de los servicios móviles de emergencia, los resultados fortalecen el desempeño resiliente del Sistema Único de Salud (SUS) frente a las adversidades.
Palabras clave:
Resiliencia de los Sistemas de Salud; SUS; SAMU; Simulación Computacional; Aprendizaje Automático
Introduction
Recently, a growing interest has been in applying Modeling and Simulation (M&S) techniques in health1,2. This field stands out for its high complexity and variety of perspectives addressed, placing modelers before the constant challenge of developing simulation models that capture this complexity systematically and manageably. This trend reflects the search for more comprehensive and integrative approaches, overcoming the limitation of fragmented studies and providing a more holistic understanding of the functioning of these complex systems3. Furthermore, M&S was essential in promoting the resilience of health systems. However, its level of adoption remains relatively low, indicating an area that still requires further exploration. Despite the numerous gains associated with this approach, its implementation is often limited due to its considerable cost, resulting in its underutilization. This perception highlights the need for a more in-depth analysis of the actual financial and operational impacts associated with its incorporation into health systems4.
M&S enables professionals and researchers to simulate medical procedures, understand disease progression, and predict treatment responses without posing risks to real patients. This practice contributes to improving healthcare quality, streamlining practices, reducing costs, and accelerating the development of innovative solutions.
According to Erdemir et al.5, ten rules for reliable M&S practices in health are proposed and developed from a comparative analysis by multidisciplinary members. These rules establish a unified conceptual framework for the design, implementation, evaluation, dissemination or use of M&S: (1) Defining the context clearly; (2) Using contextually appropriate data; (3) Evaluating according to the context; (4) Identifying limitations explicitly; (5) Using a version control; (6) Adequate documentation; (7) Widespread dissemination; (8) Obtaining independent evaluations; (9) Testing competing implementations; and (10) Establishing standards-compliant data. While some of these are common-sense guidelines, many are often missed or misinterpreted, even by experienced practitioners, emphasizing the importance of rigorous practices to ensure health system effectiveness and resilience in applying M&S5.
Thus, Jatobá and Carvalho6 state that the health system’s resilience is the adaptative capacity they must develop daily to adequately meet the sudden increase in pressure on demand caused by extraordinary events while maintaining the functioning, safety, quality, and availability of services. Therefore, resilience is an ability that must be developed continuously, and not only when crises occur, especially in the case of public systems such as the Unified Health System (SUS). Integrating M&S improves crisis prediction and management, increasing the adaptability of health systems.
In Brazil, the basic support Mobile Emergency Care Service (SAMU) units handle 3.3 daily calls (a low number), as many of the mobile resources do not have teams to operate them 24 hours a day or cover vast areas, which results in long journeys7. The Dial 192 telephone number provides access to an emergency and urgency regulation center, where operators answer calls and forward them to a professional with medical training, who identifies the severity, makes an initial diagnosis, and defines the priority and the need to send a mobile resource - a regular ambulance or a mobile Intensive Care Unit (ICU)7.
This article is relevant because it applies M&S and Machine Learning (ML) techniques to assess the efficiency of the ambulance service system in a Brazilian region. It stands out in a context where the lack of specific studies on the SAMU performance in Brazil highlights the importance of research. By examining variables such as the number of ambulances, patient arrival, waiting time, and workload of service teams, the study seeks to provide solid foundations for improving the efficiency of the emergency system. Applying M&S and ML techniques in public health faces several limitations in this context. First, the need for advanced hardware and specialized knowledge can challenge many institutions8. At the same time, the excessive emphasis on computational aspects can make it difficult for decision-makers to interpret the results5. Specifically in public health contexts, the variability of epidemiological data and the reliance on historical data may not adequately capture current or future dynamics, compromising the accuracy of the models9.
In turn, the Alto Tietê region, located in the Metropolitan Region of São Paulo, has 31 ambulances available to serve 1.6 million inhabitants, which totals, on average, one ambulance for every 52 thousand inhabitants. The Ministry of Health states that one ambulance for every 50 thousand inhabitants is recommended10-12, which is outdated in the region. In turn, SAMU in Mogi das Cruzes, part of Alto Tietê, serves a mean of 3,000 people monthly. Furthermore, approximately 40% of calls received by SAMU are not for emergency cases13 and can create unnecessary overload on the system. These factors contribute to long waiting times and suboptimal use of available resources. Therefore, it is vital to analyze how this service can be improved and to conduct preliminary studies so that resources can be correctly allocated, as possible future acquisitions of ambulances can be made. From this perspective, Mogi das Cruzes was chosen as the study site due to its high demand for SAMU services and the availability of detailed information about the service. These factors provide rich and varied data, essential for M&S, allowing for detailed analysis and the proposal of solutions to streamline the service and improve care for the population.
Arena software is widely used for M&S of discrete systems (which is identified in the problem analyzed in this article) and is a global leader in medical simulation solutions. It is currently used in hundreds of hospitals in more than 20 different countries14.
In this context, this article aims to simulate the SAMU ambulance service system in Mogi das Cruzes, São Paulo, using Arena software and ML techniques to analyze and streamline the system’s performance, thus contributing to SUS resilience and efficiency.
This study was divided into six sections: the first, referring to the introduction, describes the research objectives; section 2 presents the literature review; section 3 describes the problem; section 4 presents the methodology; section 5 denotes the results achieved; and finally, section 6 concludes the research.
Literature review
A literature review aims to take a comprehensive approach to identifying, evaluating, and interpreting all relevant and available research associated with a specific research question, a given thematic area, or a designated event of interest15.
International studies show the positive impact of ML in health systems, providing a solid theoretical basis for the implementation of these technologies in Brazil. In this context, Lee et al.16 reviewed ML models to predict unscheduled returns to emergency departments, highlighting the effectiveness of these approaches in improving the quality of care, reducing waiting times, and decreasing health costs. The study showed that, when analyzing demographic and clinical variables, ML models can predict with some accuracy the probability of unscheduled returns. Additionally, Syrowatka et al.17 identified six main use cases of ML in pandemic preparedness and response, such as predicting infectious disease dynamics, surveillance and detection of outbreaks, and disease prognosis, showing how these tools can improve clinical decision-making and streamline resources in health emergencies. Neira-Rodado et al.18 analyzed the dynamic allocation of ambulances, highlighting the importance of ML in streamlining resources during epidemic outbreaks, such as SARS and COVID-19, and highlighting the evolution of methodologies to address dynamic problems in allocating emergency services. Finally, Raita et al.19 developed and compared ML models to predict critical outcomes and hospitalizations in emergency departments, showing that these models outperformed traditional approaches, which consequently promotes improved triage, prediction of clinical outcomes, and streamlined resource use. These studies exemplify how ML can predict emergency demands, streamline resources, and improve clinical decision-making, aligning with the need to strengthen the Brazilian health system’s resilience.
The M&S of the SAMU service is the foundation of this article, and ML analysis is a secondary focus, which served as a basis for validating the modeling performed, as will be seen throughout the work. Therefore, in order to find publications related to the use of M&S in the ambulance dispatch service, scientific articles from journals and conferences related to the 2019-2024 period were analyzed in the Scopus and IEEE databases, with the following search string: (“Modeling and Simulation” OR “M&S” OR “Simulation Modeling” OR “Computational Simulation”) AND (“Ambulance” OR “Ambulance Services” OR “Ambulance Systems”).
In total, six related works were found, namely: Yang et al.20 proposed a simulation-based streamlining method for ambulance allocation, building a model to mimic the operational processes of an emergency medical services system and evaluate performance in an uncertain environment; Sebestyénová and Kurdel21 used the Tecnomatix Plant Simulation software to model ambulance logistics, demonstrating how discrete event simulation can be applied to manage single-rail networks with ambulances; Kong et al.22 used M&S for real-time ambulance dispatching using reallocation decisions; Liu et al.23 developed an analytical framework using M&S techniques for emergency resource allocation in response to demand disruption during the COVID-19 pandemic; Maas et al.24 used simulation to estimate time savings and clinical impact of the drive-the-doctor model for streamlining acute stroke services in rural areas; and finally, Arul et al.25 proposed an image processing-based innovative traffic signal system to identify emergency vehicles and automatically adjust traffic signals, showing efficiency in reducing waiting time for ambulances. However, when analyzing the M&S applications, we identified a gap: the lack of studies dedicated to ambulances in the Brazilian context and, consequently, SAMU. This lack of research motivated the choice of the present work, which aims to fill this gap by addressing this topic, offering a perspective for the Brazilian context that aims to advance knowledge in this area.
Describing the problem
SAMU aims to quickly assist victims in urgent or emergencies to prevent distress, sequelae, or death. Integrated into the National Emergency Care Policy, which prioritizes SUS principles, SAMU promotes regionalized and hierarchical care networks to ensure universality, equity, and comprehensiveness of care. Its teams comprise doctors, nurses, nursing assistants, and drivers and assist in homes, workplaces, and public roads26.
According to Naseer et al.27, applying M&S techniques in health increases service provision. In this context, the Arena software is a modeling and simulation system based on hierarchical concepts, allowing users to create blocks to represent the model studied. Therefore, because it is intuitive software that allows modeling and simulating SAMU services efficiently and effectively, Arena was chosen to solve the current problem.
Also, Figure 1 presents a CATWOE analysis, a widely recognized framework for analyzing problems in systems and processes. This method derives from the Soft Systems Methodology (SSM)28 and is applied to address complex and unstructured organizational challenges. This approach seeks a holistic understanding of the system in question, identifying key elements such as the stakeholders involved, the necessary transformation processes, and the challenges and restrictions that permeate the situation discussed. This tool provides a comprehensive view that contributes to the structuring and deeper understanding of the problem, allowing for a more precise and effective analysis in the search for solutions.
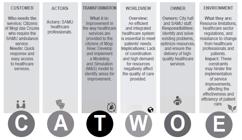
Resilient health systems are therefore needed to withstand shocks, such as natural disasters and health crises, without compromising essential services. Strategies to improve resilience include strengthening governance, improving surveillance and response capacities, and investing in health infrastructure, ensuring the continued health of populations in adverse situations29. Thus, this article contributes to this resilience by streamlining the allocation of SAMU resources and better understanding the emergency service, improving infrastructure and response capacity in emergencies.
Methods
Per the classification proposed by Creswell and Creswell30, this article combined mathematical modeling and case study, and its methodology was characterized as quantitative31. The present study exemplifies the integration of M&S and ML in the Brazilian health system by using the data generated by the simulation to inform a regression model, analyzing the relationship between waiting time and the number of ambulances available in the system.
Furthermore, actual information that will serve as a basis for future inferences is essential to building predictive models. Historical patient data, emergency care records, and demographic information are vital to training these models. As Glans et al.32 discussed, collecting detailed data on patient characteristics and events during hospitalization is crucial. Developing predictive models involves creating settings that can predict and manage public health crises, using this information to identify patterns and areas for improvement in emergency care.
This section addressed the characteristics of the real system chosen. It highlighted the most relevant ones for the modeling performed, in addition to the entities, resources, simulation time, rounds, limitations, and blocks of the proposed system. The modeling aims to analyze and streamline the system’s performance, considering variables such as the number of ambulances, patient arrivals, waiting times, and average service time, in addition to the medical teams’ workload.
Arena is an effective tool in various contexts, covering manufacturing, transportation, logistics, storage, queues, and business processing33. This software also has specific functionalities that expand its usefulness, such as the input analyzer, designed to provide users with the ability to interpret raw input data; and the output analyzer incorporated into the software, offering essential resources for the visualizing and analyzing data resulting from simulations. These features make Arena a versatile and comprehensive tool for modeling and simulating complex systems in several sectors33. Resilient practices include developing contingency plans, diversifying resources, and promoting a flexible and responsive organizational culture34. In other words, the situational understanding provided by Arena is essential for optimally managing potential bottlenecks. Figure 2 shows the Arena software blocks used to represent the problem assertively.

SAMU in Mogi das Cruzes faces challenges due to high demand and limited resources, which justifies the need for this study. An average of 3,000 people are served monthly in the city, using 18 ambulances available for care10,35,36. These data were collected from the Ministry of Health and local health sources and are the most recent available and refer to 2019, enabling the construction of a simulation model that reflects the operational reality of SAMU in Mogi das Cruzes. The data were entered directly into the Arena software, with the parameters iteratively adjusted based on the reports generated, evaluating performance by waiting time and team utilization as the number of ambulances was changed.
Chart blocks
-
Patient arrival: This “create” block represents the arrival of patients for ambulance use. In Mogi das Cruzes, 3,000 people are treated on average every month10,35,36. The system was modeled to represent the actual information that 3,000 people are treated, with the rest not being treated for reasons that do not interfere with the analysis or the results;
-
Separates actual cases: This study establishes a clear distinction between actual cases and non-services, using a “decide” block to represent the percentage of ambulance requests filtered after an initial assessment. For this model, based on actual data, 32% of calls result in non-services. This category includes prank calls and situations in which, after analysis, it is not justified to send an emergency unit10,13,35,36. With this, the system was modeled to represent the actual information that 3,000 people are served, with the rest not being served for reasons that do not affect the results;
-
Non-services: “dispose” block created to collect cases that did not require sending an ambulance;
-
Ambulance transport service: the “create” block represents the ambulance service itself, counting the 18 ambulances to serve the population10,35. The basic and advanced support teams were considered in this block to simplify the process;
-
Record 1: block created to record the time between each service and the number of services; and
-
Dispose 1: arrival block of ambulances that performed services.
Entities, resources, simulation time, rounds, and limitations
-
Entities: The system is represented by an entity (patient), which represents the patients who arrive at the system. The Poisson expression with a mean of 0.16 was adopted to generate information consistent with the collected data, which will simulate the arrival of 4,500 patients on average. After identifying occurrences, the cases that really require care will be transferred to the respective care units by ambulances, resulting in an average of 3,000 attendances;
-
Resources: There is a resource in the simulation, represented by the Ambulance Team, which comprises the driver and the health team; that is, this resource encompasses all the solutions necessary to care for patients. The Poisson distribution was employed to change the number of ambulances in the simulation, which is frequently used to model the arrival of patients in health systems37. The total number of patients considered was the historical average of 3,000 monthly attendances, with a time of 720 (1 month) hours and the number of ambulances represented by the variation of 20 to 25 vehicles;
-
Simulation time: 720 hours, equivalent to 30 days, in order to obtain the monthly parameters, considering the 24-hour service period of SAMU26; and
-
Rounds: Per the limitations of the software version used, 30 or 100 rounds were made for each change in the parameter of the number of ambulances in the system.
Results and discussion
The Arena software simulation produced quantitative data that allowed an analysis of the ambulance system’s performance in several allocation scenarios. Table 1 summarizes the results, showing that the mean number of patients treated remained consistently around 3,050, aligned with the study’s expectations. The confidence level set at 95% reinforces the estimates’ accuracy and, therefore, the validity of the conclusions derived from the results.
The data reveal an inverse correlation between the number of ambulances and the variability of waiting times. As the number of ambulances increased from 20 to 25, the standard deviation of waiting times gradually reduced from 1.35 to 0.37 hours. Analysis of the standard deviation of waiting times reveals the reliability of the simulation’s estimates. The standard deviation is higher with fewer ambulances, indicating more significant variability in waiting times and a system operating close to maximum capacity. As the number of rounds and ambulances increases, the standard deviation decreases, validating the reliability of the results and suggesting that waiting times can be streamlined through operational adjustments. Variability in waiting times is an inherent characteristic of emergency services due to the unpredictable and variable nature of calls, which can swing significantly in number and severity over time. We should also note that simulations limited to 30 rounds due to restrictions of the Arena software version used also revealed consistent results, which supports the reliability of the interpretations.
Shorter waiting times improve patient satisfaction by reducing anxiety and discomfort. This is crucial from a humanitarian perspective and for building trust in the public health system. It also relieves the pressure on hospital resources, as patients who are seen quickly are less likely to require prolonged intensive care. This allows for better resource allocation, which makes treatment more efficient for more patients. The chances of rapid and effective interventions increase with shorter waiting times.
Furthermore, Figure 3 analyses the relationship between the number of ambulances available, the waiting time in hours, and the efficiency of using emergency teams. The mean waiting time decreases by increasing the fleet from 20 to 25 ambulances, showing improved service efficiency. Although it may seem obvious, the increased resource is not, especially when the cost and idleness variables can be added. In this specific case, the increase of 25%, i.e., five ambulances, carries a mathematical basis, and its efficiency is proven based on the simulation in Figure 2.

At the same time, we identify a decreased team utilization rate, indicating that the expanded fleet allows for a more efficient distribution of emergency incidents among the available teams. This workload relief allows teams to operate more efficiently and with less stress, reducing the chances of fatigue and burnout. With lower utilization, ambulance teams can focus instead on the quality of care provided rather than just dealing with the number of calls. This can lead to improved patient satisfaction and overall quality of healthcare services.
Numerical modeling of the addition of ambulances, as shown in Figure 3, allows for an accurate analysis of the operational impact. The graph shows that the most significant reduction in waiting time occurs when the number of ambulances increases from 20 to 23. The reduction still exists after that but is less pronounced. By identifying the point at which adding ambulances continues to reduce wait times and crew utilization significantly, managers can make informed decisions about resource investments. This type of modeling also helps predict the marginal efficiency of adding each new ambulance, allowing for more efficient, data-driven resource allocation. While adding ambulances clearly improves wait times and crew utilization, one should consider the cost and sustainability of such an expansion.
Validation
We used the Manchester Protocol adopted by the SUS to validate the study. It classifies patients into five colors, defining care priorities by severity. This protocol streamlines resources and establishes maximum times for care: immediate for “Emergency”, up to 10 minutes for “Very urgent”, 1 hour for “Urgent”, 2 hours for “Slightly urgent”, and up to 4 hours for “Non-urgent”38.
This study employed linear and nonlinear regression ML techniques to assist in the validation process, which allows quantifying the relationship between the number of ambulances available and patient waiting time.
The simulation results show that increasing the number of ambulances reduces patient waiting times, with a more significant impact in “Emergency” and “Very Urgent” cases, where minutes are crucial. Figure 4, analyzed with linear and nonlinear regressions39, shows a negative correlation, highlighting that the first increases in the number of ambulances generate significant reductions. At the same time, subsequent gains are negligible, suggesting a balance point for streamlining resources and maximizing service efficiency.

Source: Authors.
Based on this information, equation (1) provides the second-degree curve of the nonlinear regression with R² equivalent to 0.98 (the linear model obtained R² of 0.91):
The coefficient of 0.0727 models the relationship’s non-linearity, reflecting the diminishing return principle. Initially, adding ambulances significantly reduces waiting times, but the marginal impact of each new ambulance progressively decreases, indicating that, after a certain point, the additional benefits become increasingly smaller. The linear coefficient of -3.6988 represents the direct reduction in waiting times per added ambulance, and is more significant at the beginning before the system is saturated. The constant value of 48.69 defines the theoretical waiting time in the absence of ambulances, serving as an initial reference for the analysis and evidencing the impact of introducing resources into the system.
In summary, mathematical modeling provides a predictive basis for streamlining resources and improving system efficiency by elucidating the nonlinear relationship between resources and outcomes. The equation supports strategic decisions to improve the quality and response of emergency services, highlighting the practical application of advanced techniques in critical health.
Limitations
Although efforts were made to collect as much data as possible, the model has some limitations. As a prototype, it lacks detailed data, such as mean response times, ambulance deployments, and demand variations throughout the day, which could improve the simulation’s accuracy. Future research can overcome these limitations with more comprehensive data and collaboration with SAMU teams to provide specific information on each care stage.
Furthermore, using the Student version of the Arena software imposed restrictions, such as the limit of 150 simultaneous entities and the impossibility of testing scenarios with less than 20 ambulances or running more complex simulations. Despite these limitations, the results were not compromised since this article aimed to show the method’s applicability as a prototype for future investigations.
Conclusion
This study explored the efficiency of a SUS ambulance service system, specifically SAMU, to achieve its objective through an integrated M&S and ML methodology. By focusing on key variables such as the number of ambulances, patient arrivals, waiting times, and average number of calls, we deciphered the operational complexity inherent to the service. The monthly SAMU simulation was quantified with ML techniques, showing areas for improvement and enhancements in the case at hand.
The findings show that a 25% increase in the ambulance fleet reduces waiting times and streamlines resource allocation, resulting in greater efficiency and reduced workload per team. The analysis also revealed the system’s operational stability, with a low standard deviation in the metrics evaluated. Applying the regression validated the model, confirming its accuracy in representing the operational reality of SAMU and providing a solid quantitative basis for supporting strategic decisions. This approach directly contributes to improving emergency services and strengthening SUS resilience.
Finally, the proposed methodology can be adapted to other regions, providing adequate data for simulation. This potential reinforces the approach’s relevance in managing emergency services in Brazil and globally. Future research can expand the scope to include different contexts, considering local variables such as population density, topography, road infrastructure, and economic impact analyses to ensure the financial sustainability of interventions. Thus, the study strengthens SUS resilience and improves emergency services efficiently and sustainably.
References
- 1 White KP. A survey of data resources for simulating patient flows in healthcare delivery systems. In: Proceedings of the Winter Simulation Conference. IEEE; 2005.
- 2 Barjis J. Potentials and challenges of healthcare modeling and simulation. In: Summer Computer Simulation Conference, Part of the 2009 International Summer Simulation Multiconference; 2009. p. 173-176.
- 3 Djitog I, Aliyu HO, Traoré MK. A model-driven framework for multi-paradigm modeling and holistic simulation of healthcare systems. Simulation 2018; 94(3):235-257.
- 4 Soorapanth S, Eldabi T, Young T. Towards a framework for evaluating the costs and benefits of simulation modelling in healthcare. J Operat Res Soc 2023; 74(3):637-646.
- 5 Erdemir A, Mulugeta L, Ku JP, Drach A, Horner M, Morrison TM, Peng GCY, Vadigepalli R, Lytton WW, Myers Jr. JG. Credible practice of modeling and simulation in healthcare: Ten rules from a multidisciplinary perspective. J Translat Med 2020; 18:369.
- 6 Jatobá A, Carvalho PVR. Resiliência em saúde pública: preceitos, conceitos, desafios e perspectivas. Saude Debate 2023; 46:130-139.
-
7 Brasil. Ministério da Saúde (MS). Ambulâncias do Samu alcançam 85% da população, mas atendimento é desigual [Internet]. 2023 [acessado 2023 nov 15]. Disponível em: https://bvsms.saude.gov.br/ambulancias-do-samu-alcancam-85-da-populacao-mas-atendimento-e-desigual/.
» https://bvsms.saude.gov.br/ambulancias-do-samu-alcancam-85-da-populacao-mas-atendimento-e-desigual - 8 Kretzschmar M. Disease modeling for public health: added value, challenges, and institutional constraints. J Public Health Policy 2020; 41(1):39.
- 9 Fischer LS. CDC grand rounds: modeling and public health decision-making. MMWR Morb Mortal Wkly Rep 2016; 65(48):1374-1377.
-
10 Diário. Samu tem 31 ambulâncias para atender 1,6 milhão de habitantes no Alto Tietê [Internet]. 2019 [cited 2023 Nov 19]. Disponível em: https://www.diariodesuzano.com.br/cidades/samu-tem-31-ambulancias-para-atender-16-milhao/46415/.
» https://www.diariodesuzano.com.br/cidades/samu-tem-31-ambulancias-para-atender-16-milhao/46415 -
11 FAMURS. Municípios podem solicitar veículos e ambulâncias ao ministério da Saúde [Internet]. 2017 [acessado 2024 aug 1]. Disponível em: https://famurs.com.br/noticia/1553
» https://famurs.com.br/noticia/1553 -
12 Brasil. Ministério da Saúde (MS). Ministério da Saúde entrega 458 novas ambulâncias do SAMU 192 e antecipa renovação de frota de 2020 [Internet]. 2022 [acessado 2024 aug 1]. Disponível em: https://www.gov.br/saude/pt-br/assuntos/noticias/2019/dezembro/ministerio-da-saude-entrega-458-novas-ambulancias-do -samu-192-e- antecipa-renovacao-de-frota-de-2020
» https://www.gov.br/saude/pt-br/assuntos/noticias/2019/dezembro/ministerio-da-saude-entrega-458-novas-ambulancias-do -samu-192-e- antecipa-renovacao-de-frota-de-2020 -
13 Secretaria de Estado da Saúde. SAMU: cerca de 40% das chamadas não são para casos de urgência [Internet]. 2017 [acessado 2024 jan 30]. Disponível em: https://saude.se.gov.br/samu-cerca-de-40-das-chamadas-nao-sao-para-casos-de-urgencia/.
» https://saude.se.gov.br/samu-cerca-de-40-das-chamadas-nao-sao-para-casos-de-urgencia -
14 Rockwell Automation. Arena Simulation Software in Healthcare [Internet]. 2024 [acessado 2024 aug 1]. Disponível em: https://www.rockwellautomation.com/es-mx/products/software/arena-simulation/discrete-event-modeling/healthcare.html
» https://www.rockwellautomation.com/es-mx/products/software/arena-simulation/discrete-event-modeling/healthcare.html - 15 Kitchenham B. Procedures for performing systematic reviews. Keele 2004; 33(2004):1-26.
- 16 Lee YC, Ng CJ, Hsu CC, Cheng CW, Chen SY. Machine learning models for predicting unscheduled return visits to an emergency department: a scoping review. BMC Emergency Medicine 2024; 24(1):20.
- 17 Syrowatka A, Kuznetsova M, Alsubai A, Beckman AL, Bain PA, Craig KJT, Hu J, Jackson GP, Rhee K, Bates DW. Leveraging artificial intelligence for pandemic preparedness and response: a scoping review to identify key use cases. NPJ Digit Med 2021; 4(1):96.
- 18 Neira-Rodado D, Escobar-Velasquez JW, McClean S. Ambulances deployment problems: categorization, evolution and dynamic problems review. ISPRS Int J Geo Informat 2022; 11(2):109.
- 19 Raita Y, Goto T, Faridi MK, Brown DFM, Camargo CA, Hasegawa K. Emergency department triage prediction of clinical outcomes using machine learning models. Critical Care 2019; 23:1-13.
- 20 W, Su Q, Huang SH, Wang Q, Zhu Y, Zhou M. Simulation modeling and optimization for ambulance allocation considering spatiotemporal stochastic demand. J Manag Sci Eng 2019; 4(4):252-265.
- 21 Sebestyénová J, Kurdel P. Ambulance car logistics using shortest path achievement tree in plant simulation. In: CHIRA 2019 - Proceedings of the 3rd International Conference on Computer-Human Interaction Research and Applications. 2019. p. 214-220.
- 22 Kong N, Paz JC, Gao X. EMS Operations Management: Simulation, Optimization, and New Service Models. In: Proceedings - Winter Simulation Conference. 2022. p. 222-237.
- 23 Liu J, Ouyang R, Chou CA, Griffin J. An Analytical Approach for Dispatch Operations of Emergency Medical Services: A Case Study of COVID-19. Operations Res Forum 2023; 4:2.
- 24 Maas WJ, van der Zee DJ, Lahr MMH, Bouma M, Buskens E, Uyttenboogaart M. 'Drive the doctor' for endovascular thrombectomy in a rural area: a simulation study. BMC Health Serv Res 2023; 23(1):778.
- 25 Arul SJ, Mithilesh BS, Shreyas L, Sufiyan, Kaliyaperumal G, Jayasheel Kumar KA. Modelling and Simulation of Smart Traffic Light System for Emergency Vehicle using Image Processing Techniques. In: Proceedings of 2023 3rd International Conference on Innovative Practices in Technology and Management, ICIPTM 2023. 2023.
-
26 Brasil. Ministério da Saúde (MS). Serviço de Atendimento Móvel de Urgência [Internet]. 2024 [acessado 2023 nov 10]. Disponível em: https://www.gov.br/saude/pt-br/assuntos/saude-de-a-a-z/s/samu-192
» https://www.gov.br/saude/pt-br/assuntos/saude-de-a-a-z/s/samu-192 - 27 Naseer A, Eldabi T, Jahangirian M, Stergioulas L. Potential applications of simulation modelling techniques in healthcare: Lessons learned from aerospace & military. In: Proceedings of the European and Mediterranean Conference on Information Systems, EMCIS 2008. 2008.
- 28 Checkland P. Systems thinking, systems practice. New York: John Wiley & Sons; 1981.
- 29 Jatobá A, Nunes PC, Carvalho PVR. A framework to assess potential health system resilience using fuzzy logic. Rev Panam Salud Publica 2023; 47:e73.
- 30 Creswell JW, Creswell JD. Research design: Qualitative, quantitative, and mixed methods approaches. London: Sage publications; 2017.
- 31 Bertrand JWM, Fransoo JC. Operations management research methodologies using quantitative modeling. Int J Operat Production Manag 2002; 22(2):241-264.
- 32 Glans M, Kragh Ekstam A, Jakobsson U, Bondesson Å, Midlöv P. Risk factors for hospital readmission in older adults within 30 days of discharge-a comparative retrospective study. BMC Geriatrics 2020; 20:1-12.
- 33 Kelton WD, Sadowski RP, Sadowski DA. Simulation with ARENA. Nova York: McGraw-Hill, Inc.; 2002.
- 34 Carvalho PVR, Bellas H, Viana J, Nunes PC, Arcuri R, Fonseca VS, Carneiro APM, Jatobá A. Transformative dimensions of resilience and brittleness during health systems' collapse: a case study in Brazil using the Functional Resonance Analysis Method. BMC Health Serv Res 2023; 23(1):349.
-
35 Brasil. Ministério da Saúde (MS). [Internet]. 2023 [acessado 2023 nov 20]. Disponível em: https://www.gov.br/saude/pt-br
» https://www.gov.br/saude/pt-br -
36 COREN. Samu registra cerca de 6 mil trotes no mês de julho deste ano [Internet]. 2019 [acessado 2023 nov 15]. Disponível em: http://www.corenpa.org.br/samu-registra-cerca-de-6-mil-trotes-no-mes-de-julho-deste-ano_7348.html
» http://www.corenpa.org.br/samu-registra-cerca-de-6-mil-trotes-no-mes-de-julho-deste-ano_7348.html - 37 Garcia-Vicuña D, López-Cheda A, Jácome MA, Mallor F. Estimation of patient flow in hospitals using up-to-date data. Application to bed demand prediction during pandemic waves. PLoS One 2023; 18(2):e0282331.
- 38 Souza CC, Toledo AD, Tadeu LFR, Chianca TCM. Risk classification in an emergency room: agreement level between a Brazilian institutional and the Manchester Protocol. Rev Lat Am Enferm 2011; 19:26-33.
- 39 Fávero LP, Belfiore P. Manual de análise de dados: estatística e modelagem multivariada com Excel(r), SPSS(r) e Stata(r). Elsevier Brasil; 2017.

 Source: Authors
 Source: Authors
 Source: Authors.
