
 Milk Price Variation on the Economic Performance of Dairy Farms in Minas Gerais
Abstract
Milk price volatility is among the several risk types livestock farms are exposed to, since it stands out for its significant impact on these businesses’ economic performance. The aims of the present research are to investigate how product price (milk) variations influence economic performance, as well as suggest an indicator to analyze risks posed to livestock farms in Minas Gerais State, Brazil. The Monte Carlo Simulation was applied to carry out 10.000 simulations of possible milk prices in 485 livestock farms in Minas Gerais State, based on variations observed in this state, from 2015 to 2021. Farms accounting for the lowest production costs were the ones presenting the highest tolerance to milk price variations. Thus, farms showing the best efficiency and profitability suffered with the lowest risks posed by milk price variation. The herein suggest indicators, known as Price Balance and Milk Price Tolerance, allowed measuring these farms’ capacity to support milk price reductions.
Keywords:
Efficiency; Risk; Dairy farming; Market prices; Monte Carlo method
Resumo
A volatilidade do preço do leite está entre os diversos tipos de risco aos quais as propriedades leiteiras estão expostas, pois se destaca pelo impacto significativo no desempenho econômico desses negócios. Objetivou-se investigar como as variações do preço do leite influenciam o desempenho econômico, bem como sugerir dois indicadores para análises dos riscos em propriedades leiteiras. Utilizou-se a Simulação de Monte Carlo para realizar 10.000 simulações de preços possíveis do leite em 485 propriedades leiteiras localizadas no estado de Minas Gerais. As propriedades com os menores custos de produção foram as que apresentaram as maiores tolerâncias às variações do preço do leite. Aquelas que apresentaram maior eficiência econômica e sofreram os menores riscos decorrentes da variação do preço do leite. Os indicadores aqui sugeridos, denominados Preço de Equilíbrio e Índice de Tolerância do Preço Leite (ITPL), permitiram medir a capacidade dessas propriedades em suportar a redução do preço do leite.
Palavras-chave:
Eficiência; Risco; Pecuária leiteira; Preços de mercado; Método Monte Carlo
1 Introduction
Minas Gerais stands out in the Brazilian agricultural and livestock sectors as the largest milk producing state in the country, as well as for contributing to wealth, income generation, and distribution processes (Bassotto et al., 2022). According to the Brazilian Institute of Geography and Statistics (IBGE), Milk production in Minas Gerais State accounts for approximately 9.6 billion liters in 2022 (Instituto Brasileiro de Geografia e Estatística - IBGE, 2023), i.e., for 27.22% of the national production in that year. According to data provided by the Center for Advanced Studies in Applied Economics (CEPEA - Centro de Estudos Avançados em Economia Aplicada), at Esalq University/USP, milk prices in Brazil are strongly influenced by the milk price in Minas Gerais, which recorded significant variation from 2004 to 2023-milk price reached mean value of R$2.74/liter in 2022; it ranged from R$2.18 to R$3.61 (CEPEA, 2023).
Some factors influence the agro sector, given the current dairy farming context; among them, it is possible to highlight milk price, which exposes dairy livestock properties to risks set by the market-these conditions are not in the hands of decision-makers to control. According to Schulte et al. (2018), the high volatility of milk price has impacts on dairy farms, and it worsens the risks posed to them. Risk is the possibility of having outcomes different from the expected due to uncertain environments; in other words, when one does not know what to expect (Buainain & Silveira, 2017). Accordingly, milk price variation, or volatility (Frick & Sauer, 2020) in prices practiced for dairy products’ trading, are caused by market uncertainty, a fact that impairs the management of agricultural production processes, such as dairy livestock (Costa et al., 2020).
Variations in milk price can also influence the economic performance of these properties, due to income reduction at the time farmers sell their production (Lopes et al., 2019; Ferrazza et al., 2020; Bassotto et al., 2022). Mirza et al. (2020) point out that properties selling milk for lower prices suffer with deterioration of their financial liquidity. Based on Frick and Sauer (2020), this process leads to reduced economic performance in dairy farms, which are forced to seek financing in order to fulfil their financial obligations, a fact that increases the risk posed to their business activity.
Besides the risks, dairy production process efficiency also has significant influence on the development of such a process. Based on the literature, dairy farms must be efficient in order to optimize their economic outcomes (Evink & Endres, 2017). However, only few studies have focused on the discussion about the association between efficiency and risks in dairy livestock (Gebreegziabher & Tadesse, 2014; Bassotto et al., 2022). Similarly, there is research approaching the milk price volatility issue and its impact on dairy farms (Mirza et al., 2020; Guo et al., 2020); however, we did not find any research in the literature focused on investigating how such volatility influences the economic performance of dairy farms and how the association between efficiency and risk takes place in this sector.
Accordingly, the relevance of the present study is justified by the way milk price volatility can influence the economic performance of dairy properties. Thus, the following research question has emerged: how can milk price volatility have an impact on the economic performance of dairy properties in Minas Gerais State? The aims of the current study are to investigate how variations in goods’ prices (in this case, milk) can have impact on economic performance, as well as to suggest an indicator to analyze the risks faced by dairy properties in Minas Gerais State.
The Monte Carlo Simulation technique was herein adopted due to the important role it plays in stochastic studies associated with price variability (Nouri & Abbasi, 2017), mainly in dairy farming (Hyde & Engel, 2002). Based on stochastic analysis applied to 10,000 iterations in 485 dairy properties in Minas Gerais State, results in the current study corroborate the important role played by prices in dairy farms, since they require higher efficiency and lower risks to achieve better economic performance. Results found in the current study support the idea that increased operational efficiency in dairy farms helps to decrease their dependence on market prices, in order to become profitable. This condition reduces the risks of having volatile milk prices in the market. The Milk Price Tolerance Index (MPTI), which indicates to producers the likely milk price reduction rates capable of turning the dairy activity profit equal to zero, was herein proposed. This indicator can be a valuable instrument to help decision-makers to analyze the vulnerability of the milk business, in cases showing strong dependence on market prices in order to become profitable.
2 Theoretical Background
Although the international milk market is more competitive (and more limited) than the domestic one, Brazil still does not stand out in milk exports, which decreases the attractiveness of this business in the domestic market and impairs the development of its milk production chain (Vilela et al., 2016). Consequently, dairy farms tend to become more vulnerable, since the increase in national milk production reduces dairy sales prices and leaves such an activity more exposed to the law of supply and demand. These consequences can significantly affect the milk business, since they leave producers more exposed to market fluctuations (Bassotto et al., 2022).
States that largely produce milk tend to be the ones mostly exposed to market-related adverse events, which are capable of limiting milk production chain expansion. Minas Gerais, which is the largest milk producing state in Brazil (Perobelli et al., 2018), accounts for the production of approximately 6.5 billion liters of milk on a yearly basis, or for 25.5% of all the national milk production-approximately 25.5 billion liters (Instituto Brasileiro de Geografia e Estatística - IBGE, 2020a). Minas Gerais is among the states highly exposed to these adverse events, and it can substantially affect its economic and social development. The number of dairy farms in Minas Gerais turns it into one of the most important states in the country, since it accounts for the largest number of milk producing units (216,460 dairy farms). This total corresponds to 18.0% of the total number of units in the country (1,176,295 dairy farms) (Instituto Brasileiro de Geografia e Estatística - IBGE, 2017; 2020b). Therefore, studies on milk prices can significantly contribute to dairy activity growth and development in Minas Gerais State.
Alves et al. (2014) analyzed milk price from 2000 to 2014 in Minas Gerais and found that the dairy market in this state is volatile and influenced by the international market. Costa et al. (2020) corroborated the herein introduced understanding, but they also warned that most of such milk price volatility is caused by the domestic market (from the state itself). According to these authors, this process has a strong effect on the national market, since Minas Gerais accounts for forming the milk price which is paid to dairy producers in Brazil-it influences the other states and, consequently, the risks arising from the volatility observed in dairy farms.
Based on the definition by Buainain and Silveira (2017), risk is the possibility of outcomes to be different from expected due to the influence of uncontrollable factors; accordingly, dairy farms are exposed to different risks. Guo et al. (2020) emphasized that high risks decrease production process stability and expose organizations to higher uncertainty levels. Thus, it is essential to understand how risks have impacts on dairy farms.
Risks can also result from management processes-and this is a core concern. Lopes et al. (2016) suggested using different management tools to boost managerial development in dairy farms. They have emphasized the need of having an efficient management process to enable dairy farms to reach satisfactory outcomes. Thus, management in dairy farms is the very condition that, once inefficient, will put the activity at risk. According to Mirza et al. (2020), managerial inefficiency can compromise these farms’ liquidity and impair more promising future perspectives.
Gebreegziabher and Tadesse (2014) warned about the great possibility of damages caused by operational risks to the dairy activity due to food shortage for animals, diseases, low-quality milk issues, artificial insemination inefficiency, and animals not suitable for dairy production. They also pointed out the use of necessary inputs for dairy production as another factor influencing it. Ferrazza et al. (2020) reinforced the importance of adopting inputs such as food, energy, maintenance, salubrity, and artificial insemination in dairy farms. The efficient use of such inputs helps maximizing dairy production profitability (Lopes et al., 2019). Therefore, it is essential to pay close attention to them, since their inefficient use can increase risks faced by the dairy livestock sector. Ogachi et al. (2020) highlight that operational risks have impacts on the likelihood of production process flaws.
Subjects related to inputs trading and production are also seen as market risks. The dairy production chain is quite a weak structure that faces high transaction costs. Buainain and Silveira (2017) state that rural farms’ high complexity, such as that of dairy livestock, help increasing production chain risks. Such a condition also influences several national livestock segments since dairy livestock is interrelated with many economic sectors.
Milk prices in the market use to expose dairy farms to high risks. Schulte et al. (2018) point out that the highest risk to dairy production is not linked to milk market value itself, but to milk price variations over time. They also found that this pricing process exposes dairy farms to significant risks to their permanence in the market. Mirza et al. (2020) emphasize that milk prices dropping is a serious issue for dairy production, given the financial instability generated by it-this process increases business risks due to the possibility of further losses resulting from reduced income.
Furthermore, milk price declines influence profitability. Frick and Sauer (2020) have shown that milk price volatility compromises profitability and reduces the liquidity of dairy farms, as well as exposes them to higher risks. The volatility issue is consensus in the literature, since it is seen as a core problem for dairy production (Schulte et al., 2018; Frick & Sauer, 2020).
3 Methodology
The assessed data were provided by 485 dairy farms located in Minas Gerais, they joined the Educampo technical and managerial assistance program offered by Sebrae Minas. Monte Carlo Simulation (MCS) was used to generate random values to identify the acceptable tolerable milk price fluctuation in the market in order to keep dairy production feasible. According to Shamblin and Stevens (1979), after formulating the deterministic model one shall take the following steps: (i) distributing the possibilities better representing the gathered data; (ii) creating the accumulated distribution function (ADF) for every variable to be analyzed; (iii) establishing the amount of class labels or intervals; (iv) generating random values; and (v) performing the simulation with the assessed data.
The first step concerned developing the deterministic model when the input variables (costs) are known. After having the input variables, one must calculate the output variables (profitability), since it will allow analyzing profitability variation based on sales price fluctuation. Production costs and the economic performance of the analyzed farms were analyzed in Microsoft Excel® spreadsheet, based on the Operational Costs methodology (Matsunaga et al., 1976). Total operational cost (TOC) was calculated by summing the expenditures to family manpower remuneration and depreciations (Ferrazza et al., 2020). The difference between total income (milk selling, animals, and byproducts) and TOC is given by the net margin (Matsunaga et al., 1976), which is used to calculate the profitability of this activity, as recommended by Ferrazza et al. (2020). Chart 1 presents the equations used in the deterministic model.
The involved input and output variables were defined based on data to be analyzed (Shamblin & Stevens, 1979). Milk price for trading was adopted as the only risky input variable. An option was made for only working with one variable so that the cost structure in the assessed farms could be preserved and kept without any changes that could, at some point, influence the outcomes. Besides, when only one variable is used, farms’ economic performance would fluctuate only due to milk’s trading price.
The second step, recommended by Shamblin and Stevens (1979), lies on defining the distribution function that would best capture price fluctuation. A search in the literature was carried out to assess what would be the most appropriate distribution. This process allowed adopting the variables to analyze behaviors linked to inflation and market fluctuations. Furthermore, based on the present research, it is important to use a uniform distribution curve to define that any value within a given interval must likely happen (Nouri & Abbasi, 2017).
The next step lied on defining the lower and upper limits for the input variable (milk price), the so-called class ranges, which are used as reference to generate random values (Shamblin & Stevens, 1979). Thus, a search at Center for Advanced Studies in Applied Economics (CEPEA)/Luiz Queiróz Agriculture School (Esalq/USP) was performed. This institution is dedicated to follow-up variations in the price of milk sold in Brazil (CEPEA, 2023). The mean, minimum, and maximum values of this indicator in Minas Gerais, from January/2015 to July/2021, were collected (CEPEA, 2023). Temporality was defined by taking into account the same period-of-time (three years), before and after the reference year of data used in the present study (2018). Subsequently, these values, and the other monetary data of the assessed farms, were updated to July/2021 based on the General Price Index - Internal Availability (Fundação Getúlio Vargas - FGV, 2021). The lowest and highest value of the historical series (2015-2021) were assumed as likely maximum variation, because they provided the maximum amplitude of prices paid to producers in the aforementioned time lapse.
After the maximum and minimum milk price variation (%) was defined, the recorded values were multiplied by the price observed for milk sold by each of the 485 farms analyzed in 2018. Thus, we have assumed that the maximum and minimum milk price variation took place within a varying scale, depending on each analyzed farm.
Crystal Ball®, the software add in, which works in Microsoft Excel® spreadsheets, was used in the last step to generate the random values (Shamblin & Stevens, 1979) - confidence interval of 95% and 10,000 iterations were adopted (Guo et al., 2021). Shamblin and Stevens (1979) highlight that this step is essential and that large amounts of iterations help reduce variance and increase the sample’s reliability.
The number of times milk price assured profitability higher than 0% over the total number of simulations carried out was calculated; this indicator is called profit probability. Subsequently, the farms were grouped into four clusters, based on their profit probability. These clusters were created to group similar cases in order to make statistical analyses easier (Malhotra, 2001) and, consequently, to help identifying specificities capable of interfering with dairy farms through milk price variations. Therefore, farms that did not profit at any of the carried-out simulations were stratified and named “high risk”.
Next, the IBM SPSS® software was used to define the other groups (high, low, and very-low risk) through Discriminating Cluster (hierarchic) analysis. The Ward method, with square Euclidian Distance, was also adopted (Hair et al., 2005). Then, the descriptive analysis was performed with Turkey test at 5% significance level (p<0.05) in order to analyze differences in the means of the four clusters (Anastasiou & Gaunt, 2020). We suggested an equation to analyze the breakeven price (minimum price to achieve profitability equals to zero) and the rate of milk price variation tolerable by dairy farms before they start recording financial losses - the so-called Milk Price Tolerable Index (MPTI). MPTI was defined after the breakeven price was set. It was done to measure how far real prices were from the breakeven price, i.e., how much reduction in the product’s (milk) market prices could be tolerated by dairy farms, until it started generating losses.
4 Results and discussion
The lowest coefficient of variation in milk’s mean price was observed in 2015 (3.97%), when milk price was less volatile, whereas the highest coefficient of variation was recorded in 2016 (14.31%; Table 1). The year 2016 also presented the highest fluctuation in the historical series (14.31%), which recorded values higher and lower than the mean coefficient of variation (8.54%), every two years. However, this behavior was not observed in the minimum and maximum prices, and it pointed out that the mean fluctuation in milk price observed in Minas Gerais State may show cyclical behavior.
Variation in minimum and maximum values recorded for the 2018 average ranged from -42.93% to 17.38%. These values were herein used in the interval of classes for carrying out the milk price variation simulations. Accordingly, it is possible to state that such values are the class intervals or the maximum variations in the price of milk to be sold in Minas Gerais-based on the 2015-2021 historical series.
Farms were classified based on their profit probability at different risk levels (RL): very high, high, low, and very low. They composed 16.49%, 37.94%, 38.97%, and 6.60% of farms in the sample, respectively. Low-risk farms were the ones presenting the highest daily dairy production (1,969 liters/day; Table 2), their mean values were 28.78% and 111.72% higher than those recorded for the high and very-high risk level ones, respectively.
Production scale allows reducing production costs by increasing dairy farms efficiency (Ferrazza et al., 2020; Ferrari & Braga, 2021). Furthermore, higher production scales help achieving better milk prices (Evink & Endres, 2017). We cannot state that increase in production scales helps reduce market risks posed to dairy production due to milk price variation, since there was significant difference (p>0.05) between very-high RL farms and the others (Table 2).
Total revenues of very-low RL farms R$2.24/liter; Table 2) were 24.44%, 17.89% and 20.43% higher than that recorded for farms presenting very-high, high and low RL, respectively (p<0.05). Increase in total revenue seems to have helped reduce milk price fluctuation risks. Milk quality-composed of volume bonus, composition, and product quality -, among other components, presented statistically significant difference (p<0.05) due to dairy production risk level reduction; bonus resulting from quality is essential to increase dairy farms’ revenue (Ferrazza et al., 2020). Farms recording very-high, high, low, and very-low RL increased their revenue by 12.07%, 9.72%, 12.56% and 16.66% over the received milk price, respectively, on average. The statistical difference (p<0.05) identified in farms recording RL lower than the other ones was indicative of their high revenue due to improvement in milk quality and composition - they were less exposed to risks posed by variation in the price of milk sold in the market.
There was significant difference in the sales of animals (p<0.05) between farms recording very-low RL and the others (Table 2)-the increase reached 166.28% in comparison to the means recorded for the other clusters. This behavior helps explain the greater stability presented by these farms in face of milk price fluctuation in the market, since they accounted for 20.77% of revenues from the sales of animals, on average. Lopes et al. (2019) analyzed some dairy farms and observed that 26.08% of their total revenues, on average, comes from animals’ sales. They pointed out that this behavior was observed in little efficient farms that suffer with high production costs; therefore, they need to sell more animals in order to complete their income. Cases such as these, described by these authors, have high incomes deriving from animals’ sales, but such a process can lead to undercapitalization over the long-term if animals’ sales exceed the necessary.
Nevertheless, different from results recorded by Ferrazza et al. (2020), farms in the present study that have shown very low RL presented lower TOCs than the means recorded for the other clusters (Table 2). This finding points towards high operational efficiency; thus, technically efficient farms get to sell more animals, but they also keep high profit and reduce risks posed by fluctuation in market prices. Furthermore, the sales of animals by technically efficient farms helps mitigate risks set by milk price fluctuation.
Total Operational Cost (TOC) is the sum of expenditures to non-expendable costs whose values got lower as the risk level of the assessed clusters decreased (Table 2). Very-low RL farms recorded R$1.75/liter TOC or 35.42%, 18.98% and 6.40% lower than the ones recording very high, high, and low RL, respectively (p<0.05). This indicator is seen as efficient for this sector’s operation because activities accounting for the lowest TOCs present the best profitability (Ferrazza et al., 2020; Ferrari & Braga, 2021). This indicator allows inferring that the farms mostly exposed to risks posed by market price fluctuations are technically less efficient and present higher operational costs. Producers must pay closer attention to the relevance of reducing production costs in order to reduce the negative effects of milk price fluctuation on their production.
Effective operational costs (EOC) is the sum of expenditures linked to dairy production (Ferrazza et al., 2020). Its value in very-low RL farms R$1.48/liter), in the current study, was 32.73%, 16.38%, and 5.13% lower than that recorded for very-high, high, and low RL farms, respectively, on average. The significant difference (P<0.05) between the analyzed clusters (Table 1) highlighted that lower EOC farms are less exposed to risks posed by milk price variability in the market. Increase in production process efficiency helps reducing risks faced by the dairy production sector. Evink and Endres (2017) corroborated this understanding and added that producers must be concerned with this factor in order to reduce dairy activity’s exposure to variations in external environments (milk price, as well as public, economic, social and institutional policies, among others).
Depreciations presented significant difference (p<0.05) between the analyzed clusters (Table 2). Farms accounting for very low RL spent R$0.17/liter with depreciation; they recorded depreciation 56.41%, 39.29%, and 10.53% lower than the ones showing very high, high, and low depreciation, respectively, on average. Increase in the capital invested in dairy livestock helped mostly by exposing very-high RL farms to risks posed by milk price fluctuation in the market. This process results from TOC increase, which, in its turn, reduces dairy production profits (Ferrazza et al., 2020).
Farms presenting high and very high RL showed negative net margin, and their values were -R$0.70/liter and -0.03/liter (p<0.05; Table 2). This finding points out that these farms did not get to overcome all operational costs linked to their production. Very-high RL farms recorded the worst values in comparison to those accounting for high RL. Based on the prices practiced by these farms, we could observe their low economic performance, because their incomes did not cover the operational costs with milk production. The net margin of low and very-low RL farms was higher than that recorded for the other clusters: 108.57% higher than the low cluster farms.
Overall, profitability is the representativeness of the net margin over total revenues (Ferrazza et al., 2020); its significant difference (P<0.05) points out variation based on the risk level of the analyzed farms (Table 2). The worst result was recorded for very-high RL farm whose mean was -35.42% - it ranged from -15.92% to 8.72%. Based on the standard deviation values (higher than the mean), this cluster was the most heterogeneous among the ones analyzed. Furthermore, 51.63% of farms in the high RL cluster presented negative profitability. These results reinforce the understanding that the increased risk faced by dairy farms due to milk price variation influences their economic performance and leads to lower profitability. Farms accounting for lower risks posed by milk price volatility were the ones presenting the highest profitability.
Profitability in low RL farms reached 16.05%, on average (Table 2). None of the farms in this cluster presented negative profitability; their values ranged from 6.05% to 28.61%. The very-low RL cluster, in its turn, presented mean profit of 29.66%-it ranged from 19.69% to 40.27%. These results evidenced that increased profit has helped these farms to reduce their risk levels posed by milk price variation. These results corroborate the studies by Schulte et al. (2018), according to whom the profit of dairy farms is inversely related to milk price volatility; in other words, profit increase is related to price volatility reduction.
Decision-makers must concern themselves with profit increases in order to minimize the impacts of milk price variation in the market on dairy production. This is the way to minimize its effects on dairy farms’ revenue. Thus, practices such as technical efficiency increases, and the consequent reduction in production costs, can be the alternatives to increase profit in dairy farms. It is important to say that increased production process efficiency helps these farms to face lower risks posed by milk price volatility.
Very-high RL farms were the ones that have sold their milk for the lowest price R$1.82/liter) in comparison to the other clusters (Table 3). However, it seems that such a low price was not the determining condition for these farms to have recorded the highest risks, since they did not reach profit in any of the 10,000 simulations carried out for each farm. Schulte et al. (2018) state that this risk factor has great potential to influence dairy production profit. The low prices received per liter of sold milk is among the factors explaining the fact that these farms have also presented high risk levels.
Based on the economic performance analysis of these farms (Table 2), the highest risks can be associated with low production process efficiency, such as the case of high production costs, which exposed the assessed dairy farms to risks higher than fluctuation in prices for production selling (Table 3). This finding reinforces the understanding of other authors who warn about the need to have efficient production processes in order to reduce production costs (Mareth & Alves, 2020) and to maximize production resources (Evink & Endres, 2017; Aydemir et al., 2020).
Milk price variation in very-high RL farms was not the main risk factor, since variation in the received price R$1,10/liter) was the lowest one among the four analyzed clusters (Table 3). High operational cost (TOC and EOC) was the main risk identified in this cluster-higher than the milk prices. Technical efficiency must be taken into consideration at the time to reduce risks for dairy farms whose production costs are very high, when one compares it to milk price variation. Schulte et al. (2018) corroborated this finding by adding that the price of milk sold itself is not the main risk factor posed by the market to the dairy business, although it influences dairy farms’ economic performance. According to them, the high volatility observed in the market, which makes milk prices fluctuate, is the main risk factor.
There was no significant difference (p>0.05) in the medium, minimum, maximum, and mean values, and in the received milk price fluctuation between high and low RL farms (Table 3). These results evidence that milk price was also not decisive for the definition of risk levels recorded for the analyzed farms. These clusters (high and low RL) were the ones recording the highest mean, minimum, and maximum price in comparison to the other analyzed clusters. Such a behavior resulted from the highest operational costs (EOC and TOC; Table 2); this finding points out the lower operational efficiency of the production process.
The simulations carried out allowed suggesting the milk breakeven price, which was defined by the lowest milk price enabling zero profit for the analyzed farms. The breakeven price in the current study was the value simulated by the software that has led to net margin equal to zero. However, the breakeven price in dairy farms can be found through the following equation:
There was significant difference (p<0.05) in the means recorded for this indicator in clusters accounting for high, low and very low RL (Table 3). Very-high RL farms did not get profit in any of the carried-out simulations if one takes into account the variation in milk price from 2015 to 2021. This is the reason why such an indicator could not be calculated. Breakeven price in high RL farms was the highest among the assessed clusters (R$1.97/liter); this finding indicates that it would be necessary to increase the milk price by R$0.03/liter (Table 3) in order to reach 0% profit. It is possible to observe that milk price increase is essential for these farms to maximize the profit with dairy production. Thus, milk price fluctuation risks are high and expose these farms to negative economic outcomes (losses) if this commodity is not valorized in the market by increasing the price paid to producers.
Low RL farms presented lower breakeven prices at milk price R$1.58/liter (Table 3), and this finding points towards their lower dependence on price fluctuation in the dairy market in order to remain profitable. However, if milk price undergoes significant drop, and reaches values lower than the breakeven price, these farms will face losses. The breakeven price is mostly relevant for dairy producers to identify the lowest value possible for them to survive in the dairy sector without facing losses. Once decision-makers have this information in hand, they can anticipate strategies to help minimize the effects of milk price close to breakeven price on the dairy activity. It is possible to mention the possibility of selling surplus animals by increasing the efficiency of using inputs that are eventually overused, or by selecting the animals mostly qualified for dairy production (those that have higher yield, salubrity, and lactation persistence, among other factors).
Milk price variation did not lead to losses in very-low RL farms, since they presented profit higher than zero in all simulations. Breakeven price in this cluster was the closest to the minimum received milk price (Table 3). This outcome points out that these farms would be protected even in face of likely price drop in the market-when milk price have weak impact on farms’ performance for profit to be equal to zero. Higher efficiency is a factor explaining the efficiency of these farms in using their inputs, since it helps reducing production costs, as shown in Table 2.
Milk Price Tolerance Index (MPTI) is also recommended as indicator accounting for showing the rate of reduction in the price received for liter of sold milk, which is capable of influencing the breakeven price - it is calculated as follows:
Wherein,
-
MPTI: Milk price tolerance index, in percentage (%);
-
MBP: Milk breakeven price, in R$/liter; and
-
MP: Milk price (paid to producer), in R$/liter.
In case MPTI is positive (favorable condition), the received price is higher than the breakeven price. When such a condition is reached, the higher the index, the lower the risk of price variation in the milk market affecting the farm. Whenever negative (unfavorable condition), MPTI points out that the milk price received by the producer is lower than the breakeven price. Thus, such a situation poses high risk of losses for dairy producers, since these factors are linked to prices in the dairy market-if one has in mind the assumption that profitability will be negative.
It was not possible to calculate the MPTI of very-high RL farms because they presented profit probability equal to zero (Table 3). High RL farms recorded MPTI of -1.85%, and it evidences that their breakeven price is higher than that received per liter of milk and that profitability is negative. These farms face high risks of not having any profit out of their dairy activity, since it would be necessary reaching mean increase by 1.55% in market prices in order for them to have any profit. Such cases demand immediate cost-reduction strategies to have their risk minimized and to avoid losses.
MPTI has evidenced that low RL farms would tolerate reduction by 19.18% in milk price reduction in the market in order for them to reach the breakeven price (Table 3). It is possible to observe that this cluster has higher tolerance margin when it comes to variations posed by the market over the milk to be sold. An explanation for such a scenario is linked to higher production efficiency, because farms capable of optimizing their inputs tend to maximize their profit and, consequently, to be less exposed to risks deriving from price volatility in the market.
Very-low RL farms were the ones showing the higher MPTI among the four analyzed clusters (Table 3). Thus, they would tolerate reduction by 39.10% in the price paid per liter of milk to producers until the breakeven price is reached. MPTI in these farms is so high that the mean breakeven price was 7.55% higher than the lowest milk price paid to producers in this cluster, whereas farms accounting for low and high RL recorded 41.07% and 79.09%, respectively. This outcome reinforces the belief that these farms are highly capable of surviving milk price reductions, and this assumption evidences that the risks posed by the market over these farms are quite small. Although these farms have shown the best mean MPTI, it is essential to develop strategies to increase dairy production efficiency so that the indicator can get even higher and, consequently, market risks over the dairy business can be smaller.
Profit probability of the assessed farms was calculated based on the percentage of milk price simulations that recorded profitability higher than zero, whose clusters’ means recorded significant difference (P<0.05; Table 3). Very-high RL farms presented 0% probability of having any profit, regardless of the milk price variation in the simulations. Decision-makers have to develop short-, mid- and long-term strategies for cases like the aforementioned ones in order to increase their production process efficiency, because the highest mean milk sales prices of these farms were not enough for them to have any profit.
High RL farms presented 25.75% probability to have profit out of the dairy activity due to milk price variation. These results point towards the great risk of losses faced by these farms if milk price remains at the lower levels. The success of these producers’ activity can be closely related to variations in the price of milk sold in the market. Based on Table 3, if the milk price volatilization behavior remains the same in the future, as it happened from 2015 to 2021, there is the probability of milk price drop more often than it rises in Minas Gerais. This scenario increases the risks faced by these farms; in other words, they are somehow dependent on the market price to have some profit out of their dairy production.
Low RL farms recorded 60.65% probability of profiting from sales price fluctuation (Table 3). This finding highlights that production process efficiency in these farms ensures higher financial reserve, and it allows them to reduce their breakeven price and, consequently, to tolerate lower milk prices. Such a condition suggests that these farms are less exposed to risk posed by the dairy production activity due to actions of the milk market. Accordingly, decision-makers must think of management and production strategies to increase production process efficiency in the mid- and long-term in order not to change this scenario and to avoid new risks to it.
Different from the other clusters, the very-low RL one showed the lowest impact from milk price fluctuation. Farms in this cluster recorded positive net margin in 93.66% of the carried out simulations (Table 3), and this number suggests that milk price will hardly influence their profit. In such cases, decision-makers must be worried with long-term management and production strategies in order to reinforce and increase the development of dairy production. Implementing new technologies is a relevant factor for these farms to get stronger. Evink and Endres (2017) highlight that technological development is essential to increase and improve dairy farms’ efficiency.
The lowest risk incidence is analyzed through farms’ profit probability, by taking into account the minimum profitability (Figure 1). Very-high RL farms were not taken into consideration because their results in the series were equal to zero. Very-low RL farms were the most homogeneous ones when profit probability was compared to trend; this finding indicated that these farms have higher economic stability than the profit fluctuation, to the detriment of milk price variation. In this case, it is likely that 55.54% of very-low RL farms will reach profit higher than 20%. Profit probability reduction reached 40.59% when profitability was higher than 0%. It is possible to observe that some farms reached high economic performance, and this condition helps reducing the risks posed to them.
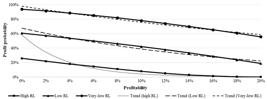
Profit probability based on different profits achieved by the dairy farms that were grouped by risk level (RL)
Low RL farms had their profit probability reduced from 60.65% to 18.89% when profitability increased from 0% to 20% (Figure 1). The cluster recording lower risks (very-low RL) presented 69.62% lower performance. The trend line (Low RL) was lesser uniform in this cluster, and this finding suggests higher variability of the sample and, consequently, higher exposure to risks.
High RL farms were the most heterogeneous among the assessed clusters, since their mean profitability, and the trend line, were the ones that have fluctuated the most (Figure 1). Furthermore, they decreased from 25.75% to 0.05% and reached profitability of 0% and 20%, respectively-such reduction (99.79%) was the highest among the assessed clusters. Accordingly, it is possible observing that the impact of increasing the risks made these farms even more exposed to lower profit probability in case of higher profitability.
In total, 63.92% of farms in the current study presented positive profitability and, altogether, they produced 19,275,688 liters of milk, or 71.02% of the total milk production - this number indicates that most of them are economically feasible. Efficient milk production leads to higher profit for producers and, consequently, to lower risks posed by factors extrinsic to the dairy activity.
Overall, publications in the literature suggest that producers are discouraged to go on in this activity because of financial matters, among other factors, since such a condition impairs generational succession in this business (Matte et al., 2019), which means high social risks. These studies evidence that producers lose their trust on dairy production as income source. Bassotto et al. (2019) emphasize that it is common finding farms that follow basic managerial practices, such as recording information, and it highlights managerial flaws (business risk). Results in the current research evidence that dairy production allows profit generation, and it helps reduce other risks and uncertainties experienced in this sector.
In total, 83.50 % of the herein assessed properties got some profit in at least one of the performed simulations. However, their probability of achieving real positive results is 47.40% (mean of simulations). These results evidence that dairy livestock in Minas Gerais seems to be quite exposed to risks posed by milk price volatility in the market, and they depend on it to have some profit. This is a worrisome condition, since such a scenario highlights low production process efficiency and the need of in-depth measurements of the necessary income for the assessed farms.
Mean milk price in Minas Gerais State was R$1.92/ liter (± R$0.19/liter). If this price drops to R$1.73/liter, only 216 (44.54%) of the farms will have profit if they produce 148,759,791 liters of milk (52.56%). Thus, it implies saying that milk price reduction by 10% in Minas Gerais would make 55.46% of farms face financial losses. These results reinforced the understanding, by several authors, that dairy farming in Minas Gerais State has operational weaknesses, as well as little capacity to support fluctuations in the milk market (Lopes et al., 2019; Ferrazza et al., 2020). These results reinforce the understanding that dairy livestock in the state still faces operational weaknesses, since it has little capacity to support fluctuations in the milk market. It is recommended for companies that buy milk to develop strategies to help increasing the efficiency of dairy farms. Besides, public policies that help reinforcing this sector are essential for the future of the dairy business in Minas Gerais State.
In case milk price rises by 10%, then 366 (75.46%) of these farms would have some profit and they would produce 237,280.433 (83.84%) liters of milk. This factor can be observed in the daily life of dairy farms, since milk-purchasing companies often pay more per liter produced in properties operating at larger production scales (Evink & Endres, 2017; Lopes et al., 2019; Bassotto et al., 2021). Milk price increase in Minas Gerais seems to be essential for the expressive increase in the amount of farms with the potential to have profit - this finding reinforces the understanding that this sector is vulnerable to milk price volatility. This valorization can be achieved by increasing the demand for dairy products, since it increases milk price, and by increasing the quality, composition and volume of milk produced in these farms. Similarly, decision-makers must assess and adopt strategies to minimize the herein described risks, as well as public bureaus and buyer companies must elaborate plans to reinforce the milk production chain in Minas Gerais.
5 Final considerations
The aims of the present research were to investigate how product (milk) price variation influences economic performance, as well as to suggest an indicator to analyze the risks faced by dairy farms in Minas Gerais State. Dairy farms in this state were quite different from one another in terms of risks posed by milk price volatility to their activity. Farms that have optimized their production resources and that, consequently, reduced their production costs, were the ones presenting the lowest risk of facing losses - this finding has evidenced that profitability can be used as indicator to measure their risk level. Furthermore, the sales of animals when farms have technical efficiency helps reducing risks posed by milk price fluctuation.
It is possible to observe that some farms need to adopt improvement strategies, since, regardless of milk price, they will hardly have some profit. Other farms seem to be stable, and they do not suffer much with the effects of milk price volatility. In all cases, it is clear that strategies to reinforce the milk production chain are necessary in order to give support to producers and to help developing this sector.
This study only analyzed the effects of milk price variation on the economic performance of dairy farms, it did not take into consideration other macro-environmental factors influencing this activity, such as variations in input prices. Future studies to analyze risks of milk price variation on farms presenting different technological development levels, production scale, production system and technical levels; family, mixed and hired manpower, among other features, are recommended. These studies are relevant to help better understand the profile of farms that would be vulnerable to milk price volatility.
Acknowledgement
The authors are grateful to Coordenação de Aperfeiçoamento de Pessoal de Nível Superior (CAPES) for granting the scholar ship for this research and to Serviço Brasileiro de Apoio às Micro e Pequenas Empresas - Sebrae Minas for providing data for the conduction of the research, and to Plataforma Educampo Leite.
References
- Alves, F. F., Souza, L. V., & Ervilha, G. T. (2014). Planejamento e previsão do preço do leite em Minas Gerais: Análise empírica com base no modelo X12-ARIMA. Revista de Economia e Agronegócio, 12(1), 115-134.
-
Anastasiou, A., & Gaunt, R. E. (2020). Multivariate normal approximation of the maximum likehood estimator via tje delta method. Brazilian Journal of Probability and Sattistics, 34(1), 136-149. https://doi.org/10.1214/18-BJPS411
» https://doi.org/10.1214/18-BJPS411 -
Aydemir, A., Gözener, B., & Parlakay, O. (2020). Cost analysis and technical efficiency of dairy cattle farms: A case study of Artvin Turkey. Custos e Agronegócio Online, 16(1), 461-481. http://www.custoseagronegocioonline.com.br/numero1v16/OK%2019%20cattle.pdf
» http://www.custoseagronegocioonline.com.br/numero1v16/OK%2019%20cattle.pdf -
Bassotto, L. C., Lopes, M. A., Brito, M. J., & Benedicto, G. C. (2022). Eficiência produtiva e riscos para propriedades leiteiras: Uma revisão integrativa. Revista de Economia e Sociologia Rural, 60(4), e245277. https://doi.org/10.1590/1806-9479.2021.245277
» https://doi.org/10.1590/1806-9479.2021.245277 -
Bassotto, L., Lopes, M. A., Almeida, G.A., Jr., & Benedicto, G. (2021). Gestão estratégica de custos de proriedades leiteiras familiares de Minas Gerais. Custos e @gronegócio on line, 17(2), 144-169. http://custoseagronegocioonline.com.br/numero2v17/OK%208%20gestao.pdf
» http://custoseagronegocioonline.com.br/numero2v17/OK%208%20gestao.pdf -
Bassotto, L. C., Angelocci, M. A., Naves, L. P., & Putti, F. F. (2019). Relações de comercialização entre compradores e produtores de leite no sul de Minas Gerais. Interações, 20(1), 207-220. https://doi.org/10.20435/inter.v0i0.1671
» https://doi.org/10.20435/inter.v0i0.1671 - Buainain, A. M., & Silveira, R. L. (2017). Manual de avaliação de riscos na agropecuária: Um guia metodológico. ENS-CPES.
-
CEPEA - Centro de Pesquisas Econômicas da Escola Superior de Agricultura Luiz de Queiroz - ESALQ/USP. (2023, March 10). Leite ao Produtor CEPEA/ESALQ (R$/litro) - Líquido. https://www.cepea.esalq.usp.br/br/indicador/leite.aspx
» https://www.cepea.esalq.usp.br/br/indicador/leite.aspx -
Costa, A. C., Oliveira Neto, O. J., & Figueiredo, R. S. (2020). Mercado internacional e basileiro de leite: volatilidade e transmissão de leite. Alcance, 27(1), 82-98. https://periodicos.univali.br/index.php/ra/article/view/13785
» https://periodicos.univali.br/index.php/ra/article/view/13785 -
Evink, T. L., & Endres, M. I. (2017). Management, animal health, and economic characteristics of large dairy herds in 4 states in the Upper Midwest of the United States. Journal of Dairy Science, 100(11), 9466-9475. https://doi.org/10.3168/jds.2016-12179
» https://doi.org/10.3168/jds.2016-12179 -
Ferrari, M. C., & Braga, M. J. (2021). A eficiência técnica dos produtores leiteiros no Uruguai. Revista de Economia e Sociologia Rural, 59(2), e221319. https://doi.org/10.1590/1806-9479.2021.221319
» https://doi.org/10.1590/1806-9479.2021.221319 -
Ferrazza, R. A., Lopes, M. A., Prado, D. G., Lima, R. R., & Bruhn, F. R. (2020). Association between technical and economic performance indexes and dairy farm profitability. Revista Brasileira de Zootecnia, 49, e20180116. https://doi.org/10.37496/rbz4920180116
» https://doi.org/10.37496/rbz4920180116 -
FGV - Fundação Getúlio Vargas. (2021, July 27). Correção de Valores. Calculadora do Cidadão. https://www3.bcb.gov.br/CALCIDADAO/publico/corrigirPorIndice.do?method=corrigirPorIndice
» https://www3.bcb.gov.br/CALCIDADAO/publico/corrigirPorIndice.do?method=corrigirPorIndice -
Frick, F., & Sauer, J. (2020). Technological change in dairy famring with increased price volatility. Journal of Agricultural Economics, 72(2), 564-588. https://doi.org/10.1111/1477-9552.12417
» https://doi.org/10.1111/1477-9552.12417 -
Gebreegziabher, K., & Tadesse, T. (2014). Risk perception and management in smallholder dairy farming in Tigray, Northen Ethiopia. Journal of Risck Research, 17(3), 367-381. https://doi.org/10.1080/13669877.2013.815648
» https://doi.org/10.1080/13669877.2013.815648 -
Guo, P., Li, H., Zhang, G., & Tian, W. (2021). Contaminated site-induced health risk using Monte Carlo simulation: Evaluation from the brownfield in Beijing, China. Environmental Science and Polluition Research, 28, 25166-25178. https://doi.org/10.1007/s11356-021-12429-4
» https://doi.org/10.1007/s11356-021-12429-4 -
Guo, X., Egozcue, M., & Wong, W. K. (2020). Production Theory under price uncertainty for firms with disappointment aversion. International Journal of Production Research, 59(8), 2392-2405. https://doi.org/10.1080/00207543.2020.1733699
» https://doi.org/10.1080/00207543.2020.1733699 - Hair, J. F. Jr., Anderson, R. E., Tatham, R. L., & Black, W. C. (2005). Análise multivariada de dados (5th ed.). Bookman.
-
Hyde, J., & Engel, P. (2002). Investing in a Robotic Milking System: A Monte Carlo Simulation analysis. Journal of Dairy Science, 85(9), 2207-2214. https://doi.org/10.3168/jds.S0022-0302(02)74300-2
» https://doi.org/10.3168/jds.S0022-0302(02)74300-2 -
IBGE - Instituto Brasileiro de Geografia e Estatística. (2017, November 20). Resultados definitivos: Bovinos Brasil. Censo Agro. https://censos.ibge.gov.br/agro/2017/templates/censo_agro/resultadosagro/pecuaria.html?localidade=0&tema=75655
» https://censos.ibge.gov.br/agro/2017/templates/censo_agro/resultadosagro/pecuaria.html?localidade=0&tema=75655 -
IBGE - Instituto Brasileiro de Geografia e Estatística. (2020a, May 25). MUNIC - Perfil dos Municípios Brasileiros. IBGE Cidades. https://cidades.ibge.gov.br/brasil/sp/botucatu/pesquisa/1/21682
» https://cidades.ibge.gov.br/brasil/sp/botucatu/pesquisa/1/21682 -
IBGE - Instituto Brasileiro de Geografia e Estatística. (2020b, March 9). Pesquisa Trimestral do Leite. Instituto Brasileiro de Geografia e Estatística. https://www.ibge.gov.br/estatisticas/economicas/agricultura-e-pecuaria/9209-pesquisa-trimestral-do-leite.html?=&t=downloads
» https://www.ibge.gov.br/estatisticas/economicas/agricultura-e-pecuaria/9209-pesquisa-trimestral-do-leite.html?=&t=downloads -
IBGE - Instituto Brasileiro de Geografia e Estatística. (2023, March 9). Produção de leite. Instituto Brasileiro de Geografia e Estatística - IBGE. https://www.ibge.gov.br/explica/producao-agropecuaria/leite/br
» https://www.ibge.gov.br/explica/producao-agropecuaria/leite/br -
Lopes, M. A., Moraes, F., Carvalho, F. M., Bruhn, F. R., Lima, A. L., & Reis, E. M. (2019). Effect on workforce diversity on the cost-effectiveness of milk production systems participating in the "full bucket" program. Semina: Ciências Agrárias, 40(1), 323-338. http://doi.org/10.5433/1679-0359.2019v40n1p323
» http://doi.org/10.5433/1679-0359.2019v40n1p323 -
Lopes, M. A., Reis, E. M., Demeu, F. A., Mesquita, A. A., Rocha, A. G., & Benedicto, G. C. (2016). Uso de ferramentas de gestão na atividade leiteira: um estudo de caso no sul de Minas Gerais. Revista Científica de Produção Animal, 18(1), 26-44. https://doi.org/10.5935/2176-4158/rcpa.v18n1p26-44
» https://doi.org/10.5935/2176-4158/rcpa.v18n1p26-44 - Malhotra, N. (2001). Pesquisa de marketing (3rd ed.). Bookman.
-
Mareth, T., & Alves, T. W. (2020). Analysing the determinants of technical efficiency of dairy farms in Brazil. International Journal of Productivy and Performance Management, 68(2), 464-481. https://doi.org/10.1108/IJPPM-06-2018-0234
» https://doi.org/10.1108/IJPPM-06-2018-0234 - Matsunaga, M., Bemelmans, P. F., Toledo, P. E., Dulley, R. D., Okawa, H., & Pedroso, I. A. (1976). Metodologia de custo de produção utulizado pela IEA. Agricultura em São Paulo, 23(1), 123-139.
-
Matte, A., Spanavello, R. M., Lago, A., & Andreatta, T. (2019). Agricultura Familiar e Pecuária Leiteira: (Des) continuidade na reprodução social e na gestão de negócios. Revista Brasileira de Gestão e Desenvolvimento Regional, 15(1), 19-33. https://www.rbgdr.net/revista/index.php/rbgdr/article/view/4317
» https://www.rbgdr.net/revista/index.php/rbgdr/article/view/4317 -
Mirza, N., Reddy, K., Hasnaoui, A., & Yates, P. (2020). A comparative analysis of the Hedging Effectiveness of farmgate milk prices for New Zeland and United States dairy farmers. Journal of Quantitative Economics, 18(1), 129-142. https://doi.org/10.1007/s40953-019-00172-0
» https://doi.org/10.1007/s40953-019-00172-0 -
Nouri, K., & Abbasi, B. (2017). Implementation of the modified Monte Carlo simulation for evaluate the barrier option prices. Journal of Taibah University for Science, 11(1), 233-240. https://doi.org/10.1016/j.jtusci.2015.02.010
» https://doi.org/10.1016/j.jtusci.2015.02.010 -
Ogachi, D., Ndege, R., Gaturu, P., & Zoltan, Z. (2020). Corporate Bankruptcy Prediction Model, a Special Focus on Listed Companies of Kenya. Journal of Risk and Finacial Management, 13(3), 47-60. https://doi.org/10.3390/jrfm13030047
» https://doi.org/10.3390/jrfm13030047 -
Perobelli, F. S., Araújo, I. F., Jr., & Castro, L. S. (2018). As dimensões espaciais da cadeia produtiva do leite em Minas Gerais. Nova Economia, 28(1), 297-337. https://doi.org/10.1590/0103-6351/4789
» https://doi.org/10.1590/0103-6351/4789 -
Schulte, H. D., Musshoff, O., & Meuwissen, M. P. (2018). Considering milk price volatility for investiment decisions on the farm level after European milk quota abolition. Jounal of Dairy Science, 101(8), 7531-7539. https://doi.org/10.3168/jds.2017-14305
» https://doi.org/10.3168/jds.2017-14305 - Shamblin, J. E., & Stevens, G. T. (1979). Pesquisa Operacional. Atlas.
- Vilela, D., Ferreira, R. P., Fernandes, E. N., & Juntolli, F. V. (2016). Pecuária de Leite no Brasil: Cenários e avanços tecnológicos. Embrapa.

 Source: Research data.