
 Geophysical Characterization of São José do Vale do Rio Preto to Identify Uranium Occurrences in Groundwater, Southeast of Brazil
Abstract
The deterioration of surface water quality in the hydrographic basins of the mountainous region of Rio de Janeiro, Brazil, has led to an increasing dependence on well drilling for access to groundwater. Although this groundwater is often considered a high-quality source suitable for consumption, it may contain elevated concentrations of Uranium (U) due to the regional lithological geochemistry. The study area, located in São José do Vale do Rio Preto (Rio de Janeiro, Brazil), features a complex geological composition that influences the hydrochemical in the region’s fractured aquifers. This research primarily aimed to investigate the factors contributing to high levels of U in groundwater in this region. Advanced geophysical techniques were employed, including gamma-ray spectrometry to assess radioelement concentrations and magnetometry to map structural directions in the area. The study mapped contamination patterns both on the surface and subsurface, establishing a precise correlation between groundwater flow dynamics and the influence of the Central Tectonic Boundary (CTB), a significant transpressive shear zone affecting the regional geological structure. In addition to the geophysical data analysis, the research evaluated the impact of local geological formations on U distribution in well samples. By integrating these results, the study clarified the relationship between geological formations, groundwater flow, and U contamination. This understanding can guide strategies to mitigate water quality issues and provide insights for more effective groundwater management practices in the region.
Key words
uranium contamination; aeromagnetic; gamma-ray spectrometry; groundwater; hydrogeology
INTRODUCTION
The declining quality of groundwater in the mountainous watersheds of Rio de Janeiro (Molinari & Rotunno Filho 2017, Peres & Moreira 2017) has led to the drilling of wells intended to provide access to purportedly clean water. However, this water, which is believed to be of high quality and potable, contains elevated concentrations of uranium (U) (Godoy et al. 2000, 2019, Godoy & Godoy 2005), a consequence of the region’s geological characteristics (CPRM 2001). The extensive utilization of this water by the local population has raised concerns.
These watersheds are associated with fractured aquifers, which exhibit considerable spatial variability in hydraulic parameters and flow dynamics (Roques et al. 2014). Furthermore, these aquifers may be interconnected through large fractures, which can range from shallow to deep (Banks et al. 2002, Dewandel et al. 2006). The flow of water through these fractures facilitates the dissolution of minerals through weathering processes, thereby influencing the chemical composition of groundwater (Fuoco et al. 2022). Consequently, it is crucial to consider the naturally occurring high levels of mineral salts, with varying concentrations of calcium (Ca), magnesium (Mg), sodium (Na), potassium (K), and strontium (Sr) in groundwater. This composition may also include trace elements such as uranium. Bonotto (2004) has demonstrated that uranium can be found in both primary and accessory minerals of granites and igneous rocks, which are prevalent in the mountainous regions of Rio de Janeiro.
Globally, the concentration of uranium in groundwater is typically less than 1-5 μg/L (Smedley & Kinniburgh 2023). However, research by Godoy et al. (2019) indicates that uranium concentrations in groundwater from these regions can exceed 930 μg/L, which is approximately 30 times higher than the permissible levels established by Brazilian legislation. Therefore, it is imperative to promote further research that integrates hydrogeological and hydrogeochemical aspects to better identify areas in the São José do Vale do Rio Preto region that are particularly vulnerable to high concentrations of uranium in groundwater. Therefore, the aim of this study is to highlight new approaches to identifying the hydrogeological conditions that lead to high concentrations of U in groundwater from integrated geophysical and geochemical data. The study area (Figure 1) is located in the state of Rio de Janeiro and encompasses several municipalities, including São José do Vale do Rio Preto, Teresópolis, Petrópolis, Três Rios, Sumidouro, and Sapucaia. This region’s drainage basins collect water from springs located in the Serras Maravilha, Flores, Boa Vista, and Capim areas, which are the main topographic elevations. Notably, the hydrographic network is extensive, with the Rio Preto River serving as the primary drainage axis. This river runs close to the boundary between the Arcádia Areal Unit, characterized by garnet-biotite-banded gneisses intermixed with quartzites, and the Rio Negro Complex, composed of hornblende orthogneisses, metadiorites, porphyritic metagranitoids, and homogeneous granitoids (Heilbron et al. 2016). It’s in this vicinity where wells with elevated U levels have been identified (Godoy et al. 2019).

Study area topography (TOPODATA – Brasil 2008) map, Rio Preto River (blue line), the study area location (black rectangle) and the municipality limits (black dashed line).
GEOLOGICAL CONTEXT
It’s crucial to understand that the geological context of the study area (Figure 2) lies within the Ribeira Mobile Belt, which, in essence, is a complex belt of folds and NE-SW trending thrusts. This belt originated during the Brasiliano event, situated on the south/southeast margin of the São Francisco Craton (Heilbron et al. 2016).
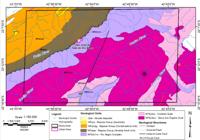
Geological map of the study area with an overlay that shows the main lithostratigraphic units, the main mapped geological structures, the drainage zones (blue lines), and the location of São José do Vale do Rio Preto´s urban zone (pink polygon). Adapted from Heilbron et al. (2016).
This geological event is characterized by the collision of the São Francisco Craton with other plates and/or microplates, as well as its collision with the southwestern portion of the CongoCraton, resulting in the stacking of terrains from E-SE to W-NW. This process ultimately led to the formation of the Gondwana supercontinent (Heilbron et al. 2004). For a comprehensive understanding of the diverse lithologies present in the study area, these lithotypes can be categorized, in terms of evolution, into three primary groups of rocks and sediments: the Basement, the Mesozoic Basic Intrusive, and the Quaternary Cover.
The Basement comprises high-grade metamorphic rocks that underwent significant metamorphosis and deformation during the Brasiliano event, dating back to the Neoproterozoic era (Tupinambá et al. 2012). These lithologies can be further grouped into four major lithostructural domains: the Rio Negro Magmatic Arc, situated in the Eastern terrain (Tupinambá 1999) and the Juiz de Fora Domain, Andrelândia Domain, and the Paraíba do Sul Klippe, located in the Western terrain (Heilbron et al. 2004, 2016, 2020). These terrains are demarcated by transpressive oblique shear zones, including the suture zone known as CTB (Central Tectonic Boundary), which separates the Western and Eastern terrains (Tupinambá 1999, Tupinambá et al. 2012, Heilbron et al. 2004, 2016).
Moving to the Mesozoic Basic Intrusives, it’s noteworthy to mention the events following the Neoproterozoic era when there was a prolonged period of crustal stability extending throughout the Paleozoic until the Gondwana breakup in the Mesozoic (Hasui 2012). The fragmentation of the Gondwana supercontinent occurred during the Jurassic and Cretaceous periods, impacting existing geological structures. Prior to this breakup and the subsequent opening of the Atlantic Ocean, there was significant basic magmatism, primarily tholeiitic in nature, resulting in a plethora of dykes oriented predominantly in the NE-SW direction (Mohriak 2004).
Progressing through geological time, from the Late Cretaceous to the Paleogene, there were abundant instances of alkaline magmatism associated with the South Atlantic opening in Southeastern Brazil, where the study area is situated. These events coincided with a series of diastrophic events that fractured the crust, forming grabens and horsts, leading to both uplifts in certain relief areas and sediment deposition in lowered regions (Riccomini et al. 2004). The intense and brittle tectonics in Southeastern Brazil gave rise to notable features such as the Guanabara Graben (Ferrari 2001) and Serra do Mar (Almeida & Carneiro 1998). Additionally, in the Paleogene period, there was a tectonic reactivation resulting in the formation of the Continental Rift of Southeastern Brazil (Riccomini 2004), significantly influencing the drainage network observed in the study area.
Concerning the Quaternary cover, it is characterized by alteration mantles and alluvial deposits, consisting of clayey-sandy deposits found in channel bars, flood plains, and river terraces distributed throughout valleys in the study area (Heilbron et al. 2016). In the hydrogeological context (CPRM 2001), based on the different lithotypes, two main aquifer systems have been identified: 1) an unconsolidated granular aquifer system (formed by alteration mantles and alluvial deposits), and 2) a fissural porosity aquifer system (formed by gneisses and granites from the Raposo Group, Rio Negro Complex, Serra dos Órgãos Suite, and Cordeiro Suite).
MATERIALS AND METHODS
Data base
Wells and hydrogeochemical
The well data utilized in this study (Table I) were obtained from the digital platform Sistema de Informações de Águas Subterrâneas (SIAGAS - CPRM 2022). This data includes information on static levels, lithological characteristics, and elevation, which were then georeferenced onto the base map. Geospatial validation of the wells identified by Godoy et al. (2019) was carried out to analyze U hydrogeochemical data (Figure 3). Additionally, silica concentration data from wells, analyzed by the Laboratório de Caracterização de Águas (LABAGUAS) at the Pontifícia Universidade Católica do Rio de Janeiro (PUC-Rio) and presented in Fraifeld (2018), were incorporated into the analysis.

Groundwater wells location map. Overlaying the map, green circles denote wells where high concentrations of Uranium were detected, while red circles indicate those where such concentrations were not found. These data were extracted from Godoy et al. (2019).
According to water quality data analyzed by the LABAGUAS laboratory at PUC-Rio (Godoy et al. 2019), among the wells investigated in the municipality of São José do Vale do Rio Preto, four of the wells investigated in the municipality of São José do Vale do Rio Preto exhibited uranium concentrations surpassing the threshold established by Ordinance MS 2914/2011, which is 0.030 ppm (see Table II). Consequently, the water from these wells fails to meet the criteria for potability.
Aerogeophysical
The magnetic and airborne gamma-ray spectrometry maps, as part of the Rio de Janeiro Aerogeophysical Project (CPRM 2012), were utilized to identify structures and geological formations associated with U hydrogeochemistry. The aeromagnetic and airborne gamma-ray spectrometry data from this project were collected with a flight line spacing of 500 m in the north-south direction, supplemented by east-west tie lines spaced at 10 km intervals. Magnetometer measures were recorded every 0.1 s, while gamma-ray spectrometer measures were taken every 1 second, with the survey conducted at a nominal altitude of 100 m. To generate the grids for the magnetic and radiometric channels, the minimum curvature method (Briggs 1974) was employed. This method utilized grid cells measuring 125 x 125 m, which corresponds to 1/4 of the flight line spacing.
Methods
Gamma-Ray spectrometry
As highlighted in the 2003 bulletin of the International Atomic Energy Agency (IAEA 2003), the ratios among radiometric channels—namely, K, eTh, and eU—hold significant importance in distinguishing the enrichment or depletion of a channel concerning others, irrespective of environmental factors such as soil moisture, vegetation cover, and topographic fluctuations. These ratios exhibit a robust correlation with lithological units, allowing them to discern subtle variations indicative of lithological alterations that may not be readily apparent in the original grids (IAEA 2003). Moreover, these ratios effectively mitigate the impacts of lithological diversity, thereby enhancing the more nuanced manifestations of radioelements (Minty 2011).
It is noteworthy that increasing silica content results in higher concentrations of all three radioelements, albeit the increase in thorium content is more pronounced compared to U. Consequently, the eU/eTh ratio serves as a valuable tool for examining the degree of differentiation within an igneous suite (Dickson & Scott 1997).
Magnetic enhancements filters
The magnetic method is designed to interpret geology by analyzing anomalies in the Earth’s magnetic field, which are closely linked to the magnetic properties of rocks (Kearey et al. 2009). Magnetic enhanced filters are utilized to more accurately delineate anomalies of interest associated with geological structures and contact zones (Blakely 1995). To enhance magnetic sources generated by shallow causative bodies, the First Vertical Derivative (Dz) filter (Blakely 1995) is employed (Eq. 1). This filter quantifies the rate of change of the anomalous magnetic field as one moves vertically away from the inducing source.
Where, TMI represents the Total Magnetic Intensity and ∂ z is the vertical gradient.
To delineate the boundaries and shapes of shallow magnetic causative sources, the Total Gradient (TG) filter, proposed by Li & Cheng (2006), was employed. It is calculated as the ratio of the vertical gradient (z) to the two horizontal gradients (x, y) of TMI, as illustrated in Equation 2.
RESULTS AND DISCUSSIONS
Groundwater flow
The use of well data extracted from the SIAGAS database facilitated the acquisition of potentiometric curves and the delineation of preferential underground flow paths. Subsequently, the hydraulic heads (H) using the SIAGAS database identified within the study area (Table II). After determining the hydraulic load, a geostatistical analysis was carried out using the IDW tool (Figure 4). Figure 4 illustrates the primary recharge zones and, especially for this investigation, the discharge zones. It is clear that the recharge zones are correlated with the main topographic elevations in the study area, such as Serra da Maravilha and Serra das Flores, while the discharge zones are concentrated along the course of the Rio Preto River.

IDW model of the hydraulic heads obtained for the Rio Preto River Sub-Basin and potentiometric/flow lines. Overlaid on this model are the drainage areas (blue lines) and the wells (black dots) utilized in this study.
Gamma-ray spectrometry maps
Potassium channel
The potassium (K) channel map (Figure 5) illustrates values ranging from 1.06 to 150.04%. Notably, a cluster of anomalies aligns along the entire extent of the Central Tectonic Boundary (CTB), as observable on the map.

K channel map. Legend: dashed lines – geological unit boundaries (dashed white and red lines), drainage zones (light blue lines), CTB fault (blue line), Wells: high U content (white circles), low U content (blue circles) (Godoy et al. 2019) and Siagas well database (black circles).
Five significant anomalies were identified within the area:
Anomaly A – Positioned in the northwest region of the Raposo Group (Arcádia Areal unit), this anomaly showcases concentrations exceeding 90%. It borders the Serra das Flores and presents an elongated shape aligned with the regional trend. An associated, albeit less intense, anomaly (A1) appears to be a continuation of Anomaly A.
Anomaly B – Concentrated primarily in the Serra do Capim region, this anomaly extends in a southwest-northeast direction along the CTB and the Rio Preto River towards the southern part of the area. It corresponds to a valley between Serra do Capim and Serra da Boa Vista and is entirely within the Serra dos Órgãos Suite. Additionally, there is a nucleus (B1) adjacent to it, representing a portion associated with Anomaly B.
Anomaly C – This anomaly exhibits high concentrations in the Serra dos Órgãos region, extending southwestward. Concentration values surpass 90%, and the anomaly is fully contained within the Serra dos Órgãos Suite. An associated core, C1, is situated below, representing a portion associated with Anomaly C.
Anomaly D – Situated in the Serra Maravilha region, this anomaly displays high concentrations exceeding 90% and is entirely within the Serra dos Órgãos Suite. An associated core, D1, lies below, representing a portion associated with Anomaly D.
Anomalies E and F – Among other isolated anomalies, these two exhibits lesser expression with concentration values ranging from 50% to 100%.
Equivalent thorium channel
The equivalent Thorium (eTh) map (Figure 6) displays values ranging from 2.09 to 21.72 ppm. Notably, the delineation of the Rio Negro Complex with its borders is clearly defined. To the northwest, it abuts the Raposo Group (Arcadia Areal unit), while to the southeast, it borders the Serra dos Órgãos Suite. The eTh map reveals two predominant domains. The first domain encompasses the region situated in the northwest area of the Raposo Group (Conservatório unit), where concentration values range from 14 to 21 ppm. This anomaly, bordering Serra das Flores, displays an elongated shape aligned with the southwest-northeast regional trend. Adjacent to this anomaly is a secondary one of lower concentration, seemingly extending from the larger anomaly. This secondary anomaly exhibits much less intense values and appears elongated along the entire length of the Raposo Group (Arcádia Areal unit), running parallel to the entire boundary of the CTB, with concentration values surpassing 22 ppm.

eTh channel map. Legend: dashed lines – geological unit boundaries (dashed white and red lines), drainage zones (light blue lines), CTB fault (blue line), Wells: high U content (white circles), low U content (blue circles) (Godoy et al. 2019) and Siagas well database (black circles).
Furthermore, a series of anomalies covers the entirety of the Serra dos Órgãos Suite. This collection of anomalies can be divided into two groups: the first is concentrated in the Serra do Capim region, displaying the highest concentrations, while the second spans the alluvial plain area of the Rio Preto River between Serra Maravilha, Serra da Boa Vista, Serra dos Órgãos, and Serra do Capim. Additionally, another set of anomalies with lower concentrations can be observed around Serra Maravilha and Serra dos Órgãos. In the broader context, this array of anomalies delineates the contact points between the Serra dos Órgãos Suite and the Rio Negro Complex.
Equivalent uranium channel
Upon observation, the equivalent Uranium (eU) map (Figure 7) reveals no significant concentration values, contrasting with the general trend observed across the map, where values typically range between 0.17 and 2.64 ppm. Particularly noteworthy are two distinct regions within the Serra dos Órgãos Suite – specifically, Serra do Capim and Serra da Boa Vista – which exhibit anomalies with elevated eU concentrations. These regions are likely to serve as potential source rock areas for the mineral. In contrast, anomalies indicating heightened eU concentrations are notably absent in other mountain ranges, such as Serra Maravilha, Serra das Flores, and Serra dos Órgãos.

eU channel map. Legend: dashed lines – geological unit boundaries (dashed white and red lines), drainage zones (light blue lines), CTB fault (blue line), Wells: high U content (white circles), low U content (blue circles) (Godoy et al. 2019) and Siagas well database (black circles).
It is evident that rocks in the region of the Raposo Group (Conservatória unit) exhibit high concentrations of eU, with values exceeding 2.6 ppm. These anomalies extend in a southwest- northeast direction along the contact of this unit with the Raposo Group (Arcádia Areal unit). Once again, an elongated southwest-northeast anomaly is apparent along the entire CTB thrust fault. The rocks in this area, as well as those adjacent to it, display elevated concentrations of eU. Moreover, it can be observed that only the rocks bordering the municipality of Sapucaia in the northeastern part of the Rio Negro Complex unit exhibit high concentrations of eU. Additionally, two regions with notable concentrations of eU are highlighted: The first is situated in the alluvial region of the Capim river, nestled between the mountain range of the same name and Serra dos Órgãos, within the Serra dos Órgãos Suite. The second is located further south, in the alluvial region of the Rio Preto River between Serra Maravilha and Serra dos Órgãos, within the region of the Cordeiro Suite. As noted by Dickson & Scott (1997), these minerals, along with thorium, can accumulate in sand deposits containing heavy minerals, as evidenced in this alluvial plain region.
eU/eTh ratio
The eU/eTh ratio map (Figure 8) showcases values ranging from 0.05 to 0.23 within the delineated domains identified as the primary areas of concentration. Five distinct domains with high concentrations are discernible: A, B, C, D, and E. Interestingly, these domains are aligned in a southwest-northeast direction and do not correlate with the regions of the mountain massifs in the area.
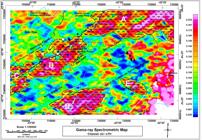
eU/eTh ratio map. Legend: dashed lines – geological unit boundaries (dashed white and red lines), drainage zones (light blue lines), CTB fault (blue line), Wells: high U content (white circles), low U content (blue circles) (Godoy et al. 2019) and Siagas well database (black circles).
Domains A, B, and C are situated in the region between Serra das Flores and Serra da Boa Vista and Capim, within the alluvial region. These domains border the Serra dos Órgãos Suite and encompass parts of the Rio Negro Complex and Raposo Group (Arcádia Areal). The “A” domain anomaly displays an elongated shape, featuring a concentric pattern characterized by alternating high and low eU/eTh ratios, primarily located in the northeast region of the study area. A portion of this domain comes into contact with the CTB fault.
The anomaly within domain “B” exhibits an elongated shape in a southwest-northeast direction, encompassing the entire region where the contaminated wells are situated in the city of São José do Vale do Rio Preto. Its lateral boundaries extend along the Flores, Boa Vista, and Maravilha mountains, alongside the CTB fault.
The anomaly within domain “C” is positioned southwest of domain “B” and shares similar characteristics. Presumably, this domain may have originally been part of domain “B” but became separated by a fault.
The elliptical-shaped anomaly within domain “D” stretches in a west-east direction within a valley, forming an alluvial plain along the Rio Preto River. It covers the entire region of the Cordeiro Suite area, with lateral limits running along Serra Maravilha and Serra dos Órgãos. Similarly, the elliptical-shaped anomaly within domain “E” extends in a northwest-southeast direction within a valley, constituting an alluvial plain of a tributary of the Rio Preto River. This domain is entirely situated within Serra dos Órgãos.
Ternary radiometric
The Ternary Radiometric map (Figure 9) illustrates the ratio among the three radiometric channels (K, eU, eTh), with different shades of color representing their variations. The color spectrum ranges from red (representing 100% K), through green (representing 100% eTh), to blue (representing 100% eU). White indicates the presence of all three elements, while black signifies the absence of these elements.

Ternary composition map. Legend: dashed lines – geological unit boundaries, drainage zones (light blue lines), CTB fault (blue line), Wells: high U content (white circles), low U content (blue circles) (Godoy et al. 2019) and Siagas well database (black circles).
According to the Ternary Map, a significant portion of the map exhibits a green hue, indicating the prevalence of the radioelement thorium. Specifically, Serra das Flores and part of Serra Maravilha are highlighted with this coloration. However, in the southeastern and northeastern regions of the map, there is a prominent reddish hue, signifying a predominance of the K. Notably, areas displaying a white hue represent the presence of all three elements, observed notably in Serra do Capim and along the channel of the Rio Preto River towards the south, as well as in specific regions of Serra dos Órgãos above Serra das Flores.
Regarding the presence of the eU, a high concentration is evident in the southern region of the area, particularly between Serra Maravilha and Serra dos Órgãos, corresponding to the Rio Preto River and two tributaries. These waterways may serve as conduits for sediment transport to lower altitude regions within the urban area of the municipality. Additionally, concentrated areas of eU are observable around Serra do Capim and at the termination of the CTB fault in the northern region of the area. However, the most significant concentration is observed within the urban area of the municipality, coinciding with confirmed U-contaminated wells. Furthermore, a concentration of U interspersed with K is evident throughout this region.
Consequently, it can be inferred that regions exhibiting high concentrations of eU are situated at higher altitudes and in proximity to river channels and tributaries, with a downstream direction towards the city of São José do Vale do Rio Preto.
Total magnetic intensity
The Total Magnetic Intensity (TMI) map (Figure 10) illustrates magnetic intensity values ranging from -13.52 to 118.46 nT. Remarkably, the magnetic lineaments showcase a compartmentalized pattern oriented in a SW-NE direction, aligning with the regional geological trend.

TMI map. Legend: dashed lines – geological unit boundaries (dashed white and red lines), drainage zones (light blue lines), CTB fault (black line), Wells: high U content (white circles), low U content (blue circles) (Godoy et al. 2019) and Siagas well database (black circles).
First vertical derivative
The First Vertical Derivative (Dz) map (Figure 11) illustrates magnetic intensity ratio values ranging from -0.06 to 0.03 nT/m. The delineated lineaments showcase a magnetic trend oriented in the SW-NE direction, aligning consistently with the predominant direction observed in the state of Rio de Janeiro, as depicted in the geological and geophysical maps.

Dz map. Legend: dashed lines – geological unit boundaries (dashed white and red lines), drainage zones (light blue lines), CTB fault (black line), Wells: high U content (white circles), low U content (blue circles) (Godoy et al. 2019) and Siagas well database (black circles).
In the northwest portion of the map, the CTB fault stands out prominently, extending in a SW-NE direction along the course of the Rio Preto River from São José do Vale do Rio Preto to Areal. The CTB is identified as a thrust fault resulting from the collision and suturing of the Raposo Group (Eastern terrain) with the Rio Negro Complex (Western terrain). Adjacent to the CTB, a significant lineament aligns with Serra das Flores, demarcating the boundary between the Conservatória and Arcádia Areal units of the Raposo Group, among other parallel features. Moving from the southwest to the northeast corner of the area, near Serra Maravilha, a prominent SW-NE lineament runs parallel to the CTB, delineating the contact between the Rio Negro Complex and the Serra dos Órgãos Suite. Within the Rio Negro Complex region, multiple lineaments deviate from the regional trend, with orientations spanning from W-E to ENE at approximately 20 degrees. Further towards the southeast corner of the area, numerous lineaments exhibit a SW45NE direction, aligning with the boundaries of Serra dos Órgãos. These magnetic lineaments, oriented in the SW-NE direction across the entire are associated with the tectonic collage of paleo-continents and/or island arcs.
Total gradient
The Total Gradient (TG) map (Figure 12) illustrates magnetic intensity ratio values ranging from 0.0082 to 0.0759 nT/m. Remarkably, this map reveals the presence of extensive SW-NE structures, closely aligning with the magnetic lineaments identified on the First Vertical Derivative map.

TG map. Legend: dashed lines – geological unit boundaries (dashed white and red lines), drainage zones (light blue lines), CTB fault (black line), Wells: high U content (white circles), low U content (blue circles) (Godoy et al. 2019) and Siagas well database (black circles).
One elongated body extends towards the urban perimeter region and the surroundings of São José do Vale do Rio Preto, coinciding with the locations of wells contaminated with U. This body is linked to another elongated body oriented in an E-NE direction, which stretches to the eastern boundary of the area and aligns with a magnetic lineament observed on the Dz map and along the CTB. These bodies are situated within the Rio Negro Complex region, as indicated by available geological mapping data.
A second body, resembling a large dyke, is prominent in the southwest corner of the area, corresponding to the Serra Maravilha range. It intersects with the body in the northeastern part of the area, following an E-NE direction. This body extends across the entire region occupied by the Serra dos Órgãos Suite within the study area.
Additionally, another body, parallel to the second one, extends further south of the area in a SW-NE direction. This body shares similar characteristics with the previous ones but traverses portions of the Rio Negro Complex, the Cordeiro Suite, and the Serra dos Órgãos Suite. These bodies appear to delineate lithospheric blocks in this region that underwent suturing during the formation of the Ribeira Belt.
Directional derivative
The First Horizontal Derivative (Dx) map (Figure 13) was employed to highlight the NW-SE magnetic lineaments, indicative of transfer faults. These faults may unveil structural geological features that could potentially influence the migration of water containing high U concentrations towards the contaminated wells. The map displays magnetic intensity ratio values ranging from -0.0057 to 0.0036 nT/m. These delineated faults could stem from crustal folding processes during the amalgamation of paleocontinents and/or island arcs.

Dx map. Legend: dashed lines – geological unit boundaries (dashed white and red lines), drainage zones (light blue lines), CTB fault (black line), Wells: high U content (white circles), low U content (blue circles) (Godoy et al. 2019) and Siagas well database (black circles).
Aligned in the direction of the contaminated wells, these faults might serve as conduits for water transport or could have formed trapping regions (grabens) within valleys. These grabens, observed in the alluvial plains between the elevations of the mountains in the region, could serve as sites for sediment accumulation sourced from the surrounding rocky massifs.
Integrated analysis
In the schematic diagram of the Rio Preto River depicted for the study area (Figure 14), created through the integration of geophysical and well data, two recharge zones are evident: one situated in Serra das Flores and another in Serra do Capim. Conversely, the discharge zone is linked with the Rio Preto valley. Concerning underground flow dynamics, the diagram illustrates two primary mechanisms: firstly, the unconsolidated (granular) aquifer system near the surface, showing potential for eU-related responses based on the interpretation of gamma-ray spectrometry maps. Secondly, a deeper level flow occurs through fractures and discontinuities in the fissured aquifer system. Additionally, the image highlights the presence of a transpressive shear zone along the CTB, which acts as a boundary between Eastern and Western tectonic terrains and plays a crucial role in concentrating underground flows within the region.

Schematic model illustrating underground flow dynamics in the Rio Preto valley, the primary drainage zone in the area. The legend indicates: black lines for geological structures, light blue arrows for rainfall over the recharge zone, green arrows for regional gradient, yellow arrows for underground flow in unconfined aquifers, blue arrows for underground flow in fractured rock aquifer systems, white circles with a cross for U presence, and red polygons for well locations.
CONCLUSIONS
Groundwater dynamics in the Rio Preto valley manifest themselves in two main ways. Firstly, the unconsolidated (granular) aquifer system, characterized by shallow flows, presents a region conducive to uranium-related phenomena, as discerned from interpretations of gamma-ray spectrometry maps, particularly emphasizing the eU/eTh channel. Secondly, the deeper groundwater flow is associated with fractures and discontinuities in the fissured aquifer system, as elucidated by the magnetic map of the First Vertical Derivative. The magnetic results highlight the presence/location as well as the limits of the Central Tectonic Boundary (CTB), coinciding notably with wells that exhibit high levels of uranium contamination. The integration of magnetometric and gamma-ray spectrometry methodologies with geological, hydrogeological and hydrogeochemical datasets facilitated the delineation of lineaments potentially linked to the migration of uranium-contaminated groundwater. This research aims to provide valuable insights for possible urban management endeavors and contribute to the preservation of public health in this region and other geologically analogous ones.
Acknowledgements
This research represents the culmination of two years of intensive graduate work undertaken by the second author as part of the Master’s program in Geophysics at the Observatório Nacional in Rio de Janeiro. We also extend our sincere gratitude to the Graduate Program in Geophysics at the Observatório Nacional for providing the essential infrastructure that supported this study.
References
- ALMEIDA FFM & CARNEIRO CD. 1998. Origem e evolução da Serra do Mar. Rev Bras Geoci 28(2): 135-150.
- BANKS D, ROBINS NS & ROBINS N. 2002. An Introduction to Groundwater in Crystalline Bedrock. Norges Geologiske Undersokelse, Trondheim, Norway.
- BLAKELY RJ. 1995. Potential Theory in Gravity and Magnetic Applications. Cambridge: Cambridge University Press.
- BONOTTO DM. 2004. Radioatividade nas águas: da Inglaterra ao Guarani. São Paulo. Editora UNESP, p. 252.
- BRASIL. 2008. Instituto Nacional de Pesquisas Espaciais (INPE). Topodata: banco de dados geomorfométricos do Brasil. Variáveis geomorfométricas locais. São José dos Campos.
- BRIGGS IC. 1974. Machine contouring using minimum curvature. Geophysics 39(1): 39-48.
- CPRM - SERVIÇO GEOLÓGICO DO BRASIL. 2001. Projeto Rio de Janeiro. Brasília.
- CPRM - SERVIÇO GEOLÓGICO DO BRASIL. 2012. Projeto Aerogeofísico. Rio de Janeiro.
- CPRM - SERVIÇO GEOLÓGICO DO BRASIL. 2022. Rede Integrada de Monitoramento das Águas Subterrâneas, RIMAS. Rio de Janeiro.
-
DEWANDEL B, LACHASSAGNE P, WYNS R, MARECHAL JC & KRISHNAMURTHY NS. 2006. A generalized 3-D geological and hydrogeological conceptual model of granite aquifers controlled by single or multiphase weathering. J Hydrol 330: 260-284. https://doi.org/10.1016/j.jhydrol.2006.03.026.
» https://doi.org/10.1016/j.jhydrol.2006.03.026 - DICKSON BL & SCOTT KM. 1997. Interpretation of Aerial Gamma-Ray Surveys-Adding the Geochemical Factors. J Austr Geol Geophys 17: 187-200.
- FERRARI AL. 2001. Evolução Tectônica do Graben da Guanabara. Tese de Doutorado. Instituto de Geociências, Universidade de São Paulo.
- FRAIFELD F. 2018. Ocorrência de Elementos Radioativos nos Poços Tubulares das Regiões Serrana e Centro-Sul Fluminense do Estado do Rio de Janeiro, 78 p. Trabalho de conclusão de curso. PUC-Rio. Rio de Janeiro. (Unpublished).
-
FUOCO I, MARINI L, DE ROSA R, FIGOLI A, GABRIELE B & APOLLARO C. 2022. Use of reaction path modelling to investigate the evolution of water chemistry in shallow to deep crystalline aquifers with a special focus on fluoride. Sci. Total Environ 830: 154566. https://doi.org/10.1016/j.scitotenv.2022.154566.
» https://doi.org/10.1016/j.scitotenv.2022.154566 - GODOY JM, AMARAL ECS & GODOY ML. 2000. Natural radionuclides in Brazilian mineral water and consequent doses to the population. J Environ Radioact 53: 7.
- GODOY JM, FERREIRA PR, SOUZA EM DE, SILVA LI DA, BITTENCOURT ICS & FRAIFELD F. 2019. High Uranium Concentrations in the Groundwater of the Rio de Janeiro State, Brazil, Mountainous Region. J Braz Chem Soc 30(2): 224-233.
- GODOY JM & GODOY ML. 2005. Natural radioactivity in Brazilian groundwater. J Environ Radioact 85: 13.
- HASUI Y. 2012. Evolução dos Continentes in: Hasui Y, Carneiro CDR, Almeida FFM & Bartorelli A (Eds), Geologia do Brasil - São Paulo: Beca, p. 98-109.
- HEILBRON M ET AL. 2020. Neoproterozoic magmatic arc systems of the central Ribeira belt, SE-Brazil, in the context of the West-Gondwana pre-collisional history: A review. J Souh Am Earth Sci 103: 102710.
- HEILBRON M, EIRADO LG & ALMEIDA J. 2016. Mapa geológico e de recursos minerais do estado do Rio de Janeiro. Belo Horizonte: CPRM, Escala 1:400.000.
- HEILBRON ML, PEDROSA-SOARES AC, CAMPOS NETO MC, SILVA LC, TROUW R & JANASI VA. 2004. Província Mantiqueira. In: Mantesso-Neto VM, Bartorelli A, Carneiro CDR & Brito Neves BB (Eds), Geologia do Continente Sul-Americano. São Paulo: Beca, p. 180-203.
- IAEA - INTERNATIONAL ATOMIC ENERGY AGENCY. 2003. Guidelines for Radioelement Mapping Using Gamma Ray Spectrometry Data. Vienna.
- KEAREY P, BROOKS M & HILL I. 2009. Geofísica de Exploração. São Paulo: Oficina de Textos.
- LI Q & CHENG Q. 2006. VisualAnomaly: A GIS-based multifractal method for geochemical and geophysical anomaly separation in Walsh domain. Comp Geosci 32: 663-672.
- MINTY B. 2011. Short note: on the use of radioelement ratios to enhance gammaray spectrometric data. Expl Geophys 42(1): 116-120.
- MOHRIAK WU. 2004. Recursos energéticos associados à ativação tectônica mesozoico-cenozoica da América do Sul. In: Mantesso-Neto V, Bartorelli A, Carneiro CDR & Brito-Neves BB (Eds), Geologia do Continente Sul-Americano: evolução da obra de Fernando Flávio Marques de Almeida. São Paulo: Beca, p. 293-318.
- MOLINARI BS & ROTUNNO FILHO OC. 2017. Diagnóstico da Qualidade da Água na Bacia do Rio Piabanha/RJ. XXII Simpósio Brasileiro de Recursos Hídricos. ABRH, p. 4.
- PERES F & MOREIRA JC. 2017. Saúde e ambiente em sua relação com o consumo de agrotóxicos em um polo agrícola do Estado do Rio de Janeiro. Cad Saúde Pública 23(4): 612-621.
- RICCOMINI C, SANT’ANNA LG & FERRARI AL. 2004. Evolução geológica do rift continental do Sudeste do Brasil. In: Mantesso-Neto V, Bartorelli A, Carneiro CDR & Neves BBB (Eds), Geologia do continente Sul-Americano: evolução da obra de Fernando Flávio Marques de Almeida. São Paulo: Editora Beca, p. 383-405.
-
ROQUES C, AQUILINA L, BOUR O, MARECHAL JC, DEWANDEL B, PAUWELS H, LABASQUE T, VERGNAUD-AYRAUD V & HOCHREUTENER R. 2014. Groundwater sources and geochemical processes in a crystalline fault aquifer. J Hydrol 519: 3110-3128. https://doi.org/10.1016/j.jhydrol.2014.10.052.
» https://doi.org/10.1016/j.jhydrol.2014.10.052 -
SMEDLEY PL & KINNIBURGH DG. 2023. Uranium in natural waters and the environment: distribution, speciation and impact. Appl Geochem 148: 105534. https://doi.org/10.1016/j.apgeochem.2022.105534.
» https://doi.org/10.1016/j.apgeochem.2022.105534 - TUPINAMBÁ M. 1999. Evolução tectônica e magmática da Faixa Ribeira na região da Serra dos Órgãos, 186 p. Tese de Doutorado, Instituto de Geociências - Universidade de São Paulo, São Paulo.
- TUPINAMBÁ M, TEIXEIRA W, HEILBRON M. 2012. Evolução Tectônica e Magmática da Faixa Ribeira entre o Neoproterozoico e o Paleozoico Inferior na Região Serrana do Estado do Rio de Janeiro, Brasil. Anuário do Instituto de Geociências – UFRJ 35(2): 140-151.


