
 Altimetric Assessment of Topodata in Complex Terrains With GNSS-RTK Validation (Global Navigation Satellite System - Real-Time Kinematic)
Abstract
This study evaluates the altimetric accuracy of the TOPODATA Digital Elevation Model (DEM), derived from the Shuttle Radar Topography Mission (SRTM), through comparison with GNSS-RTK data in an area of high topographic variability. The analysis was conducted in Cachoeira do Lepa, located in the municipality of Canguçu, Rio Grande do Sul (Brazil), a region characterized by pronounced altimetric breaks over short distances. A total of 306 georeferenced points were used, and spatial statistical analyses were applied. The results revealed systematic discrepancies, with a tendency of the TOPODATA to underestimate elevations, showing a mean bias error (MBE) of 3.15 m, mean absolute error (MAE) of 3.57 m, and root mean square error (RMSE) of 4.33 m. Spatial autocorrelation was significant (Moran’s I = 0.771; p < 0.001), reducing the effective degrees of freedom (Dutilleul: 120.4) and requiring robust tests (Brunner-Munzel: p < 0.0001; Cliff’s Delta = 0.60). Accuracy varied with elevation: low-lying areas presented an MBE of 0.75 m, while higher terrains reached 6.02 m (Kruskal-Wallis: p < 0.0001). Spatial cross-validation indicated an RMSE of 5.18 m (95% CI: 3.68-6.30 m), and Spearman’s correlation was weak (ρ = -0.077; p = 0.125). It is concluded that TOPODATA tends to underestimate elevations, with larger errors in higher terrains, limiting its reliability for micro-scale applications. The study highlights the methodological risks of using generalized DEMs in morphologically complex regions and suggests hybrid approaches supported by field data as an alternative. The findings align with the United Nations Sustainable Development Goals (SDGs), particularly in the context of precision agriculture, sustainable urban planning, and climate action.
Keywords:
Statistical Analysis; GIS; Altimetric accuracy; Digital Elevation Models (DEMs)
Resumo
Este estudo avalia a precisão altimétrica do Modelo Digital de Elevação (MDE) TOPODATA, derivado do Shuttle Radar Topography Mission (SRTM), por meio de comparação com dados GNSS - RTK em área de elevada variabilidade topográfica. A análise foi conduzida na Cachoeira do Lepa, Município de Canguçu/RS, região caracterizada por acentuadas rupturas altimétricas em curtas distâncias. Foram utilizados 306 pontos georreferenciados e aplicadas análises estatísticas espaciais. Os resultados evidenciaram discrepâncias sistemáticas: com tendência à subestimação das altitudes pelo TOPODATA: altitudes médias 3,15 m (MBE), com erro absoluto médio (MAE) de 3,57 m e raiz do erro quadrático médio (RMSE) de 4,33 m. A autocorrelação espacial foi significativa (Moran’s I = 0,771; p < 0,001), reduzindo os graus de liberdade efetivos (Dutilleul: 120,4) e exigindo testes robustos (Brunner-Munzel: p < 0,0001; Cliff’s Delta = 0,60). A acurácia variou com a altitude: áreas baixas tiveram MBE de 0,75 m, enquanto áreas altas alcançaram 6,02 m (Kruskal-Wallis: p < 0,0001). A validação cruzada espacial indicou RMSE de 5,18 m (IC95%: 3,68-6,30 m), e a correlação de Spearman foi fraca (ρ = -0,077; p = 0,125). Conclui-se que o TOPODATA tende a subestimar as elevações, apresentando maiores erros em terrenos mais elevados, o que compromete sua confiabilidade em aplicações microescala. O estudo destaca os riscos metodológicos do uso de MDEs generalizados em áreas morfologicamente complexas e sugere metodologias híbridas com apoio de dados de campo como alternativa. Os achados relacionam-se aos Objetivos de Desenvolvimento Sustentável da ONU, especialmente no contexto da agricultura de precisão, planejamento urbano sustentável e ação climática.
Palavras-chave:
Análise Estatística; SIG; Precisão Altimétrica; Modelos Digitais de Elevação (MDEs)
INTRODUCTION
Accurate representation of the Earth's surface through Digital Elevation Models (DEMs) is essential for geotechnologies, environmental planning, and hydrological and geomorphological modeling. These tools have revolutionized geosciences by enabling three-dimensional representations that enhance understanding of physical processes and support territorial management. Their applications also encompass 3D flight planning, navigation, autonomous driving, precision agriculture, forest management, and hydrological modeling, all demanding high-accuracy three-dimensional data (Cao et al., 2024; Li et al., 2024).
The generation of Digital Elevation Models (DEMs) from single images presents technical and methodological limitations, exacerbated in urban and mountainous areas, where altimetric accuracy depends on spatial resolution and is compromised by steep terrain or dense vegetation (Panagiotou et al., 2020; Xu et al., 2024; Kramm; Hoffmeister, 2022; Li et al., 2023; Zhu; Chen, 2024). Furthermore, self-similarity constraints and costs (Yin et al., 2021) drive research into methodological alternatives, such as interpolation (Polidori; El Hage, 2020), use of UAVs in multispectral surveys (Csajbók et al., 2022), and ground control points (Akturk; Altunel, 2019).
Recent advances include the NASA Ames Stereo Pipeline (Shean et al., 2016), machine learning techniques (Yang et al., 2024), adversarial neural networks for super-resolution (Zhang; Yu, 2022), and the GADEM Network, capable of generating high-quality DEMs from satellite imagery (Yang et al., 2024). Accessible tools such as Google Earth Pro have also been explored, although they still require validation across different environmental contexts (George; Mohan, 2024).
Several freely available Digital Elevation Model (DEM) databases are widely utilized in the scientific community, as highlighted by Pakoksung and Takagi (2021), including GSI-DEM, ASTER Global DEM, SRTM, GMTED2010, HydroSHEDS, and GTOPO30.
In the Brazilian context, TOPODATA, developed by Valeriano (2008) at the INPE - Instituto Nacional de Pesquisas Espaciais (National Institute for Space Research), consists of a refinement of the original SRTM data (resolution of approximately 90 m and absolute vertical accuracy of 6.2 m) through kriging techniques, resulting in a digital elevation model with a nominal resolution of 30 m (1 arc second). Widely recognized as one of the most accurate freely available altimetric databases at regional scale (Bielski et al., 2024), TOPODATA presents a vertical root mean square error (RMSE) of approximately 6 m, a value consistent with previous studies (Valeriano; Munoz, 2011; Morais, 2017; Muñoz; Valeriano, 2011).
However, the intensification of anthropogenic interventions on relief reinforces the need for more updated and detailed digital elevation models, particularly in urban areas where topographic complexity is more pronounced (Delchiaro et al., 2025).
Regarding the spatial resolution of widely used free Digital Elevation Models (DEMs), the typical resolution of these global DEMs, such as SRTM and ASTER, is approximately 30 meters, suitable for regional and continental applications. TOPODATA, a database extensively employed in Brazil, is an SRTM derivative that underwent specific refinement using geostatistical kriging techniques to improve accuracy at regional scale (Moura-Bueno et al., 2016; Valeriano, 2005).
Concurrently, various free DEM databases are widely utilized in the scientific community, as highlighted by Pakoksung and Takagi (2021), including GSI-DEM, ASTER Global DEM, SRTM, GMTED2010, HydroSHEDS, and GTOPO30. In Brazil, TOPODATA stands out, developed from SRTM with kriging refinement, and frequently indicated as one of the most accurate freely available databases at regional scales (Bielski et al., 2024).
The accuracy of digital elevation models (DEMs) strongly depends on terrain type and application scale, being limited in areas of high altimetric variability, such as scarps, steep slopes, and confined valleys, where moderate-resolution models such as TOPODATA, with spatial resolution of 30m, may fail to represent critical relief features (Kramm; Hoffmeister, 2019; Ferreira et al., 2023). In this context, the present study conducts a comparative analysis between data obtained through the RTK satellite-based spatial positioning methodology and data derived from TOPODATA remote sensing, evaluating altimetric discrepancies across different elevation classes. The objective is to highlight the methodological risks of utilizing generalized models at local scales, especially in morphologically complex scenarios, and discuss their implications for environmental modeling, territorial planning, and high-precision applications. The research addresses the systematic underestimation of microscale altimetry by radar-derived models and reinforces the need for hybrid methodologies that integrate remote data and field measurements, contributing to applications aligned with the Sustainable Development Goals, such as precision agriculture (SDG 2), sustainable cities (SDG 11), and climate action (SDG 13).
METHODOLOGY
Study Area
The study was conducted in the municipality of Canguçu, located in the southeastern region of Rio Grande do Sul, Brazil, within the microregion and immediate region of Pelotas. The municipality covers 3,526.316 km² and presents varied relief, with plains, hills, and hills over the South-Rio-Grandense Shield (IBGE, 2025). The substrate is composed of granitic and metagranitic rocks from the Pelotas Batholith, with Neosols, Argisols, and Luvisols. The area exhibits a dense drainage network and predominance of native grasslands and arboreal vegetation, interspersed with agricultural areas and silviculture (Dutra, 2021).
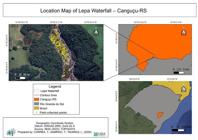
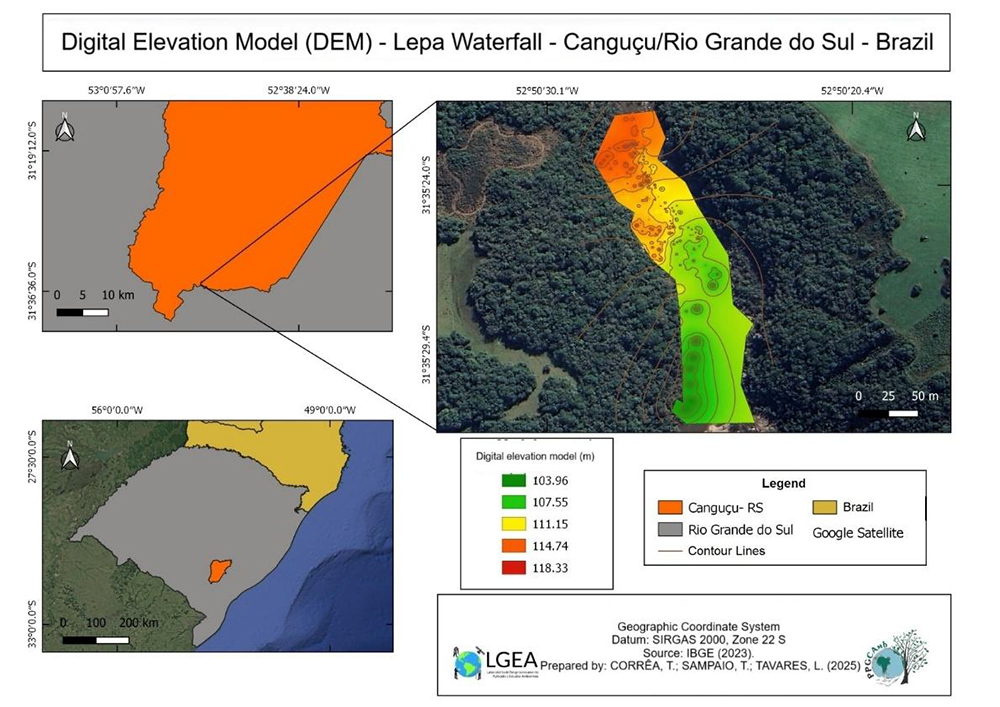
The locality known as “Cachoeira do Lepa” (Lepa Waterfall), of geomorphological and environmental relevance, was selected due to its altimetric variability and natural formations that affect the accuracy of Digital Elevation Models (DEMs) (Figure 1). The region allows comparison between DEMs derived from RTK and TOPODATA, evaluating discrepancies and statistically validating the models. The integration of field data and remote sensing enables robust analysis of the limitations and potentialities in Earth surface modeling.
Collection Methods
Altimetric Data Collection and Digital Elevation Model Generation
For this study, the geodetic positioning of the point used as the base station was initially determined through the Precise Point Positioning (PPP) method. This procedure was performed from field-collected data in "Rinex" format, subsequently submitted to post-processing, ensuring the definition of absolute coordinates with high precision. The Base station was installed at a strategically selected location, away from potential interferences such as dense vegetation or physical barriers, to ensure adequate reception of orbital signals.
With the Base coordinates defined by PPP, the real-time survey stage was conducted using the GNSS-RTK technique. Two GNSS receivers configured for communication via UHF (Ultra High Frequency) radio were employed, allowing continuous transmission of differential corrections from the Base to the Rover receiver. The equipment used operates on multiple frequencies (L1 and L2), which provides centimeter-level positioning accuracy (Henkel; Gunther, 2008; Mongredien et al., 2016).
This high relative precision is ensured by the application of Real-Time Kinematic (RTK) positioning, which uses simultaneous carrier phase observations and performs real-time double differencing, correcting systematic errors common to both receivers (Shin et al., 2024). Thus, the accurate definition of the geodetic coordinates of the Base point is an essential step, as it guarantees the reliability of differential corrections transmitted to the Rover receiver and, consequently, the quality and robustness of the geospatial information produced in the survey.
The rover receiver was configured to collect data at intervals of 0 to 5 seconds, according to signal conditions and operator movement, recording coordinates of points of interest through walking traverse to map the topographic profile of Cachoeira do Lepa. The sampling, dense and precise, followed the longitudinal and transverse altimetry of the watercourse, highlighting features of the Earth's surface. The methodology employed Real-Time Kinematic Relative Positioning (RTK), ensuring high geodetic precision.
Selected Remote Sensing Platforms
For the comparison of Digital Elevation Models (DEMs), raster images made available on the interactive map of the TOPODATA project - Geomorphometric Database of Brazil were used, identifying that the study area corresponds to scene 31S54. Processing was performed in QGIS 3.40.2 software (QGIS Development Team, 2025), where the area was clipped based on the Cachoeira do Lepa shapefile, adopting the SIRGAS 2000/UTM zone 22S reference system. Subsequently, specific rendering was applied to the clipped raster, that is, a form of visual representation that associates colors with altitude values, enabling the identification of maximum and minimum altitudes of the area.
Data Processing Steps for Statistical Analysis
The statistical analysis conducted in this study had as its main objective to compare the precision and accuracy of elevations obtained by the GNSS-RTK and TOPODATA methods. To achieve this objective, several steps were followed. Initially, elevation data from the GNSS-RTK method, collected at Cachoeira do Lepa, in Canguçu/RS (Rio Grande do Sul), on 12/12/2024, together with those obtained from the Geomorphometric Database of Brazil, were organized in a database (xls file). Subsequently, these data underwent a cleaning and standardization process to ensure the quality of the analysis. The coordinates of each point (North and East) were recorded in UTM (Universal Transverse Mercator), in meters, (WGS 84 - UTM 22S), according to Table 1.
An exploratory data analysis was performed, examining the variation of the two-dimensional and three-dimensional Root Mean Square Error (RMSE), with the objective of identifying possible inconsistencies and evaluating the spatial distribution of sample points. From this assessment, it was possible to obtain an integrated view of the positional quality of the survey and the geographic organization of samples in the terrain. Additionally, spatial outliers were detected based on statistical criteria applied to residuals, allowing the identification of points whose behavior deviated significantly from the pattern observed in the local neighborhood. Spatial outliers were detected by statistical criteria applied to residuals, identifying points with anomalous behavior in relation to the local neighborhood.
To analyze spatial autocorrelation, considering the geographic nature of the data, Moran's test (Anselin, 1995) was applied to the residuals, verifying the presence of spatial dependence. Furthermore, Moran's Index was calculated on the altimetric differences "(data['Diferenca'])" to quantify the general spatial autocorrelation present in the error. Subsequently, semivariogram analysis of "detrended residuals" was employed to investigate the remaining spatial structure after removal of a modeled spatial trend, offering a robust approach to understand the intrinsic nature of the error. In summary, the "residuals" represent the portion of error not explained by a large-scale spatial trend, allowing a detailed analysis of altimetric discrepancies between TOPODATA project data and field data obtained by GNSS-RTK.
With the objective of adjusting statistical tests in the presence of spatial autocorrelation, Dutilleul's method (1993) was used, which corrects effective degrees of freedom, considering the spatial dependence of the data. The evaluation of altimetric precision was performed through the following metrics:
-
Mean Bias Error (MBE) for quantification of systematic bias.
-
Mean Absolute Error (MAE) for mean absolute error.
-
Root Mean Square Error (RMSE) for root mean square error.
-
Spearman's correlation coefficient for monotonic association.
The normality of residuals was tested using the Kolmogorov-Smirnov test with Lilliefors correction, while homoscedasticity, used to verify whether the residual errors have constant variance across observations, was assessed by Levene's test, with data stratified into elevation groups (low, medium, and high).
This structured process allowed a comprehensive and statistically robust analysis of altimetric discrepancies, considering both spatial dependence and the statistical properties of residuals.
Stratified Analysis by Elevation
The data were stratified into three elevation groups of equal size (n=102 each) to investigate variations in altimetric precision as a function of relief. Comparison between groups was performed through the Kruskal-Wallis non-parametric test (Rahrig, 2024), followed by post-hoc Mann-Whitney tests with Bonferroni correction for multiple comparisons.
Effect size was quantified through Cliff's Delta (Cliff, 1993), which provides a robust measure of the magnitude of differences between ordinal groups.
Spatial Cross-Validation
The robustness of results was evaluated by spatial cross-validation, considering data autocorrelation, according to Roberts et al. (2017). The leave-one-out technique was used to analyze the individual influence of sample points.
Uncertainty Analysis
Uncertainty was quantified by spatial bootstrap with 1,000 iterations, calculating means and standard deviations with 95% confidence intervals. Monte Carlo simulation (10,000 iterations) generating confidence intervals for the mean. Expanded uncertainties calculated with coverage factors for 90%, 95%, and 99% based on standard uncertainty.
RESULTS AND DISCUSSION
Spatial Analysis
RTK-Inferred Analysis
The GNSS-RTK methodology applied for acquisition of altimetric coordinates provided high precision, resulting in reliable topographic detailing of the study area. The generation of the detailed altimetric model was enabled by the GNSS methodology, which, by applying the RTK technique, allows rapid acquisition of coordinates of points of interest with centimeter-level precision. A total of 306 altimetric points were collected through GNSS-RTK equipment, with a preview of them shown in Table 2.
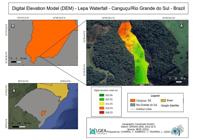
Based on the altimetric data obtained in the field, the Digital Elevation Model (DEM) of the study area was generated (Figure 2). Data analysis revealed a minimum elevation of 103.96 m and a maximum elevation of 118.33 m. Thus, the altimetric variation of Cachoeira do Lepa, determined through GNSS-RTK survey, resulted in an elevation difference of 14.37 m.
Remote Sensing Inferential Analysis
With the planimetric coordinates previously determined in the field through GNSS-RTK, it was possible to extract, from the Digital Elevation Model (DEM), the altimetric values corresponding to the same points. This procedure allowed the performance of a comparative statistical analysis between different DEM acquisition methods, aiming to evaluate their altimetric accuracy and consistency between the generated surfaces.
The altitudes obtained from TOPODATA images, presented in Table 3, resulted in the following values:
The TOPODATA dataset, developed by INPE through resampling of SRTM data using the kriging method, generated a Digital Elevation Model (DEM) with spatial resolution of 30 meters. Although efficient at regional scale, this resolution limits detailed analyses in small areas. In the studied area, elevations between 95.84 m and 128.30 m were identified, with an elevation difference of 32.46 m (Figure 3), evidencing altimetric variations that impact the accuracy of relief representation.
It should be noted that elevations around 113.11 meters represent specific points in the area, whose relative frequency is statistically not very expressive compared to the totality of the analyzed territory. This heterogeneous altimetric distribution reinforces the model's limitations in capturing local topographic nuances, especially in studies demanding greater spatial accuracy.

Statistical Analysis
Statistical analysis plays a fundamental role in the interpretation of georeferenced data, allowing identification of spatial patterns, discrepancies, and correlations between variables of interest. In the present study, 306 observations were analyzed, organized in corresponding columns: Point, North, East, GNSS-RTK Method, and TOPODATA 30m Method. These variables provide a robust basis for evaluating the precision and consistency of elevation measurements obtained in the field (via GNSS-RTK) and by remote sensing (TOPODATA data).
The analyses were performed in Python, in the PyCharm Community Edition 2024.1.3 IDE (development environment) (free version) (JetBrains, 2025), using distinct libraries such as: Pandas for data manipulation, NumPy for numerical calculations, and SciPy for statistical tests, including normality, comparisons between measurements and confidence intervals, among others.
-
General Data:
-
Total observations: 306.
-
Columns: Point, North, East, GNSS-RTK Method, and TOPODATA 30m Method.
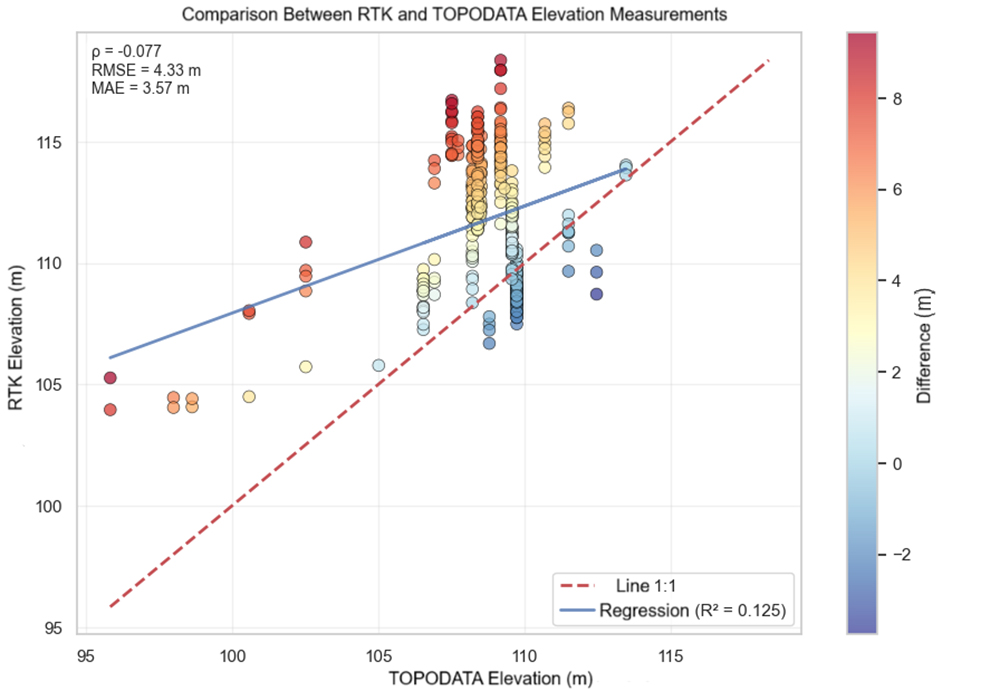
The comparative analysis between GNSS-RTK and TOPODATA data revealed significant systematic differences. The mean difference (MBE) was 3.15 ± 2.98 m, indicating a tendency for TOPODATA to underestimate elevations relative to those obtained with the GNSS-RTK method. Figure 4 presents the scatter plot between the two datasets, evidencing the low linear correlation between methods.

Table’s 4 and 5 demonstrate some of the resulting values from the statistical analysis performed:
The analysis of Figure 4 and Box 1 shows a practically null correlation (Spearman ρ = -0.077) between GNSS-RTK and TOPODATA elevations, indicating absence of a clear monotonic relationship. The low coefficient of determination (R2 = 0.125) of the linear regression confirms TOPODATA's weak capacity to predict elevations compared to the GNSS-RTK methodology. Mean errors (MAE = 3.57 m; RMSE = 4.33 m) reveal significant discrepancies. The coloring of points indicates systematic underestimation by TOPODATA, with asymmetric dispersion above the 1:1 line, especially between 108-112 meters, suggesting TOPODATA limitations in areas of low altimetric variation, requiring caution in high-precision applications.
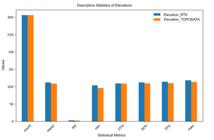
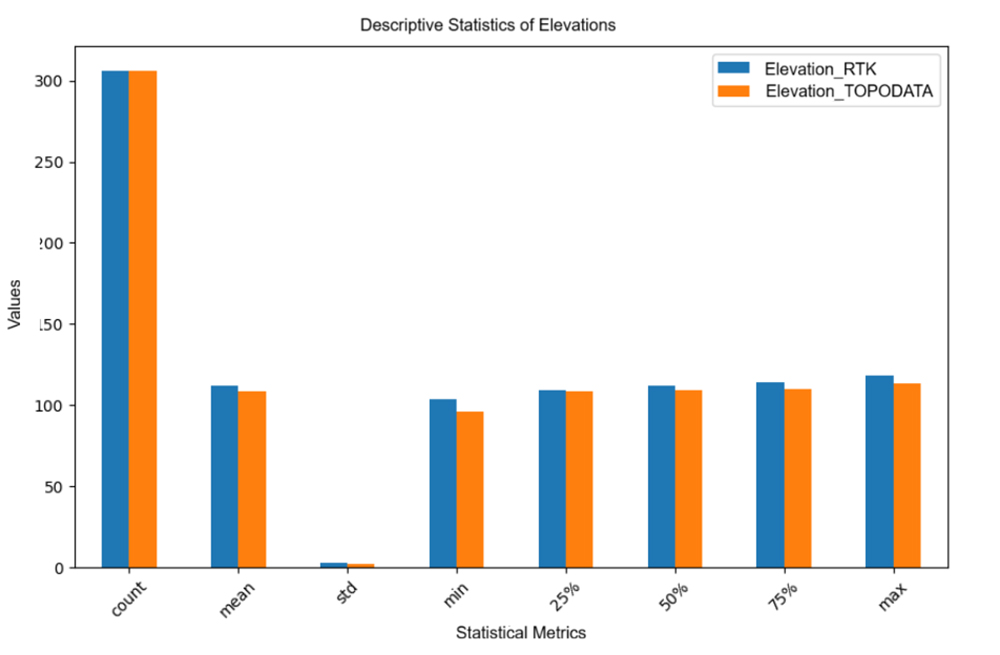
In Figure 5, the comparison of descriptive statistics evidences similar means between datasets, although GNSS-RTK presents higher standard deviation, indicating greater sensitivity to local variations. The TOPODATA model, in turn, tends to smooth topography, reducing the amplitude of elevations and the ability to represent detailed topographic features.
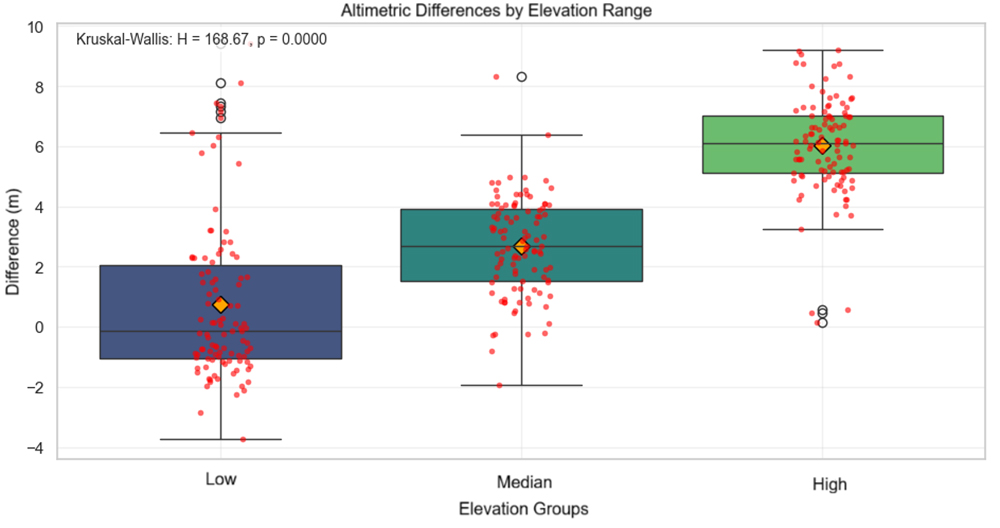
The analysis of altimetric differences in elevation classes (Figure 6) revealed progressive increase in discrepancy between methods with altitude, characterizing increasing TOPODATA underestimation at higher elevations. The Kruskal-Wallis test confirmed statistically significant differences between groups (H = 168.67; p < 0.0001), indicating that error magnitude varies according to altimetric class. In the low elevation range, differences were close to zero with relatively symmetric distribution, while in the medium and high ranges pronounced positive bias was observed, reflecting systematic underestimation by the TOPODATA altimetric model.
These results highlight the importance of considering altimetric dependence when evaluating the accuracy of digital elevation models in areas with more pronounced topographic variations.

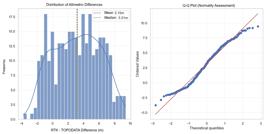
The distribution of altimetric differences between data obtained by GNSS-RTK and the TOPODATA model is presented in Figure 7. The histogram with density curve (left) reveals that discrepancies are concentrated mainly around a mean of 3.15m and median of 3.21m, evidencing an approximately symmetric distribution, but with slight negative skewness. Despite the proximity between mean and median, the presence of extreme values indicates a tendency toward leptokurtosis.
The Q-Q Plot (right) confirms this observation by demonstrating that, although most values follow the expected normal distribution, there are significant deviations in the distribution tails. Such deviations suggest the presence of outliers and violation of the normality assumption, which justifies the adoption of non-parametric statistical tests in subsequent analyses. These results reinforce that, although the distribution of altimetric differences is relatively centered, it cannot be considered rigorously normal.
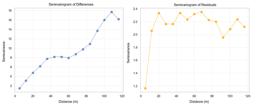
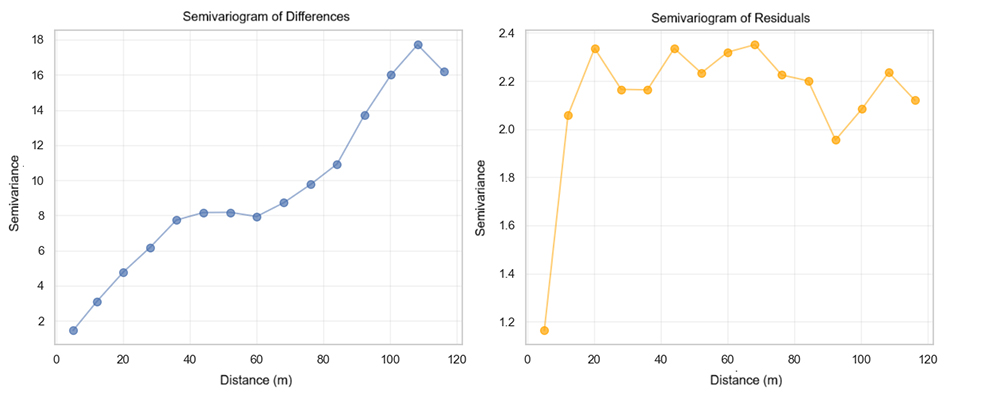
The analysis of the spatial structure of altimetric differences was performed through experimental semivariograms (Figure 8). The semivariogram of differences (left side of Figure 8) revealed increased semivariance with distance, indicating positive spatial dependence. The residual semivariogram (right), on the other hand, presented stationary behavior, suggesting absence of significant spatial autocorrelation, the remaining variations are random, and the main spatial patterns were captured by the model.
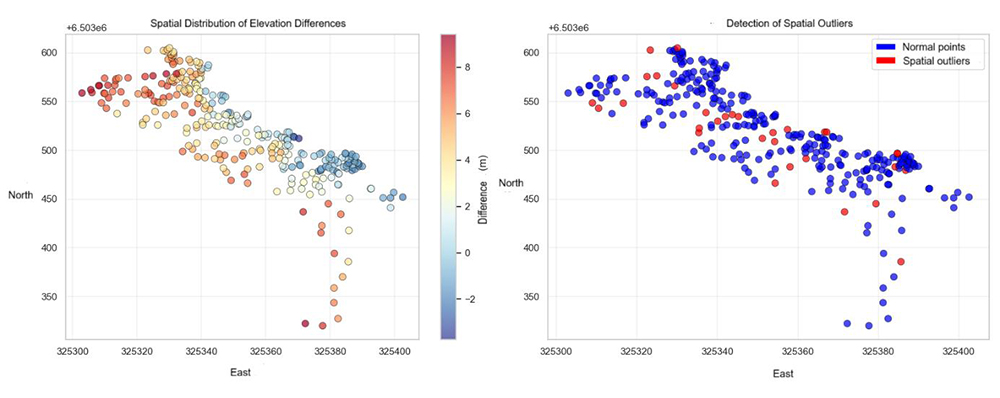
From Figure 9, which presents the spatial distribution of altimetric differences between RTK data and the TOPODATA model (left), as well as the detection of spatial outliers (right), a clear spatial structure is observed in the discrepancies, with clusters of higher values concentrated in specific regions, especially in the southwestern portion of the study area. On the other hand, areas with smaller or negative differences are located predominantly in the northeastern part of the spatial domain.
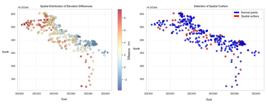
Spatial outlier analysis reveals that errors are not randomly distributed but occur preferentially in transition zones or areas of greater local variability, indicating the presence of pronounced localized inconsistencies.
The results evidenced systematic altimetric discrepancies between the TOPODATA model and GNSS-RTK data, with more pronounced underestimation in elevated areas. This behavior, widely reported in the literature, is related to the limited low spatial resolution of radar-derived DEMs, which tend to smooth abrupt features and reduce accuracy in complex terrains (Chang; Tsai, 1991). This effect can affect hydrological simulations, although impacts vary: some studies indicate underestimation of flow peaks in high-resolution models (Goldstein et al., 2016), while others observed stability in water balance, except at very coarse resolutions (Bormann, 2006).
In the present study, mean errors (MBE = 3.15 m; RMSE = 4.33 m) corroborate such limitations, reinforcing that moderate-resolution models are inadequate for microscale analyses. These findings, analogous to international research, emphasize the risks of indiscriminate use of radar-derived DEMs in complex terrains and point to the need for calibration, systematic corrections, or adoption of hybrid models.
CONCLUSION
This study evidenced that the use of the TOPODATA model in microscale analyses, such as in the investigated area, generates systematic and spatially correlated errors that exceed simple point altimetric imprecisions. The results point to a consistent underestimation bias (MBE = 3.15 m), which intensifies in higher altitude regions, revealing altimetric dependence of the error. More relevant than the magnitude of absolute error (RMSE = 4.33 m) is the practical absence of correlation (Spearman's ρ ≈ -0.08) between TOPODATA and GNSS-RTK altitudes, indicating that the model cannot faithfully reproduce the variability and structure of relief. This limitation is reinforced by excessive terrain smoothing, resulting from its 30 m spatial resolution, which eliminates features that promote homogenization of the topographic surface and eliminates critical local relief features.
Such constraints call into question TOPODATA's applicability for purposes demanding high geometric precision or sensitivity to topographic dynamics. In the context of Engineering and Urban Planning (SDG 11), cut and fill calculations, drainage projects, and risk mapping can be seriously compromised. In Precision Agriculture (SDG 2), practices such as irrigation management and localized input application, which depend on detailed understanding of water flow, tend to be compromised by the model's limited spatial and vertical resolution. Similarly, in Environmental Modeling (SDG 13 and 15), low accuracy compromises the representation of drainage networks and slopes, potentially leading to underestimation of flow peaks or erroneous delineation of preservation areas.
Therefore, although TOPODATA maintains its utility for regional syntheses and macroscales, its use at local scale must be preceded by an important caveat. The presented results dialogue with the SDGs not only through direct mention but especially by warning about the risks of uncritical use of public geoinformation databases in decision-making (SDG 9). The solution does not lie in abandoning remote sensing but in adopting hybrid methodologies that integrate field validation and calibration of global models from high-precision geodetic data, in order to correct the identified systematic biases. Such an approach represents the most consistent path to meet technical demands and effectively contribute to the fulfillment of the SDGs.
DATA AVAILABILITY
The data that support the findings of this study can be made available, upon reasonable request, from the corresponding author [Tássia Parada Sampaio].
References
-
AKTURK, E.; ALTUNEL, A. O. Accuracy assessment of a low-cost UAV derived digital elevation model (DEM) in a highly broken and vegetated terrain. Measurement, v. 136, p. 382-386, 2019. https://doi.org/10.1016/j.measurement.2018.12.101
» https://doi.org/10.1016/j.measurement.2018.12.101 -
ANSELIN, L. Local Indicators of Spatial Association-LISA. Geographical Analysis, v. 27, n. 2, p. 93-115, 1995. https://doi.org/10.1111/j.1538-4632.1995.tb00338.x
» https://doi.org/10.1111/j.1538-4632.1995.tb00338.x -
BIELSKI, C.; LÓPEZ-VÁZQUEZ, C.; GROHMANN, C. H.; GUTH, P. L.; HAWKER, L.; GESCH, D.; TREVISANI, S. Novel Approach for Ranking DEMs: Copernicus DEM Improves One Arc Second Open Global Topography. IEEE Transactions on Geoscience and Remote Sensing, v. 62, p. 1-22, 2024. https://doi.org/10.1109/TGRS.2024.3368015
» https://doi.org/10.1109/TGRS.2024.3368015 -
BORMANN, H. Impact of spatial data resolution on simulated catchment water balances and model performance of the multi-scale TOPLATS model. Hydrology and Earth System Sciences, v. 10, n. 2, p. 165-179. 2006. https://doi.org/10.5194/hess-10-165-2006
» https://doi.org/10.5194/hess-10-165-2006 -
Cao, X.; Liu, Z.; Hu, C.; Song, X.; Quaye, J.; Lu, N. Three-Dimensional Geological Modelling in Earth Science Research: An In-Depth Review and Perspective Analysis. Minerals, 2024. https://doi.org/10.3390/min14070686CHANG
» https://doi.org/10.3390/min14070686CHANG -
CHANG, K; TSAI, B. The Effect of DEM Resolution on Slope and Aspect Mapping. Cartography and Geographic Information Systems, v. 18, n. 1, p. 69-77, 1991. https://doi.org/10.1559/152304091783805626
» https://doi.org/10.1559/152304091783805626 -
CLIFF, N. Dominance Statistics: Ordinal Analyses to Answer Ordinal Questions. Psychological Bulletin, p. 494-509, 1993. https://doi.org/10.1037/0033-2909.114.3.494
» https://doi.org/10.1037/0033-2909.114.3.494 -
CRUZ, J. P. Bioestatística. 2019. Disponível em: https://sweet.ua.pt/pedrocruz/bioestatistica/an-ks.html#gsc.tab=0 Acesso em: 15 jan. 2025.
» https://sweet.ua.pt/pedrocruz/bioestatistica/an-ks.html#gsc.tab=0 -
CRUZ, J.; BUDAY-BÓDI, E.; NAGY, A.; FEHÉR, Z. Z.; TAMÁS, A.; VIRÁG, I. C.; BOJTOR, C.; FORGÁCS, F.; VAD, A. M.; KUTASY, E. Multispectral Analysis of Small Plots Based on Field and Remote Sensing Surveys-A Comparative Evaluation. Sustainability, v. 14, n. 6, 3339, 2022. https://doi.org/10.3390/su14063339
» https://doi.org/10.3390/su14063339 -
CSAJBÓK, J.; BUDAY-BÓDI, E.; NAGY, A.; FEHÉR, Z. Z.; TAMÁS, A.; VIRÁG, I. C.; BOJTOR, C.; FORGÁCS, F.; VAD, A. M.; KUTASY, E., 2022. Multispectral Analysis of Small Plots Based on Field and Remote Sensing Surveys-A Comparative Evaluation. Sustainability , v. 14, n. 3339. https://doi.org/10.3390/su14063339
» https://doi.org/10.3390/su14063339 -
DALPOSSO, G. H. Método Bootstrap na agricultura de precisão. 2017. 90 f. Tese (Doutorado em Engenharia Agrícola) - Universidade Estadual do Oeste do Paraná, Cascavel, 2017. Disponível em: https://tede.unioeste.br/handle/tede/3075 Acesso em: 17 jul. 2025.
» https://tede.unioeste.br/handle/tede/3075 -
DELCHIARO, M.; VERGARI, F.; ESPOSITO, C.; DEL MONTE, M. The influence of anthropogenic topographic changes on geomorphological processes in the city of Rome (Italy): A case study of the Malagrotta area. Earth Surface Processes and Landforms, v. 50, n. 3, e70033, 2025. https://doi.org/10.1002%2Fesp.70033
» https://doi.org/10.1002%2Fesp.70033 -
DONG, X.; GARRATT, M. A.; ANAVATTI, S. G.; ABBASS, H. A. Towards Real-Time Monocular Depth Estimation for Robotics: A Survey. IEEE Transactions on Intelligent Transportation Systems, v. 23, n. 10, p. 16940-16961, 2022. https://doi.org/10.48550/arXiv.2111.08600
» https://doi.org/10.48550/arXiv.2111.08600 -
DUTILLEUL, P.; CLIFFORD, P.; RICHARDSON, S.; HEMON, D. Modifying the t Test for Assessing the Correlation Between Two Spatial Processes. Biometrics, v. 49, n. 1, p. 305, 1993. https://doi.org/10.2307/2532625
» https://doi.org/10.2307/2532625 - DUTRA, D. da S. Caracterização e zoneamento geoambiental do município de Canguçu/RS. 2021. 278 f. Dissertação (Mestrado em Geografia) - Universidade Federal do Rio Grande do Sul, Porto Alegre, 2021.
-
FERREIRA, Z.; COSTA, A. C.; CABRAL, P. Analysing the spatial context of the altimetric error pattern of a digital elevation model using multiscale geographically weighted regression. European Journal of Remote Sensing, v. 56, n. 1, 2260092, 2023. https://doi.org/10.1080/22797254.2023.2260092
» https://doi.org/10.1080/22797254.2023.2260092 -
FRANÇA, L. Decifrando o RINEX: o formato aberto para o posicionamento GNSS. 2024. Disponível em: https://geoone.com.br/sobre-rinex /. Acesso em: 30 jun. 2025.
» https://geoone.com.br/sobre-rinex -
GEORGE, C.; MOHAN, K. Digital Elevation Model (DEM) from Google Earth Pro and Freely Downloadable DEMs - A Case Study. Scholars Journal of Engineering and Technology, v. 12, n. 8, p. 263-266, 2024. https://doi.org/10.36347/sjet.2024.v12i08.002
» https://doi.org/10.36347/sjet.2024.v12i08.002 -
GOLDSTEIN, A.; FOTI, R.; MONTALTO, F. Effect of Spatial Resolution in Modeling Stormwater Runoff for an Urban Block. Journal of Hydrologic Engineering, v. 21, n. 11, 2016. https://doi.org/10.1061/%28ASCE%29HE.1943-5584.0001377
» https://doi.org/10.1061/%28ASCE%29HE.1943-5584.0001377 -
GOMES, F. C. M.; ZAIDAN, R. T.; ROCHA, C. H. B. Análise comparativa entre a aplicação de métodos de interpolação, para a geração de modelos digitais de elevação. Revista Brasileira de Geografia Física, v. 15, n. 5, p. 2448-2462, 2022. https://doi.org/10.26848/rbgf.v15.5.p2448-2462
» https://doi.org/10.26848/rbgf.v15.5.p2448-2462 -
GUTH, P. L.; VAN NIEKERK, A.; GROHMANN, C. H.; MULLER, J. P.; HAWKER, L.; FLORINSKY, I. V.; GESCH, D.; REUTER, H. I.; HERRERA-CRUZ, V.; RIAZANOFF, S.; LÓPEZ-VÁZQUEZ, C.; CARABAJAL, C. C.; ALBINET, C.; STROBL, P. Digital Elevation Models: Terminology and Definitions. Remote Sensing, v. 13, n. 18, p. 3581, 2021. https://doi.org/10.3390/rs13183581
» https://doi.org/10.3390/rs13183581 -
HENKEL, P.; GUNTHER, C. Precise point positioning with multiple Galileo frequencies. 2008. 2008 IEEE/ION Position, Location and Navigation Symposium, Monterey, CA, USA. 2008. p. 592-599, https://doi.org/10.1109/PLANS.2008.4570102
» https://doi.org/10.1109/PLANS.2008.4570102 -
INSTITUTO BRASILEIRO DE GEOGRAFIA E ESTATÍSTICA (IBGE). Canguçu - RS: panorama. Cidades@, 2025. Disponível em: https://cidades.ibge.gov.br/brasil/rs/cangucu/panorama Acesso em: 11 nov. 2025.
» https://cidades.ibge.gov.br/brasil/rs/cangucu/panorama -
JETBRAINS. PyCharm: The only Python IDE you need. 2025. Disponível em: https://www.jetbrains.com/pycharm /. Acesso em: 11 nov. 2025.
» https://www.jetbrains.com/pycharm -
KRAMM, T.; HOFFMEISTER, D. Comprehensive vertical accuracy analysis of freely available DEMs for different landscape types of the Rur catchment, Germany. Geocarto International, v. 37, n. 25, p. 7774-7799, 2022. https://doi.org/10.1080/10106049.2021.1984588
» https://doi.org/10.1080/10106049.2021.1984588 -
KRAMM, T.; HOFFMEISTER, D. A Relief Dependent Evaluation of Digital Elevation Models on Different Scales for Northern Chile. ISPRS International Journal of Geo-Information, v. 8, n. 10, p. 430, 2019. https://doi.org/10.3390/ijgi8100430
» https://doi.org/10.3390/ijgi8100430 -
LI, D.; LI, B.; FENG, H.Q.; KANH, S.; WANG, J.; WEI, Z. Low-altitude remote sensing-based global 3D path planning for precision navigation of agriculture vehicles - beyond crop row detection. ISPRS Journal of Photogrammetry and, 2024. Disponível em: https://api.semanticscholar.org/CorpusID:268307684 Acesso em: 30 jun. 2025.
» https://api.semanticscholar.org/CorpusID:268307684 -
LI, M.; YIN, X.; TANG, B.; YANG, M. Accuracy Assessment of High-Resolution Globally Available Open-Source DEMs Using ICESat/GLAS over Mountainous Areas, A Case Study in Yunnan Province, China. Remote Sensing, v. 15, n. 7, p. 1952, 2023. https://doi.org/10.3390/rs15071952
» https://doi.org/10.3390/rs15071952 -
LIU, S.; YANG, L. T.; TU, X.; LI, R.; XU, C. Lightweight Monocular Depth Estimation on Edge Devices. IEEE Internet of Things Journal, v. 9, n. 17, p. 16168-16180, 2022. https://doi.org/10.1109/JIOT.2022.3151374
» https://doi.org/10.1109/JIOT.2022.3151374 -
MONGRÉDIEN, C.; DOYEN, J. P.; STROM, M.; AMMANN, D. Centimeter-Level Positioning for UAVs and Other Mass-Market Applications. 2016. 29th International Technical Meeting of the Satellite Division of The Institute of Navigation (ION GNSS+ 2016), Proceedings […], Portland, Oregon, p. 1441-1454. https://doi.org/10.33012/2016.14619
» https://doi.org/10.33012/2016.14619 -
MOURA-BUENO, J. M.; DALMOLIN, R. S. D.; CATEN, A. T.; RUIZ, L. F. C.; RAMOS, P. V.; DOTTO, A. C. Assessment of Digital Elevation Model for Digital Soil Mapping in a Watershed with Gently Undulating Topography. Revista Brasileira de Ciência do Solo, v. 40, n. 0, 2016. Disponível em: http://www.scielo.br/scielo.php?script=sci_arttext&pid=S0100-06832016000100304&lng=en&tlng=en Acesso em: 11 nov. 2025.
» http://www.scielo.br/scielo.php?script=sci_arttext&pid=S0100-06832016000100304&lng=en&tlng=en -
MUÑOZ, V. A.; VALERIANO, M. de M. Estimativa da amplitude topográfica por geoprocessamento de dados SRTM para modelagem do relevo. GEOGRAFIA, Rio Claro, v. 36, n. 1, p. 107-120, 2011. Disponível em: https://www.periodicos.rc.biblioteca.unesp.br/index.php/ageteo/article/download/4908/5137/38247 Acesso em: 01 ago. 2025.
» https://www.periodicos.rc.biblioteca.unesp.br/index.php/ageteo/article/download/4908/5137/38247 -
MOYA, C. R. Como escolher o teste estatístico: um guia para o pesquisador iniciante. São Paulo, SP: Ed. da Autora, 2021. Disponível em: https://www.sbquadril.org.br/app/uploads/2021/10/Como-escolher-o-teste-estati%CC%81stico-Um-guia-para-o-pesquisador-iniciante.pdf Acesso em: 08 jun. 2025.
» https://www.sbquadril.org.br/app/uploads/2021/10/Como-escolher-o-teste-estati%CC%81stico-Um-guia-para-o-pesquisador-iniciante.pdf -
ORGANIZAÇÃO DAS NAÇÕES UNIDAS. Transformando Nosso Mundo: A Agenda 2030 para o Desenvolvimento Sustentável. Nova York: ONU, 2015. Disponível em: https://sustainabledevelopment.un.org/post2015/transformingourworld Acesso em: 28 jan. 2025.
» https://sustainabledevelopment.un.org/post2015/transformingourworld - PAKOKSUNG, K.; TAKAGI, M. Assessment and comparison of Digital Elevation Model (DEM) products in varying topographic, land cover regions and its attribute: a case study in Shikoku Island Japan. Modeling Earth Systems and Environment, v. 7, n. 1, p. 465-484, 2021. https://doi.org/10.1007/s40808-020-00891-x
-
PANAGIOTOU, E.; CHOCHLAKIS, G.; GRAMMATIKOPOULOS, L.; CHAROU, E. Generating Elevation Surface from a Single RGB Remotely Sensed Image Using Deep Learning. Remote Sensing , v. 12, n. 12, p. 2002, 2020. https://doi.org/10.3390/rs12122002
» https://doi.org/10.3390/rs12122002 -
POLIDORI, L.; EL HAGE, M. Digital Elevation Model Quality Assessment Methods: A Critical Review. Remote Sensing , v. 12, n. 21, 3522, 2020. https://doi.org/10.3390/rs12213522
» https://doi.org/10.3390/rs12213522 -
PREFEITURA DE CACHOEIRA DO SUL. Cachoeira tem 2.780 estabelecimentos rurais produtivos. 2018. Disponível em: https://www.cachoeiradosul.rs.gov.br/portal/noticias/0/3/1932/cachoeira-tem-2780-estabelecimentos-rurais-produtivos Acesso em: 15 de jan. 2025.
» https://www.cachoeiradosul.rs.gov.br/portal/noticias/0/3/1932/cachoeira-tem-2780-estabelecimentos-rurais-produtivos -
QGIS DEVELOPMENT TEAM. QGIS Geographic Information System. Version 3.34. Beaverton, OR: OSGeo, 2025. Software. Disponível em: https://qgis.org/ Acesso em: 20 jul. 2025.
» https://qgis.org/ -
RAHRIG, R. R. ANOVA F-test and Kruskal-Wallis test performance comparison under varying distributions, variance heterogeneity, sample sizes, and noncentrality structures. Journal of Statistics and Management Systems, 2024. https://doi.org/10.47974/JSMS-1116
» https://doi.org/10.47974/JSMS-1116 -
ROBERTS, D.R.; BAHN, V.; CIUTI, S.; BOYCE, M.S.; ELITE, J.; GUILLERA-ARROITA, G.; HAUENSTEIN, S.; LAHOZ-MONFORT, J.J.; SCHRODER, B.; THUILLER, W.; WARTON, D.I.; WINTLE, B.A.; HARTIG, F.; DORMANN, C.F. Cross‐validation strategies for data with temporal, spatial, hierarchical, or phylogenetic structure. Ecography, v. 40, n. 8, p. 913-929, 2017. https://doi.org/10.1111/ecog.02881
» https://doi.org/10.1111/ecog.02881 -
SAMPAIO, N. A. D. S.; ASSUMPÇÃO, A. R. P. D.; FONSECA, B. B. D. Estatística Inferencial. Belo Horizonte: Ed. Poisson, 2018. Disponível em: http://www.poisson.com.br/livros/estatistica/volume2/Estatistica_Inferencial.pdf Acesso em: 04 jan. 2025.
» http://www.poisson.com.br/livros/estatistica/volume2/Estatistica_Inferencial.pdf -
SAMEJIMA, K. Estatística não paramétrica - Testes de Aderência. 2018. Disponível em: https://est.ufba.br/sites/est.ufba.br/files/kim/matd49-aula05-aderencia.pdf Acesso em: 04 jan. 2025.
» https://est.ufba.br/sites/est.ufba.br/files/kim/matd49-aula05-aderencia.pdf -
SHEAN, D. E.; ALEXANDROV, O.; MORATTO, Z. M.; SMITH, B. E.; JOUGHIN, I. R.; PORTER, C.; MORIN, P. An automated, open-source pipeline for mass production of digital elevation models (DEMs) from very-high-resolution commercial stereo satellite imagery. ISPRS Journal of Photogrammetry and Remote Sensing , v. 116, p. 101-117, 2016. https://doi.org/10.1016/j.isprsjprs.2016.03.012
» https://doi.org/10.1016/j.isprsjprs.2016.03.012 -
SHIN, Y.; LEE, C.; KIM, E. Enhancing Real-Time Kinematic Relative Positioning for Unmanned Aerial Vehicles. Machines, v. 12, n. 3, p. 202, 2024. https://doi.org/10.3390/machines12030202
» https://doi.org/10.3390/machines12030202 -
SIAVOSHI, M. 10 Python Statistical Functions. 2025. Disponível em: https://www.kdnuggets.com/10-python-statistical-functions Acesso em: 05 jan. 2025
» https://www.kdnuggets.com/10-python-statistical-functions -
TIAN, Y.; GUO, P.; LYU, M.R. Comparative Studies on Feature Extraction Methods for Multispectral Remote Sensing Image Classification. In: IEEE INTERNATIONAL CONFERENCE ON SYSTEMS, MAN AND CYBERNETICS, 2005, Waikoloa, HI, USA. 2005. p. 1275-1279. https://doi.org/10.1109/ICSMC.2005.1571322
» https://doi.org/10.1109/ICSMC.2005.1571322 -
VALERIANO, M. M. Topodata: guia para utilização de dados geomorfológicos locais. São José dos Campos: INPE. 2008. Disponível em: http://mtc-m18.sid.inpe.br/col/sid.inpe.br/mtc-m18@80/2008/07.11.19.24/doc/publicacao.pdf Acesso em: 05 fev. 2025
» http://mtc-m18.sid.inpe.br/col/sid.inpe.br/mtc-m18@80/2008/07.11.19.24/doc/publicacao.pdf -
VALERIANO, M. de M. Modelo digital de variáveis morfométricas com dados SRTM para o território nacional: o projeto TOPODATA. Simpósio Brasileiro de Sensoriamento Remoto, XII. Goiânia, Brasil, 2005. Anais [...]. 2005, INPE: São José dos Campos, p. 3595-3602 Disponível em: http://marte.sid.inpe.br/col/ltid.inpe.br/sbsr/2004/10.29.11.41/doc/3595.pdf Acesso em: 05 fev. 2025.
» http://marte.sid.inpe.br/col/ltid.inpe.br/sbsr/2004/10.29.11.41/doc/3595.pdf -
VALERIANO, M. M.; MUNOZ, V. V. Estimativa da amplitude topográfica por geoprocessamento de dados SRTM para modelagem do relevo. GEOGRAFIA, Rio Claro, v. 36, n. 1, p. 107-120, 2011. Disponível em: http://observatoriodageografia.uepg.br/files/original/d539e3c4eb516c5dba5a51e40f433c678341b860.pdf Acesso em: 05 fev. 2025.
» http://observatoriodageografia.uepg.br/files/original/d539e3c4eb516c5dba5a51e40f433c678341b860.pdf -
VAN ECK, N. J.; WALTMAN, L. VOSviewer - Visualizing scientific landscapes. Leiden: Centre for Science and Technology Studies, Leiden University, 2025. Disponível em: https://www.vosviewer.com Acesso em: 17 jul. 2025.
» https://www.vosviewer.com -
YANG, L.; ZHU, Z.; SUN, L.; ZHANG, D. Global Attention-Based DEM: A Planet Surface Digital Elevation Model-Generation Method Combined with a Global Attention Mechanism. Aerospace, v. 11, n. 7, p. 529, 2024. https://doi.org/10.3390/aerospace11070529
» https://doi.org/10.3390/aerospace11070529 -
YIN, Q.; CHEN, Z.; ZHENG, X.; XU, Y.; LIU, T. Sliding Windows Method Based on Terrain Self-Similarity for Higher DEM Resolution in Flood Simulating Modeling. Remote Sensing , v. 13, n. 18, 3604, 2021. https://doi.org/10.3390/rs13183604
» https://doi.org/10.3390/rs13183604 -
XU, W.; LI, J.; PENG, D.; YIN, H.; JIANG, J.; XIA, H.; WEN, D. Vertical Accuracy Assessment and Improvement of Five High-Resolution Open-Source Digital Elevation Models Using ICESat-2 Data and Random Forest: Case Study on Chongqing, China. Remote Sensing , v. 16, n. 11, 1903, 2024. https://doi.org/10.3390/rs16111903
» https://doi.org/10.3390/rs16111903 -
ZHANG, Y.; YU, W. Comparison of DEM Super-Resolution Methods Based on Interpolation and Neural Networks. Sensors, v. 22, n. 3, 0745, 2022. https://doi.org/10.3390/s22030745
» https://doi.org/10.3390/s22030745 -
ZHU, H.; CHEN, Y. A Study of the Effect of DEM Spatial Resolution on Flood Simulation in Distributed Hydrological Modeling. Remote Sensing , v. 16, n. 16, p. 3105, 2024. https://doi.org/10.3390/rs16163105
» https://doi.org/10.3390/rs16163105

 Source: The authors, 2025.
 Source: The authors, 2025.
 Source: The authors, 2025.
 Source: The authors, 2025.
 Source: The authors, 2025.
 Source: The authors, 2025.
 Source: The authors, 2025.
 Source: The authors, 2025.
 Source: The authors, 2025.