
 Carbon Flux Models in a Zonally Dry Tropical Forest Area (Caatinga)
Abstract
Studies on energy exchange in ecosystems are critical for understanding carbon flows amid different vegetation patterns. In semi-arid areas, comprehending the variability in carbon absorption is essential for quantifying and anticipating the impacts of changes in the caatinga ecosystem. This study aims to calibrate and evaluate models for Gross Primary Production (GPP), Net Ecosystem Exchange (NEE), and Ecosystem Respiration (Reco) in the caatinga biome. NEE measurements were obtained and calculated at 30-minute intervals using EddyPro 3.6 software, from raw data measured at 10 Hz. GPP was estimated by partitioning NEE and Reco, all measured in micromoles of CO2 per square meter per second (μmol CO2 m⁻² s⁻¹) using the eddy covariance (EC) tower, installed in a legal reserve at Embrapa Semiárido, in Petrolina, Pernambuco, within a section of the caatinga canopy. Following the measurement of carbon fluxes and ecosystem respiration, field measurements were conducted using a portable FieldSpec HandHeld spectroradiometer to obtain the reflectance of the canopy around the turbulent eddy covariance tower. These measurements were carried out in 2015 in a preserved caatinga area. Multiple linear regression models were developed to estimate carbon fluxes from orbital images, enabling accurate estimation of GPP, NEE, and Reco, using the MODIS/Terra Daily Surface Reflectance product (MOD09GA). The primary results demonstrate the effectiveness of the developed models, particularly the GPP model, which exhibited the best statistical indices (R = 0.97; R² = 0.95; Root Mean Square Error = 0.20). Observations from the EC tower indicated that the models developed to estimate NEE, GPP, and Reco, using visible and near-infrared reflectance data, accurately represented the dry period and effectively captured the phenological aspects of the caatinga ecosystem.
Keywords:
Remote sensing; Modeling; Semi-arid
Resumo
Estudos sobre trocas de energia em ecossistemas desempenham um papel importante na compreensão dos fluxos de carbono diante dos diferentes padrões da vegetação. No contexto das áreas semiáridas, entender a variabilidade na absorção de carbono é fundamental para quantificar e antecipar os impactos das alterações do ecossistema de caatinga. O objetivo deste estudo é calibrar e avaliar modelos para a Produção Primária Bruta (GPP), o Fluxo Líquido do Ecossistema (NEE) e a Respiração do Ecossistema (Reco) no bioma de caatinga. Foram obtidas medições da NEE, calculado em intervalos de 30 minutos usando o software EddyPro 3.6, a partir de dados brutos medidos a 10 Hz. A GPP foi estimada pela partição do NEE e Reco, todos medidos em micromoles de CO2 por metro quadrado por segundo (μmolCO2 m-2 s-1) na torre de covariância de vórtices turbulentos (EC), instalada em uma reserva legal, na Embrapa Semiárido, em Petrolina - Pernambuco, em um recorte do dossel da caatinga. Após as medições dos fluxos de carbono e da respiração do ecossistema foram realizadas medidas de campo com espectrorradiômetro portátil FieldSpec HandHeld para obter a reflectância do dossel em torno da torre de covariância de vórtices turbulentos, as medições foram realizadas no ano de 2015 em uma área de caatinga preservada. Os modelos de regressão linear múltipla foram desenvolvidos, para estimar os fluxos de carbono, a partir de imagens orbitais, permitindo estimar com precisão GPP, NEE e Reco, utilizando-se o produto MODIS/Terra Reflectância Superficial Diária (MOD09GA). Os principais resultados mostram a eficácia dos modelos desenvolvidos, destacando-se o modelo de GPP com melhores índices estatísticos (R=0,97; R2=0,95; Erro Padrão da Estimativa=0,20). As medições observadas na torre EC apontaram que os modelos desenvolvidos para estimar a NEE, GPP e Reco, com dados da reflectância do visível e do infravermelho próximo, os modelos representaram adequadamente o período seco e capturaram com precisão os aspectos fenológicos do ecossistema da caatinga.
Palavras-chave:
Sensoriamento remoto; Modelagem; Semiárido
INTRODUCTION
Over the past twenty years, significant advances have been made in quantifying and understanding the spatio-temporal patterns of terrestrial carbon fluxes. Continuous progress in remote sensing has played a fundamental role in enhancing models for estimating carbon fluxes, contributing substantially to our understanding of the dynamics of carbon fluxes at local, regional, and global scales (Prakash Sarkar et al., 2022; Silva, Silva, Santos, Silva, Galvíncio, 2017; Silva, Galvíncio, Silva, Soares, Tiburcio, Barros, 2024).
Arid lands cover more than 40% (Jesus et al., 2023; Xue et al., 2023) of the Earth's surface, encompassing several biomes that extend across approximately two-fifths of the planet, with the semi-arid domain being the most representative (Jesus et al., 2023). In Brazil, the seasonally dry Brazilian tropical forest (caatinga) stands out as the fourth largest biome (Silva; Lima, Antonino; Souza; Souza; Silva; Alves, 2017; Silva; Galvíncio; Silva; Soares; Tiburcio; Barros, 2024), covering a vast area in the Northeast, approximately 912,529 km² (Tabarelli et al., 2018). The environmental resilience of the caatinga is attributed to its richness in endemic species, presenting significant potential for carbon sequestration and mitigation of impacts on this ecosystem (Borges et al., 2020). In the context of the caatinga, the phenological patterns of vegetation play a crucial role in regulating seasonal and annual productivity, acting as an important sink for carbon dioxide (CO2) (Silva; Lima, Antonino; Souza; Souza; Silva; Alves, 2017; Silva; Galvíncio; Miranda; Moura, 2024).
Estimating of carbon fluxes from satellite remote-sensing products has experienced significant growth. Although the data from MOD17A2H is widely recognized, it presents potential sources of error related to both the data input and the parameters describing the biophysical properties of vegetation and the algorithm itself (Wang et al., 2017).
Analyzing carbon dynamics in ecosystems over extended periods is a challenging and constantly evolving task, requiring the application of diverse datasets and simulation methods (Silva et al., 2021). The integration of data from orbital sensors and ground-based sensors, capturing detailed spectral information about objects, is emerging as an essential approach for monitoring carbon storage in seasonally dry tropical forests (Silva et al., 2021; Silva; Lima, Antonino; Souza; Souza; Silva; Alves, 2017).
Carbon measurement employs three main methods: direct sampling with vegetation clearing, allometric equations, and remote sensing techniques (Cerqueira; Washington Franca-Rocha, 2007; Prakash Sarkar et al., 2022). Several methods are available to extrapolate information from eddy covariance (EC) flow towers, originally on a local scale, to a regional scale. These methods include statistical approaches such as regression and semi-empirical models, machine learning (ML) techniques such as neural networks and decision trees, as well as methods based on intrinsic water use efficiency models (Silva, Galvíncio, Silva, Soares, Tiburcio, Barros, 2024).
There is notable interest in the development of models aimed at monitoring environmental variables linked to the carbon balance, specifically related to Gross Primary Production (GPP), Net Ecosystem Exchange (NEE), and Ecosystem Respiration (Reco), adapted to the microclimatic characteristics of specific locations.
In the caatinga biome, there is a scarcity of precision analyses using different remote sensing methods. This research aims to explore an alternative approach to determining the carbon balance in the caatinga, utilizing remote sensing. The proposal is to develop hybrid models that combine different spectral bands, specifically from the visible and near-infrared, validated by comparing them with Reco, NEE, and GPP derived from EC carbon flux measurements in a caatinga ecosystem, aiming to facilitate the analysis of climatic conditions in seasonally dry forest areas. The underlying hypothesis seeks to evaluate the accuracy of monitoring the carbon balance in Caatinga vegetation through models calibrated for seasonally dry tropical forests, integrating field data and information from multispectral and hyperspectral orbital images.
MATERIALS AND METHODS
Characterization of the Study Area
The study area comprises the caatinga, a seasonally dry tropical forest, located in the Municipality of Petrolina, PE, Brazil. The highlighted point (Figure 1) corresponds to a legal reserve area at Embrapa Semiarid, where an eddy covariance system is installed. The vegetation in this area consists of medium and low woody formations, thorny species with small and thin leaves, cacti, and bromeliads (Kiill, 2017). The average canopy height is 4.5 meters (Miranda et al., 2020). The climate is classified as semi-arid BSh according to the Köppen classification (Alvares et al., 2013), with the rainy season occurring between January and April, an average annual rainfall of 578 mm, and an average annual temperature of 26.0°C (Moura et al., 2007).

Obtaining Data from the Flow Tower
Net Ecosystem Exchange (NEE) was calculated at 30-minute intervals using EddyPro software, version 3.6, from raw data measured at 10 Hz. Gross Primary Production (GPP) was estimated by partitioning the Net Ecosystem Exchange (NEE) into Ecosystem Respiration (Reco), following Equations 1, 2, and 3. The nighttime method was adopted to estimate Reco (Lloyd; Taylor, 1994; Reichstein et al., 2005) (Equation 2). This procedure, along with gap filling, was performed using the REddyProc package in the R environment (The R Foundation, 2018). All data used pertain to the year 2015 and served as the basis for the creation and calibration of the models developed in this study. The partitioning of NEE between GPP and Reco was conducted according to Equation 1:
NEE is net carbon flux (μmolCO2 m-2 s-1), GPP is gross primary production (μmolCO2 m-2 s-1), and Reco is ecosystem respiration (μmolCO 2 m -2 s - 1).
Reco is the ecosystem's respiration, Tref is the reference temperature (C°), Tsoil is the soil temperature at a depth of 5 cm and T0 is a constant equal to 46.02 °C, according to Lloyd and Taylor (1994).
GPP is gross primary production (μmolCO2 m-2 s-1), NEE is net carbon flux (μmolCO2 m-2 s-1), and Reco is ecosystem respiration (μmolCO2 m-2 s-1).
Obtaining and Preprocessing Hyperspectral Data
Radiometric measurements of plant canopies were collected from January to August 2015 on random days, selecting dates close to the observed records of carbon fluxes from the micrometeorological tower, on twelve occasions during the analyzed period.
Spectral reflectance measurements were taken approximately 10 meters above the ground, in four directions (North, South, East, and West), around the EC tower. On each date and sampling area, four readings were taken, and the arithmetic mean for each collection was calculated. In this study, reflectance data obtained with HandHeld, similar to the wavelength of MOD09GA, was preferentially used for each visible and near-infrared band. The tower pixel was used to extract the reflectance of MOD09GA.
Obtaining and Processing Orbital Images
Earth surface reflectance data (MOD09GA) were used in the research, involving twelve scenes during the analyzed period. The analyses were conducted on the pixel that encompasses the tower equipped with the eddy covariance system, as the pixel was entirely contained within the preserved caatinga area.
Eight-day MOD09GA pixel values were represented by reflectance, with pixels having optimal viewing angles and minimal cloud or cloud shadow impacts selected. The extracted time series were subjected to Quality Assurance/Quality Control (QA/QC) to ensure the quality of the MOD09GA product.
MOD09GA consists of seven bands with daily resolution, presenting surface reflectance values with 500 m spatial resolution in visible ( ρ 1 = 620-670 nm; 𝜌 3 = 459-479 nm; 𝜌 4 = 545-565 nm), near-infrared ( 𝜌 2 = 841- 876 nm; 𝜌 5 = 1230-1250 nm), and mid-infrared ( 𝜌 6 = 1628-1652 nm; 𝜌 7 = 2105-2155 nm).
Calibration and Validation of Reco, NEE, and GPP Models
Estimates of carbon fluxes derived from the spectral bands of the FieldSpec HandHeld portable spectroradiometer were created using statistical methods. Initially, descriptive statistics were calculated, including mean, median, and standard deviation, for each developed model. Additionally, correlation and multiple linear regression analyses were conducted to establish the models, considering spectroradiometer reflectances and carbon fluxes from the Turbulent Vortex Covariance tower.
Multiple Linear Regression Model
Multiple linear regression analyses (Equation 4) were conducted using SPSS® software.
The models resulting from the multiple linear regression were defined by the spectral variables and carbon fluxes derived from the micrometeorological tower (Table 1). The correlation was obtained using a significance level of 0.05, i.e., 95% reliability.
Durbin-Watson Test
The multiple linear regression models were adjusted based on the analysis of the applicability of the Durbin-Watson (DW) test (Equation 5) to evaluate the presence of autocorrelation in the residuals and to ensure the independence of errors. If the DW value is greater than the upper limit, there is no autocorrelation; if it is less than the lower limit, there is positive autocorrelation; and if it is between the two limits, the test is inconclusive. Additionally, the normality of the distribution of errors was verified through the probability of the expected value.
The Durbin-Watson (d) statistical value is given by the formula presented in Equation 5:
Variance Inflation Factor
The Variance Inflation Factor (VIF) was used to detect multicollinearity in the regression model (Equation 6).
The VIF is calculated for each independent variable, and a high score indicates high multicollinearity, which can impair the precision of the estimated regression coefficients. Values greater than 10 are often considered indicative of problematic multicollinearity.
Kappa Index
The reliability of the results obtained in this study was analyzed using the Kappa Index value ranges proposed by Landis and Koch (1977). These ranges are described in Equation 7 and are widely used to evaluate the agreement between observed data and predicted data.
The Kappa Index, a measure of statistical agreement between actual and predicted observations, ranges from 0 to 1. The closer the Kappa Index value is to 1, the greater the accuracy of the forecast in relation to the observed data.
RESULTS AND DISCUSSION
Based on statistical criteria, the spectral variables that presented the best correlation with the model were chosen, for Ecosystem Respiration (Reco), Net Ecosystem Flow (NEE) and Gross Primary Productivity. Regression analyzes using different spectral bands (Blue, Green, Red and Near Infrared - NIR) were used to estimate Reco, NEE and GPP.
Several studies have utilized linear regression to evaluate Reco, NEE, and GPP. For instance, Li et al. (2016) conducted multiple linear regression analyses with optimized parameter sets to generate estimates of GPP, Reco, and NEE. Chu et al. (2018) investigated the distribution of precipitation and its impacts on NEE using linear regression. Zhang et al. (2019) evaluated ecosystem photosynthetic performance during three periods of extreme drought in a semi-arid steppe in Mongolia, applying GPP to standardize several linear regression models.
Multiple Linear Regression Model for Reco Estimation
According to the criteria selected for creating the Reco model, the most effective result was achieved by incorporating information from two spectral bands, ρ550 (Green) and ρ775 (Near Infrared - NIR), as shown in Table 2. This approach facilitated a better understanding and prediction of Reco. Notably, the average ecosystem respiration in 2015 was 1.91 μmolCO 2 m -2 s -1, with reflectance percentages in green and infrared being 8% and 22%, respectively (Table 2). Similar results were observed in the study by Flores-Rentería et al. (2023), which investigated how environmental factors affect CO2 exchange throughout the year in the Chihuahuan Desert, Northeast Mexico, using the eddy covariance technique. The annual average of Reco was 1.45 μmolCO2 m -2 s -1. Models based on surface reflectance were developed to enhance the understanding of Reco at various sites using spectral indices (Lees et al., 2018). Jägermeyr et al. (2014) created a Reco model using MODIS land surface temperature (LST) and the enhanced vegetation index (EVI), incorporating NIR reflectance. Wu et al. (2014) utilized MODIS-derived NDVI and LST (both daytime and nighttime LST) to explain Reco variations.
In this specific model, the correlation coefficient reached a significant value, with r = 0.75 and r2 = 0.56, demonstrating statistical significance below 0.05. These results underscore the substantial association between the dependent variable Reco and the independent variables ρ550 and ρ775, as detailed in Table 3.
The Reco model presented a standard error of 0.81μmolCO2 m-2 s-1, indicating a high magnitude of error. The Durbin-Watson test result of 1.347 μmolCO2 m-2 s-1 signals positive autocorrelation. Low VIF values (Variance Inflation Factor) of 1.94 suggest the possibility of overfitting, with some variability in the relationships between the variables considered acceptable, given their proximity to 2 in the 95% confidence interval. However, the absence of multicollinearity was evidenced by a tolerance of 0.51 (Table 4), and the Kappa index was 0.25, indicating weak agreement and suggesting the need for new calibrations.
There are significantly fewer successful Reco models compared to GPP due to the greater difficulty in explaining variations between ecosystems, especially using remote sensing (Jägermeyr et al., 2014; Lees et al., 2018).
The predicted value for each observation is the intercept value, where the constant is 1.336, plus the regression coefficient of ρ550, which is -30.631 multiplied by the value of the independent variable, and the regression coefficient of ρ775, which is 13.913 multiplied by the value of the independent variable. The final model developed in this study to estimate Reco (μmolCO2 m-2 s-1) is as follows:
Where, ρ 550 (green) and ρ 775 (Near Infrared - NIR) are the reflectances in the 550 nm and 775 nm bands, respectively.
Temporal Variability of Daily Average Reco
The assessment of Ecosystem Respiration (Reco) was based on the comparison of turbulent vortex data measured in the preserved Caatinga area throughout 2015. Reco measured by the Turbulent Vortex System (EC) presented an average of 1.91μmolCO2 m -2 s -1, while the Reco model developed and applied to data from the MOD09GA sensor (Model Developed/MOD09GA) for the same year recorded an average of 2.06 μmolCO2 m -2 s -1. This represents approximately 93% accuracy in the average estimated value compared to the observed value at the EC tower. These results indicate the accuracy of the developed model when applied to MODIS data.
In 2015, low rainfall indicated restrictions on the respiration of semi-arid ecosystems due to water scarcity, limiting Reco (Figure 2) (Jia et al., 2020). Global studies have highlighted the impacts of reduced precipitation, showing a weak or absent seasonal correlation with Reco (Gao et al., 2015; Jia et al., 2020; Zhou et al., 2020). The model developed in this study demonstrated effectiveness in dealing with dry ecosystems and periods of reduced precipitation. The seasonal Ecosystem Respiration (Reco) curves showed similar patterns during most of the analyzed period (Figure 2), comparing values observed in the tower with estimates from the model applied to MODIS data. The proximity was notable during the dry period, whereas there was divergence during the rainy period, notably around the precipitation peak between March 20 and April 17. Minimal rainfall can stimulate the release of CO2, especially through microbial respiration (Gao et al., 2015; Jia et al., 2020; Sun et al., 2020). During more intense water deficits, plant transpiration is reduced, leading to decreased photosynthesis, loss of canopy cover, and increased exposure to radiation and insolation. These conditions result in significant temperature variations, reduced humidity, and increased microbial activity, contributing to CO2 loss.
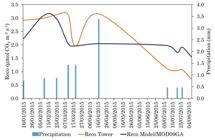
Temporal variation of Ecosystem Respiration (Reco) derived from the turbulent vortex system and the developed model applied to data from the MOD09GA sensor (Developed Model/MOD09GA), along with rainfall records.
The Reco of the developed model/MOD09GA did not follow the precipitation curve, indicating that this model requires further calibrations. However, given the absence of Reco models calibrated for the Caatinga vegetation using orbital images, this model can be utilized in the absence of a better-calibrated model for this vegetation. Statistical analyses revealed that it is feasible to estimate ecosystem respiration with considerable precision using reflectance data from the visible range. Therefore, the model developed in this study plays a significant role in the spatial and temporal assessment of ecosystem respiration in tropical dry forests.
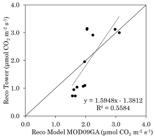
Simple Linear Regression between Ecosystem Respiration (Reco) derived from the turbulent vortex system and Reco from the developed model/MOD09GA.
The validation of the model developed in this study, using MODIS data, revealed statistical significance (p < 0.04) and a coefficient of determination of 0.5584 (Figure 3). The data is well-distributed along the trend line, indicating a tendency towards overestimation in relation to the tower data, mainly for < 2.0 μmolCO2 m-2 s-1 values.
This overestimation by MODIS may be associated with its spatial resolution, which represents the average of a 500-meter pixel. The Reco Model Developed/MOD09GA proved to be more reliable, although it overestimated the values in both the rainy and dry seasons, capturing the seasonality of precipitation in the study area efficiently.
It is important to highlight the scarcity of observed or estimated Ecosystem Respiration (Reco) data through remote sensing. While there are several models for estimating Gross Primary Production (GPP) using orbital sensors, there is limited availability of similar methods for estimating Reco, particularly for Caatinga vegetation.
Multiple linear regression model for estimating NEE
After several attempts to create the Net Ecosystem Exchange (NEE) model, the most effective result was achieved using two spectral bands, ρ470 (Blue) and ρ775 (Near Infrared - NIR), along with Reco (Table 5). The average net ecosystem flux for 2015 was 1.66 μmolCO2 m-2 s -1, with reflectance in the blue band at 0.06% and in the infrared band at 22% (Table 5).
The model presented a correlation coefficient of r = 0.36 and r² = 0.13, with a significance level below 0.05. These results reflect the degree of association between the dependent variable Reco and the independent variables ρ470 and ρ775. The Kappa index was 0.65, indicating moderate agreement (Table 6).
It is observed that the Net Ecosystem Flow (NEE) model developed demonstrates good ability to represent estimates, as indicated by the VIF, which varied between 2.4 and 3.15 (Table 7). The NEE model can represent the estimates well, since the VIF was between 2.4 and 3.15 (Table 7).
The parameters and variables of the NEE model (μmolCO2 m-2 s-1) developed in this study are as follows:
Where, Reco is the ecosystem's respiration, ρ470 (blue) and ρ775 (Near Infrared - NIR) are the reflectances at wavelengths of 470 nm and 775 nm, respectively.
Temporal variability of daily average NEE
The assessment of the Net Ecosystem Exchange (NEE) was carried out by comparing data obtained from turbulent vortices in the preserved Caatinga area during 2015. Throughout the year, NEE measured by the Turbulent Vortex System presented an average of 1.6605 μmolCO2 m-2 s-1, while the regression-derived NEE model recorded an average of 1.556 μmolCO2 m-2 s-1.
The results of this study align with research in various semi-arid environments. Silva, Galvíncio, Miranda, Moura (2024) recorded NEE values of 1.4 and 3.6 μmolCO2 m-2 s-1 for pasture and Caatinga, respectively. The annual average varied between -3.25 μmolCO2 m-2 s-1 for pasture and -3.42 μmolCO2 m -2 s-1 for Caatinga.
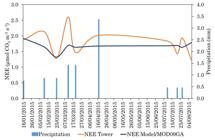
Temporal variation of the ecosystem Net Flux (NEE) derived from the turbulent vortex system and the developed model applied to data from the MOD09GA sensor (Model Developed/MOD09GA), together with rainfall records.
The developed model presented a consistent temporal pattern for NEE, as illustrated in Figure 4. The model responds well to variations in periods of more regular rain and drought, although the extreme value measured reached a peak of 2.6 μmolCO2 m-2 s-1. Compared to data observed by the tower, NEE exhibited a similar seasonal pattern during most of the analyzed period. Low values were noted in a preserved fragment of Caatinga due to soil moisture deficit, impacting vegetation, as observed in previous studies (Mendes et al., 2021; Pereira et al., 2020; Silva; Lima; Antonino; Souza; De Souza; Silva; Alves, 2017).
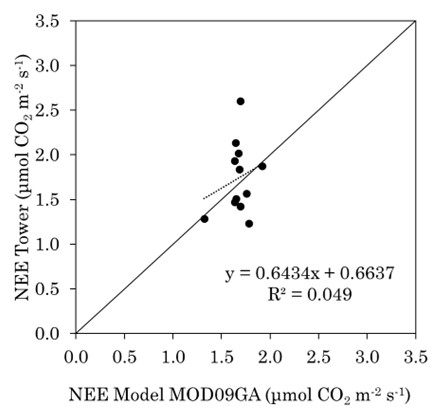
The simple linear regression between the NEE from the turbulent vortex system and the NEE from the Developed Model/MOD09GA for 2015 resulted in a coefficient of determination of 0.049 (Figure 5). The data distribution along the trend line shows an overestimation in the tower's NEE model. Despite the weak statistics, it is important to highlight that, due to the absence of calibrated models for this ecosystem, the developed model may be useful until a deeper understanding is achieved (Figure 5).

Simple Linear Regression between the NEE derived from the Turbulent Vortex System and the NEE derived from developed the model/MOD09GA.
Multiple linear regression model for GPP estimation
Among the tests to develop the Gross Primary Production (GPP) model, the best result was achieved using the independent variables NEE, Reco, ρ470 (Blue), and ρ775 (Near Infrared - NIR). The descriptive statistics of the input data indicate an average of 0.8998 μmolCO2 m-2 s -1 for GPP, 1.9100 μmolCO2 m-2 s-1 for Reco, and 1.6605 μmolCO 2 m -2 s -1 for NEE. Furthermore, the reflectance in the blue band was 6%, while in the infrared band was 22%, both referring to the year 2015 (Table 8).
For the GPP model, a very high correlation was obtained, with r = 0.97 and r² = 0.95 (Table 9), and a significance level of < 0.00. The model achieved a standard error of 0.20, considered low. The Kappa index was calculated as 0.65, indicating moderate agreement between observed and predicted data (Table 9).
The VIF demonstrated that the model can estimate GPP very accurately, as shown in Table 10. Furthermore, no multicollinearity was identified in the model, confirming the robustness of the estimates.
The GPP model (μmolCO2 m-2 s-1) developed in this study was:
Where, ρ 470 (blue) and ρ 775 (near infrared - NIR) are the reflectances in the spectral bands of 470 nm and 775 nm, respectively.
Temporal variability of daily GPP
The GPP was evaluated by comparing data obtained from turbulent vortices measured in the preserved Caatinga area during 2015. The GPP measured by the Turbulent Vortex System presented an average of 0.8998 μmollCO2 m-2 s-1, while the GPP model developed by regression demonstrated an average of 1.1380 μmolCO2 m-2 s-1.
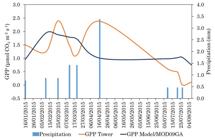
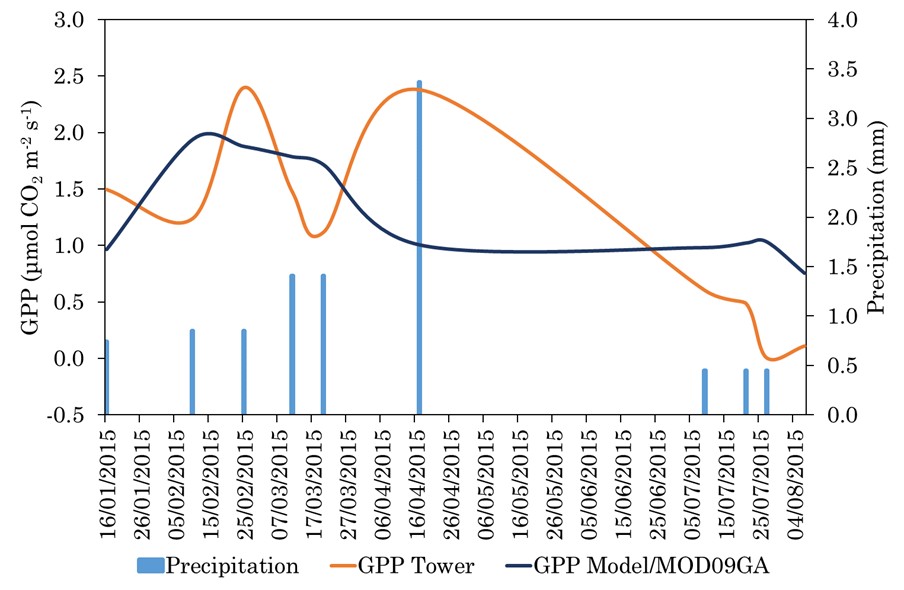
Temporal variation of the GPP derived from the Turbulent Vortex System and the Reco derived model applied to data from the MOD09GA sensor - Model Developed/MOD09GA and rainfall.
GPP exhibited a similar seasonal pattern throughout most of the analyzed period. During the rainy season from January to March, the GPP of the Developed Model/MOD09GA did not follow the rains well, responding more slowly compared to the GPP of the tower, which had a faster assimilation after the rainfall from January to March. This delay in response to rainfall observed in the Developed Model/MOD09GA is consistent with studies in arid and semi-arid environments (Hao et al., 2010; Liu et al., 2012; Zhou et al., 2020). In April, despite the increase in rainfall, the GPP estimates from the Developed Model/MOD09GA decreased, extending until June. During these months, both followed a similar seasonal pattern, but the Developed Model/MOD09GA GPP overestimated the Tower GPP. The lack of rain during this period resulted in water stress, being the main factor for the reduction in GPP assimilation. In general, the Developed Model/MOD09GA overestimated the values in the dry season but managed to capture the seasonality of precipitation in the study area well (Figure 6).
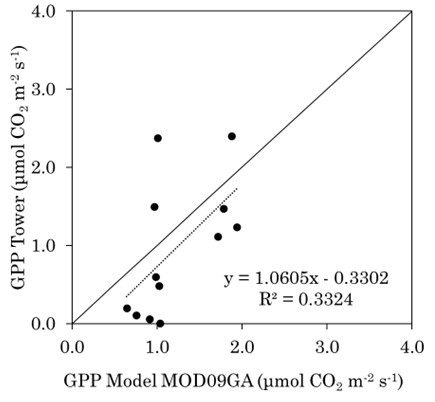
The simple regression analysis between the GPP of the tower and the GPP of the Developed Model/MOD09GA for the year 2015 revealed a correlation coefficient of r = 0.5765 (Figure 7). These results align with research conducted in various regions worldwide. In the study by Maselli et al. (2017) on Pianosa Island, a low average GPP trend (0.11 gC m−2 day−1) was identified. Furthermore, in a study by Morais (2019) at the Embrapa Semiárido site - Brazil, the analysis of the GPP recorded by the EC during the period from 2011 to 2015 indicated an average of 1.91 ± 2.31 gC m−2 day−1.
Simple Linear Regression between Gross Primary Production - GPP derived from the Turbulent Vortex System, and Gross Primary Production - GPP derived from Model developed/MOD09GA.
When the GPP models were evaluated and compared with the reference GPP derived from the turbulent vortex system, it was observed that the model developed from in situ reflectances presented superior results in the seasonal pattern of the region, standing out with a presence more significant in the value of the GPP.
CONCLUSIONS
Carbon flows and ecosystem respiration in the Caatinga are essential to addressing current environmental challenges in this significant semi-arid region. This study highlights the importance of models calibrated for this specific type of vegetation and climate to accurately estimate Reco, NEE, and GPP of the Caatinga ecosystem.
The variables that showed the best correlation with the measured and observed data were those for estimating GPP and NEE. In contrast, Reco proved to be less representative, indicating the need for improvements. However, it is still feasible to consider its use in the absence of a better-calibrated Reco model.
The differences observed between the data measured by the turbulent vortex system and those estimated using the Developed Model/MOD09GA for Reco, NEE, and GPP during the rainy season, particularly in April, highlight the need to calibrate models with meteorological data. Precipitation plays a crucial role in the Caatinga's ability to capture CO2.
The use of the terrestrial and orbital data set from the MODIS/Terra sensor bands (MOD09GA) resulted in overestimation, likely due to its spatial resolution, which represents the average of a 500-meter pixel. However, the results of the models were much better than those previously available for estimates of gross primary production and respiration of dry ecosystems, especially in the Caatinga biome.
References
-
ALVARES, C. A.; STAPE, J. L.; SENTELHAS, P. C.; MORAES GONÇALVES, J. L.; SPAROVEK, G. Köppen's climate classification map for Brazil. Meteorologische Zeitschrift, Austrália, v. 22, n.6, p.711-728, 2013. Doi: 10.1127/0941-2948/2013/0507
» https://doi.org/10.1127/0941-2948/2013/0507 -
BORGES, C. K.; SANTOS, C. A; CARNEIRO, R. G.; SILVA, L. L.; OLIVEIRA, G.; MARIANO, D.; SILVA, M. T.; SILVA, B. B.; BEZERRA, B. G.; PEREZ-MARIN, A. M.; MEDEIROS, S. S. Seasonal variation of surface radiation and energy balances over two contrasting areas of the seasonally dry tropical forest (Caatinga) in the Brazilian semi-arid region. Environmental Monitoring and Assessment. Bethesda, v. 192, p. 524 -542, 2020. Doi: 10.1007/s10661-020-08484-y
» https://doi.org/10.1007/s10661-020-08484-y -
CERQUEIRA, D. B.; FRANCA-ROCHA, W. Relationship between vegetation types and CO2 flow in the Caatinga Biome: Case study in Rio de Contas - Ba. Proceedings XIII Brazilian Symposium on Remote Sensing, Florianópolis, p. 2413-2419, 2007. Disponível em: http://marte.dpi.inpe.br/col/dpi.inpe.br/sbsr@80/2006/11.16.00.29/doc/2413-2419.pdf Acesso em: 26 jul. 2024
» http://marte.dpi.inpe.br/col/dpi.inpe.br/sbsr@80/2006/11.16.00.29/doc/2413-2419.pdf -
CHU, X.; HAN, G.; XING, Q.; XIA, J.; SUN, B.; YU, J.; LI, D. Dual effect of precipitation redistribution on net ecosystem CO2 exchange of a coastal wetland in the Yellow River Delta. Agricultural and Forest Meteorology, Guelph, v. 249, p. 286-296, 2018. Doi: 10.1016/j.agrformet.2017.11.002
» https://doi.org/10.1016/j.agrformet.2017.11.002 -
FLORES-RENTERÍA, D.; DELGADO-BALBUENA, J.; CAMPUZANO, E. F.; CURIEL YUSTE, J. Seasonal controlling factors of CO2 exchange in a semiarid shrubland in the Chihuahuan Desert, Mexico. Science of The Total Environment, v. 858, n. 3, p. 159918, 2013. Doi: 10.1016/J.SCITOTENV.2022.159918
» https://doi.org/10.1016/J.SCITOTENV.2022.159918 -
GAO, Y.; YU, G.; LI, S.; YAN, H.; ZHU, X.; WANG, Q.; ZHAO, L.; LI, Y.; ZHANG, F.; WANG, Y.; ZHANG, J. A remote sensing model to estimate ecosystem respiration in Northern China and the Tibetan Plateau. Ecological Modelling, Texas, v. 304, p. 34-43, 2015. Doi: 10.1016/j.ecolmodel.2015.03.001
» https://doi.org/10.1016/j.ecolmodel.2015.03.001 -
HAO, Y.; WANG, Y.; MEI, X.; CUI, X. The response of ecosystem CO2 exchange to small precipitation pulses over a temperate steppe. Plant Ecology, v. 2, p. 335-347, 2010. Doi: 10.1007/S11258-010-9766-1
» https://doi.org/10.1007/S11258-010-9766-1 -
IBGE - INSTITUTO BRASILEIRO DE GEOGRAFIA E ESTATÍSTICA. Mapas cartográficos. IBGE, 2000. Disponível em: https://www.ibge.gov.br/geociencias/downloads-geociencias.html Acesso em: 10 maio, 2023.
» https://www.ibge.gov.br/geociencias/downloads-geociencias.html -
JÄGERMEYR, J.; GERTEN, D.; LUCHT, W.; HOSTERT, P.; MIGLIAVACCA, M.; NEMANI, R. A high-resolution approach to estimating ecosystem respiration at continental scales using operational satellite data. Global Change Biology, v. 20, n. 4, p. 1191-1210, 2014. Doi: 10.1111/gcb.12443
» https://doi.org/10.1111/gcb.12443 -
JESUS, J. B D.; KUPLICH, T. M.; BARRETO, Í. D. DE C.; GAMA, D. C. Dual polarimetric decomposition in Sentinel-1 images to estimate aboveground biomass of arboreal caatinga. Remote Sensing Applications: Society and Environment, v. 29, p. 1-10, 2023. Doi: 10.1016/J.RSASE.2022.100897
» https://doi.org/10.1016/J.RSASE.2022.100897 -
JIA, X.; MU, Y.; ZHA, T.; WANG, B.; QIN, S.; TIAN, Y. Seasonal and interannual variations in ecosystem respiration in relation to temperature, moisture, and productivity in a temperate semi-arid shrubland. Science of The Total Environment , v. 709, p. 136210, 2020. Doi: 10.1016/j.scitotenv.2019.136210
» https://doi.org/10.1016/j.scitotenv.2019.136210 -
KIILL, L. H. P. Characterization of the vegetation of the Embrapa Semiarid legal reserve. 1. ed. Petrolina: Embrapa Semiárido, 2017. Disponível em: https://ainfo.cnptia.embrapa.br/digital/bitstream/item/172951/1/SDC281.pdf Acesso em: 26 nov. 2023
» https://ainfo.cnptia.embrapa.br/digital/bitstream/item/172951/1/SDC281.pdf -
LANDIS, J. R.; KOCH, G. G. The measurement of observer agreement for categorical data. Biometrics. Washington, p. 159 - 174, v. 33, n. 1, 1977. Doi: 10.2307/2529310
» https://doi.org/10.2307/2529310 -
LEES, K. J.; QUAIFE, T.; ARTZ, R. R. E.; KHOMIK, M.; CLARK, J. M. Potential for using remote sensing to estimate carbon fluxes across northern peatlands - A review. Science of The Total Environment , Amsterdam, v. 615, p. 857-874, 2018. Doi: 10.1016/j.scitotenv.2017.09.103
» https://doi.org/10.1016/j.scitotenv.2017.09.103 -
LI, Q.; XIA, J.; SHI, Z.; HUANG, K.; DU, Z.; LIN, G.; LUO, Y. Variation of parameters in a Flux-Based Ecosystem Model across 12 sites of terrestrial ecosystems in the conterminous USA. Ecological Modelling , Texas, v. 336, p. 57-69, 2016. Doi: 10.1016/j.ecolmodel.2016.05.016
» https://doi.org/10.1016/j.ecolmodel.2016.05.016 -
LIU, J. F.; CHEN, S. P.; HAN, X. G. Modeling gross primary production of two steps in Northern China using MODIS time series and climate data. Procedia Environmental Sciences, v. 13, p. 742-754, 2012. Doi: 10.1016/j.proenv.2012.01.068
» https://doi.org/10.1016/j.proenv.2012.01.068 -
LLOYD, J.; TAYLOR, J. A. On the Temperature Dependence of Soil Respiration. Functional Ecology, v. 8 n. 3, p. 315-323, 1994. Doi: 10.2307/2389824
» https://doi.org/10.2307/2389824 -
MASELLI, F.; VACCARI, F. P.; CHIESI, M.; ROMANELLI, S.; D'ACQUI, L. P. Modeling and analyzing the water and carbon dynamics of Mediterranean macchia by the use of ground and remote sensing data. Ecological Modeling, v. 351, p. 1-13, 2017. Doi: 10.1016/j.ecolmodel.2017.02.012
» https://doi.org/10.1016/j.ecolmodel.2017.02.012 -
MENDES, K. R.; CAMPOS, S.; MUTTI, P. R.; FERREIRA, R. R.; RAMOS, T. M.; MARQUES, T. V.; REIS, J. S.; VIEIRA, M. M.L.; SILVA, A. C. N.; MARQUES, A. M. S.; SILVA, D. T. C., SILVA, D. F.; OLIVEIRA, C. P.; GONÇALVES, W. A.; COSTA, G. B.; POMPELLI, M. F.; MARENCO, R. A; ANTONINO, A. C. D.; MENEZES, R. S. C.; SILVA, C. M. S. E. Assessment of SITE for CO2 and Energy Fluxes Simulations in a Seasonally Dry Tropical Forest (Caatinga Ecosystem). Forests, v. 12, p. 86, 2021. Doi: 10.3390/F12010086
» https://doi.org/10.3390/F12010086 -
MIRANDA, R. Q.; NÓBREGA, R. L. B.; MOURA, M. S. B.; RAGHAVAN, S.; GALVÍNCIO, J. D. Realistic and simplified models of plant and leaf area indices for a seasonally dry tropical forest. International Journal of Applied Earth Observation and Geoinformation, v. 85, p. 101992, 2020. Doi: 10.1016/j.jag.2019.101992
» https://doi.org/10.1016/j.jag.2019.101992 -
MORAIS, Y. C. Spatial and temporal variation of gross primary production in the caatinga biome. 2019. Tese (Doutorado em Desenvolvimento e Meio Ambiente). UFPE, 2019. Disponível em: https://repositorio.ufpe.br/handle/123456789/33940 Acesso em: 01 nov, 2019.
» https://repositorio.ufpe.br/handle/123456789/33940 -
MOURA, M. S. B.; GALVÍNCIO, J. D. G.; BRITO, L. T. L.; SOUZA, L. S. B.; SÁ, I. I. S.; SILVA, T. G. F. Climate and rainwater in the Semi-Arid. In: BRITO, L.T. L.; MOURA, M. S. B.; GAMA, G.F.B (org.). Potentialities of rainwater in the Brazilian Semi-Arid. Petrolina: Embrapa Semi-Árido, 2007. Disponível em: https://www.alice.cnptia.embrapa.br/bitstream/doc/159649/1/OPB1515.pdf Acesso em: 15 dez. 2022.
» https://www.alice.cnptia.embrapa.br/bitstream/doc/159649/1/OPB1515.pdf -
PEREIRA, M. P. S.; MENDES, K. R.; JUSTINO, F.; COUTO, F.; SILVA, A. S.; SILVA, D. F.; MALHADO, A. C. M. Brazilian Dry Forest (Caatinga) Response To Multiple ENSO: the role of Atlantic and Pacific Ocean. Science of The Total Environment , v. 705, p. 135717, 2020. Doi: 10.1016/j.scitotenv.2019.135717
» https://doi.org/10.1016/j.scitotenv.2019.135717 -
PRAKASH, S. D.; SHANKAR, B.; RANJAN PARIDA, B. Machine learning approach to predict terrestrial gross primary productivity using topographical and remote sensing data. Ecological Informatics, v. 70, p. 101697, 2022. Doi: 10.1016/j.ecoinf.2022.101697
» https://doi.org/10.1016/j.ecoinf.2022.101697 -
REICHSTEIN, M.; FALGE, E.; BALDOCCHI, D.; PAPALE, D.; AUBINET, M.; BERBIGIER, P.; BERNHOFER, C.; BUCHMANN, N.; GILMANOV, T.; GRANIER, A.; GRÜNWALD, T.; HAVRÁNKOVÁ, K.; ILVESNIEMI, H.; JANOUS, D.; KNOHL, A.; LAURILA, T.; LOHILA, A.; LOUSTAU, D.; MATTEUCCI, G.; VALENTINI, R. On the separation of net ecosystem exchange into assimilation and ecosystem respiration: review and improved algorithm. Global Change Biology , v. 9, n. 11, p. 1424-1439, 2005. Doi: 10.1111/J.1365-2486.2005.001002.X
» https://doi.org/10.1111/J.1365-2486.2005.001002.X -
SILVA, J. N. B.; GALVÍNCIO, J. D.; MIRANDA, R. D. Q.; MOURA, M. S. B. Temporal and spatial estimation of the performance of calibrated regression models for carbon fluxes in the Caatinga Seasonally Dry Tropical Forest area. Revista Da Casa Da Geografia de Sobral (RCGS), v. 26, n. 1, p. 183-206, 2024. Doi: 10.35701/rcgs.v26.975
» https://doi.org/10.35701/rcgs.v26.975 -
SILVA, J. N. B.; GALVÍNCIO, J. D.; MIRANDA, R. D. Q.; MOURA, M.S.B. Models of Gross Primary Productivity in seasonally dry tropical forest areas, using reflectance data from caatinga vegetation. Brazilian Journal of Physical Geography, v. 14, p. 3775-3784, 2021. Doi: 10.26848/rbgf.v14.6.p3775-3784
» https://doi.org/10.26848/rbgf.v14.6.p3775-3784 -
SILVA, J. N. B.; SILVA, J. L. B.; SANTOS, A. M.; SILVA, A. C.; GALVÍNCIO, J. D. Vegetation Index as a Subsidy in the Identification of Areas With Potential for Desertification. Journal of Environmental Analysis and Progress, v. 4 n. 2, p. 358-367, 2017. Doi: 10.24221/jeap.2.4.2017.1469.358-367
» https://doi.org/10.24221/jeap.2.4.2017.1469.358-367 -
SILVA, J. N. B; GALVÍNCIO, J. D.; SILVA, J. L. B; SOARES, G. A. S; SILVA, J. F. B. Analysis of the spatial distribution of carbon fluxes in the caatinga ecosystem. Brazilian Journal of Remote Sensing, v. 123, p. 115-123, 2024. Doi: 10.5281/zenodo.11332937
» https://doi.org/10.5281/zenodo.11332937 -
SILVA, P. F.; LIMA, J. R. S; ANTONINO, A. C. D; SOUZA, R.; SOUZA, E. S.; SILVA, J. R. I; ALVES, E. M. Seasonal patterns of carbon dioxide, water and energy fluxes over the Caatinga and grassland in the semi-arid region of Brazil. Journal of Arid Environments, v. 147, p. 71-82, 2017. Doi: 10.1016/j.jaridenv.2017.09.003
» https://doi.org/10.1016/j.jaridenv.2017.09.003 -
SILVA, J. N. B.; GALVÍNCIO, J. D.; SILVA, J. L. B.; SOARES, G. A. S.; TIBURCIO, I. M.; BARROS, J. P. F. G. Estimates of carbon sequestration by different methods in forest ecosystems: an approach to the seasonally dry tropical forest (Caatinga). Brazilian Journal of the Environment, v. 93, p. 75-93, 2024. Doi: 10.5281/zenodo.11267197
» https://doi.org/10.5281/zenodo.11267197 -
SUN, J.; ZHOU, T. C.; LIU, M.; CHEN, Y. C.; LIU, G. H.; XU, M.; SHI, P. L.; PENG, F.; TSUNEKAWA, A.; LIU, Y.; WANG, X. D.; DONG, S. K.; ZHANG, Y. J.; LI, Y. N. Water and heat availability are drivers of the aboveground plant carbon accumulation rate in alpine grasslands on the Tibetan Plateau. Global Ecology and Biogeography, v. 29, p. 50-64, 2020. Doi: 10.1111/geb.13006
» https://doi.org/10.1111/geb.13006 -
TABARELLI, M.; LEAL, I. R.; SCARANO, F. R.; SILVA, J. M. C. Caatinga: legacy, trajectory and challenges towards sustainability. Science and Culture, n. 70, v. 4, p. 25-29, 2018. Doi: 10.21800/2317-66602018000400009
» https://doi.org/10.21800/2317-66602018000400009 -
THE R FOUNDATION. A: The R Project for Statistical Computing. 2018. Disponível em: https://www.r-project.org/. Acesso em: 10 maio, 2023.
» https://www.r-project.org -
VAIDYA, S.; SCHMIDT, M.; RAKOWSKI, P.; BONK, N.; VERCH, G.; AUGUSTIN, J.; SOMMER, M.; HOFFMANN, M. A novel robotic chamber system allowing to accurately and precisely determine spatio-temporal CO2 flux dynamics of heterogeneous croplands. Agricultural and Forest Meteorology , v. 296, p. 108206, 2021. Doi: 10.1016/j.agrformet.2020.108206
» https://doi.org/10.1016/j.agrformet.2020.108206 -
WANG, L.; ZHU, H., LIN, A.; ZOU, L.; QIN, W.; DU, Q. Evaluation of the Latest MODIS GPP Products across Multiple Biomes Using Global Eddy Covariance Flux Data. Remote Sensing, n. 9 v. 5, 2017. Doi: 10.3390/rs9050418
» https://doi.org/10.3390/rs9050418 -
WU, C.; GAUMONT-GUAY, D.; ANDREW BLACK, T.; JASSAL, R. S.; XU, S.; CHEN, J. M.; GONSAMO, A. Soil respiration mapped by exclusively use of MODIS data for forest landscapes of Saskatchewan, Canada. ISPRS Journal of Photogrammetry and Remote Sensing , v. 94, p. 80-90, 2014. Doi: 10.1016/j.isprsjprs.2014.04.018
» https://doi.org/10.1016/j.isprsjprs.2014.04.018 -
XUE, Y.; LIANG, H.; ZHANG, H.; YIN, L.; FENG, X. Quantifying the policy-driven large scale vegetation restoration effects on evapotranspiration over drylands in China. Journal of Environmental Management, n. 345, p. 118723, 2023. Doi: 10.1016/j.jenvman.2023.118723
» https://doi.org/10.1016/j.jenvman.2023.118723 -
ZHANG, X.; ZHANG, F.; QI, Y.; DENG, L.; WANG, X.; YANG, S. New research methods for vegetation information extraction based on visible light remote sensing images from an unmanned aerial vehicle (UAV). International Journal of Applied Earth Observation and Geoinformation , v. 78, p. 215-226, 2019. Doi: 10.1016/J.JAG.2019.01.001
» https://doi.org/10.1016/J.JAG.2019.01.001 -
ZHOU, Y.; LI, X.; GAO, Y.; HE, M.; WANG, M.; WANG, Y.; ZHAO, L.; LI, Y. Carbon fluxes response of an artificial sand-binding vegetation system to rainfall variation during the growing season in the Tengger Desert. Journal of Environmental Management , v. 266, p. 110556, 2020. Doi: 10.1016/j.jenvman.2020.110556
» https://doi.org/10.1016/j.jenvman.2020.110556
-
ACKNOWLEDGEMENTS
The authors would like to thank the Fundação de Amparo à Ciência e Tecnologia do Estado de Pernambuco (FACEPE) for financial assistance (process no.: IBPG-0030-9.25/18), Embrapa Semiárido for providing field data, and the Sensoriamento Remoto e Geoprocessamento Laboratory (SERGEO) and the Universidade Federal de Pernambuco (UFPE).

 Source:
  Source: The authors (2024).
 Source: The authors (2024).
 Source: The authors (2024).
 Source: The authors (2024).
 Source: The authors (2024).
 Source: The authors (2024).