 Genetic structure and diversity of Gliricidia sepium in Brazil: implications for conservation and breeding
ABSTRACT:
Gliricidia sepium is a tree species native to the Americas that has been disseminated throughout various regions of the world due to its drought adaptability. In response to the productive sector's demand for the development of cultivars, Empresa Brasileira de Pesquisa Agropecuária (Embrapa) has invested in breeding initiatives. These include establishing a germplasm bank and identifying individuals with agronomic traits of interest. This study aimed to estimate the genetic diversity of gliricidia in the different regions of Brazil and to establish a germplasm bank using inter simple sequence repeat (ISSR) markers. Plant material was obtained through field collections and exchanges with other institutions from 17 populations from five Brazilian states, and young leaves were collected from a total of 115 individuals. The ISSR markers yielded 36 bands with 88.9 % polymorphism and an average polymorphism information content (PIC) of 0.27. The evaluated parameters indicated low genetic diversity, with a Shannon index (I) of 0.19, Nei's Genetic Distance of 0.21, and an expected heterozygosity (He) of 0.13. A unweighted pair group method with arithmetic mean (UPGMA) analysis clustered the individuals into six groups, indicating a restricted origin for the gliricidia genetic material. Genetic structure analysis using the Structure software indicated the formation of two main groups, along with individuals with mixed ancestry, suggesting partial genetic admixture between the groups. The results of this study will guide the breeding program for gliricidia, with the germplasm bank continuously evaluated and enriched with new accessions.
Keywords:
ISSR markers; genetic resources; germplasm bank; tropical forage
Introduction
Gliricidia (Gliricidia sepium (Jacq.) Kunth ex Walp, Fabaceae) is a tree species native to the tropical and subtropical regions of the Americas, originating in Central America (Nogueira de Sá et al., 2021). In addition to its relevance as forage in livestock systems, it is considered of agricultural interest for arid climate regions on account of its rapid growth, high regenerative capacity, and ability to reproduce sexually and asexually (Kill and Drumond, 2001). In Brazil, the introduction of this species occurred through the importation of germplasm from Costa Rica in 1978, by the Comissão Executiva do Plano da Lavoura Cacaueira; from Nicaragua in 1987, through an agreement with the Oxford Forestry Institute; and from Bolivia in the 1990s, through the Centro de Investigación Agricola Tropical.
Gliricidia is a plant recommended for improving soil fertility, particularly in degraded areas and agrosilvopastoral systems (Kaba et al., 2019). The species has leaves rich in protein (18 to 30 %) (Pérez-Almario et al., 2023), which are used as high-quality forage source, in the form of silage or hay, for dietary supplementation of lambs of tropical sheep breeds (Santana Neto et al., 2015).
The first study of gliricidia genetic diversity was conducted by Dawson et al. (1995), who reported genetically homogeneous populations in Guatemala. Studies with legume trees have provided a more detailed understanding of genetic relationships among accessions, contributing to a deeper understanding of the studied species (Yildirim et al., 2024). As regards the gliricidia, there is a gap to be filled on the species, as this is the first genetic diversity study conducted in Brazil.
In response to the high demand from farmers for information and materials on gliricidia, Empresa Brasileira de Pesquisa Agropecuária (Embrapa) - Tabuleiros Costeiros organized the agricultural solution ‘GliriTec’ in 2019. This initiative includes a set of integrated solutions systems such as ‘GliriNutri’ (which incorporates gliricidia as an animal nutrition component), ‘GliriCoco’ (which integrates gliricidia as an arboreal component with coconut trees), ‘GliriCitrus’ (which incorporates gliricidia as a forestry component into citrus farming), and ‘GliriILPF’ (an integrated Crop-Livestock-Forestry system). In 2023, the first activities focused on genetic improvement and cultivar development were initiated. Thus, this study aimed to evaluate the genetic diversity of G. sepium across different regions using inter simple sequence repeat (ISSR) markers and to establish the first gliricidia germplasm bank in Brazil.
Materials and Methods
Germplasm collection, exchange, and seedling production
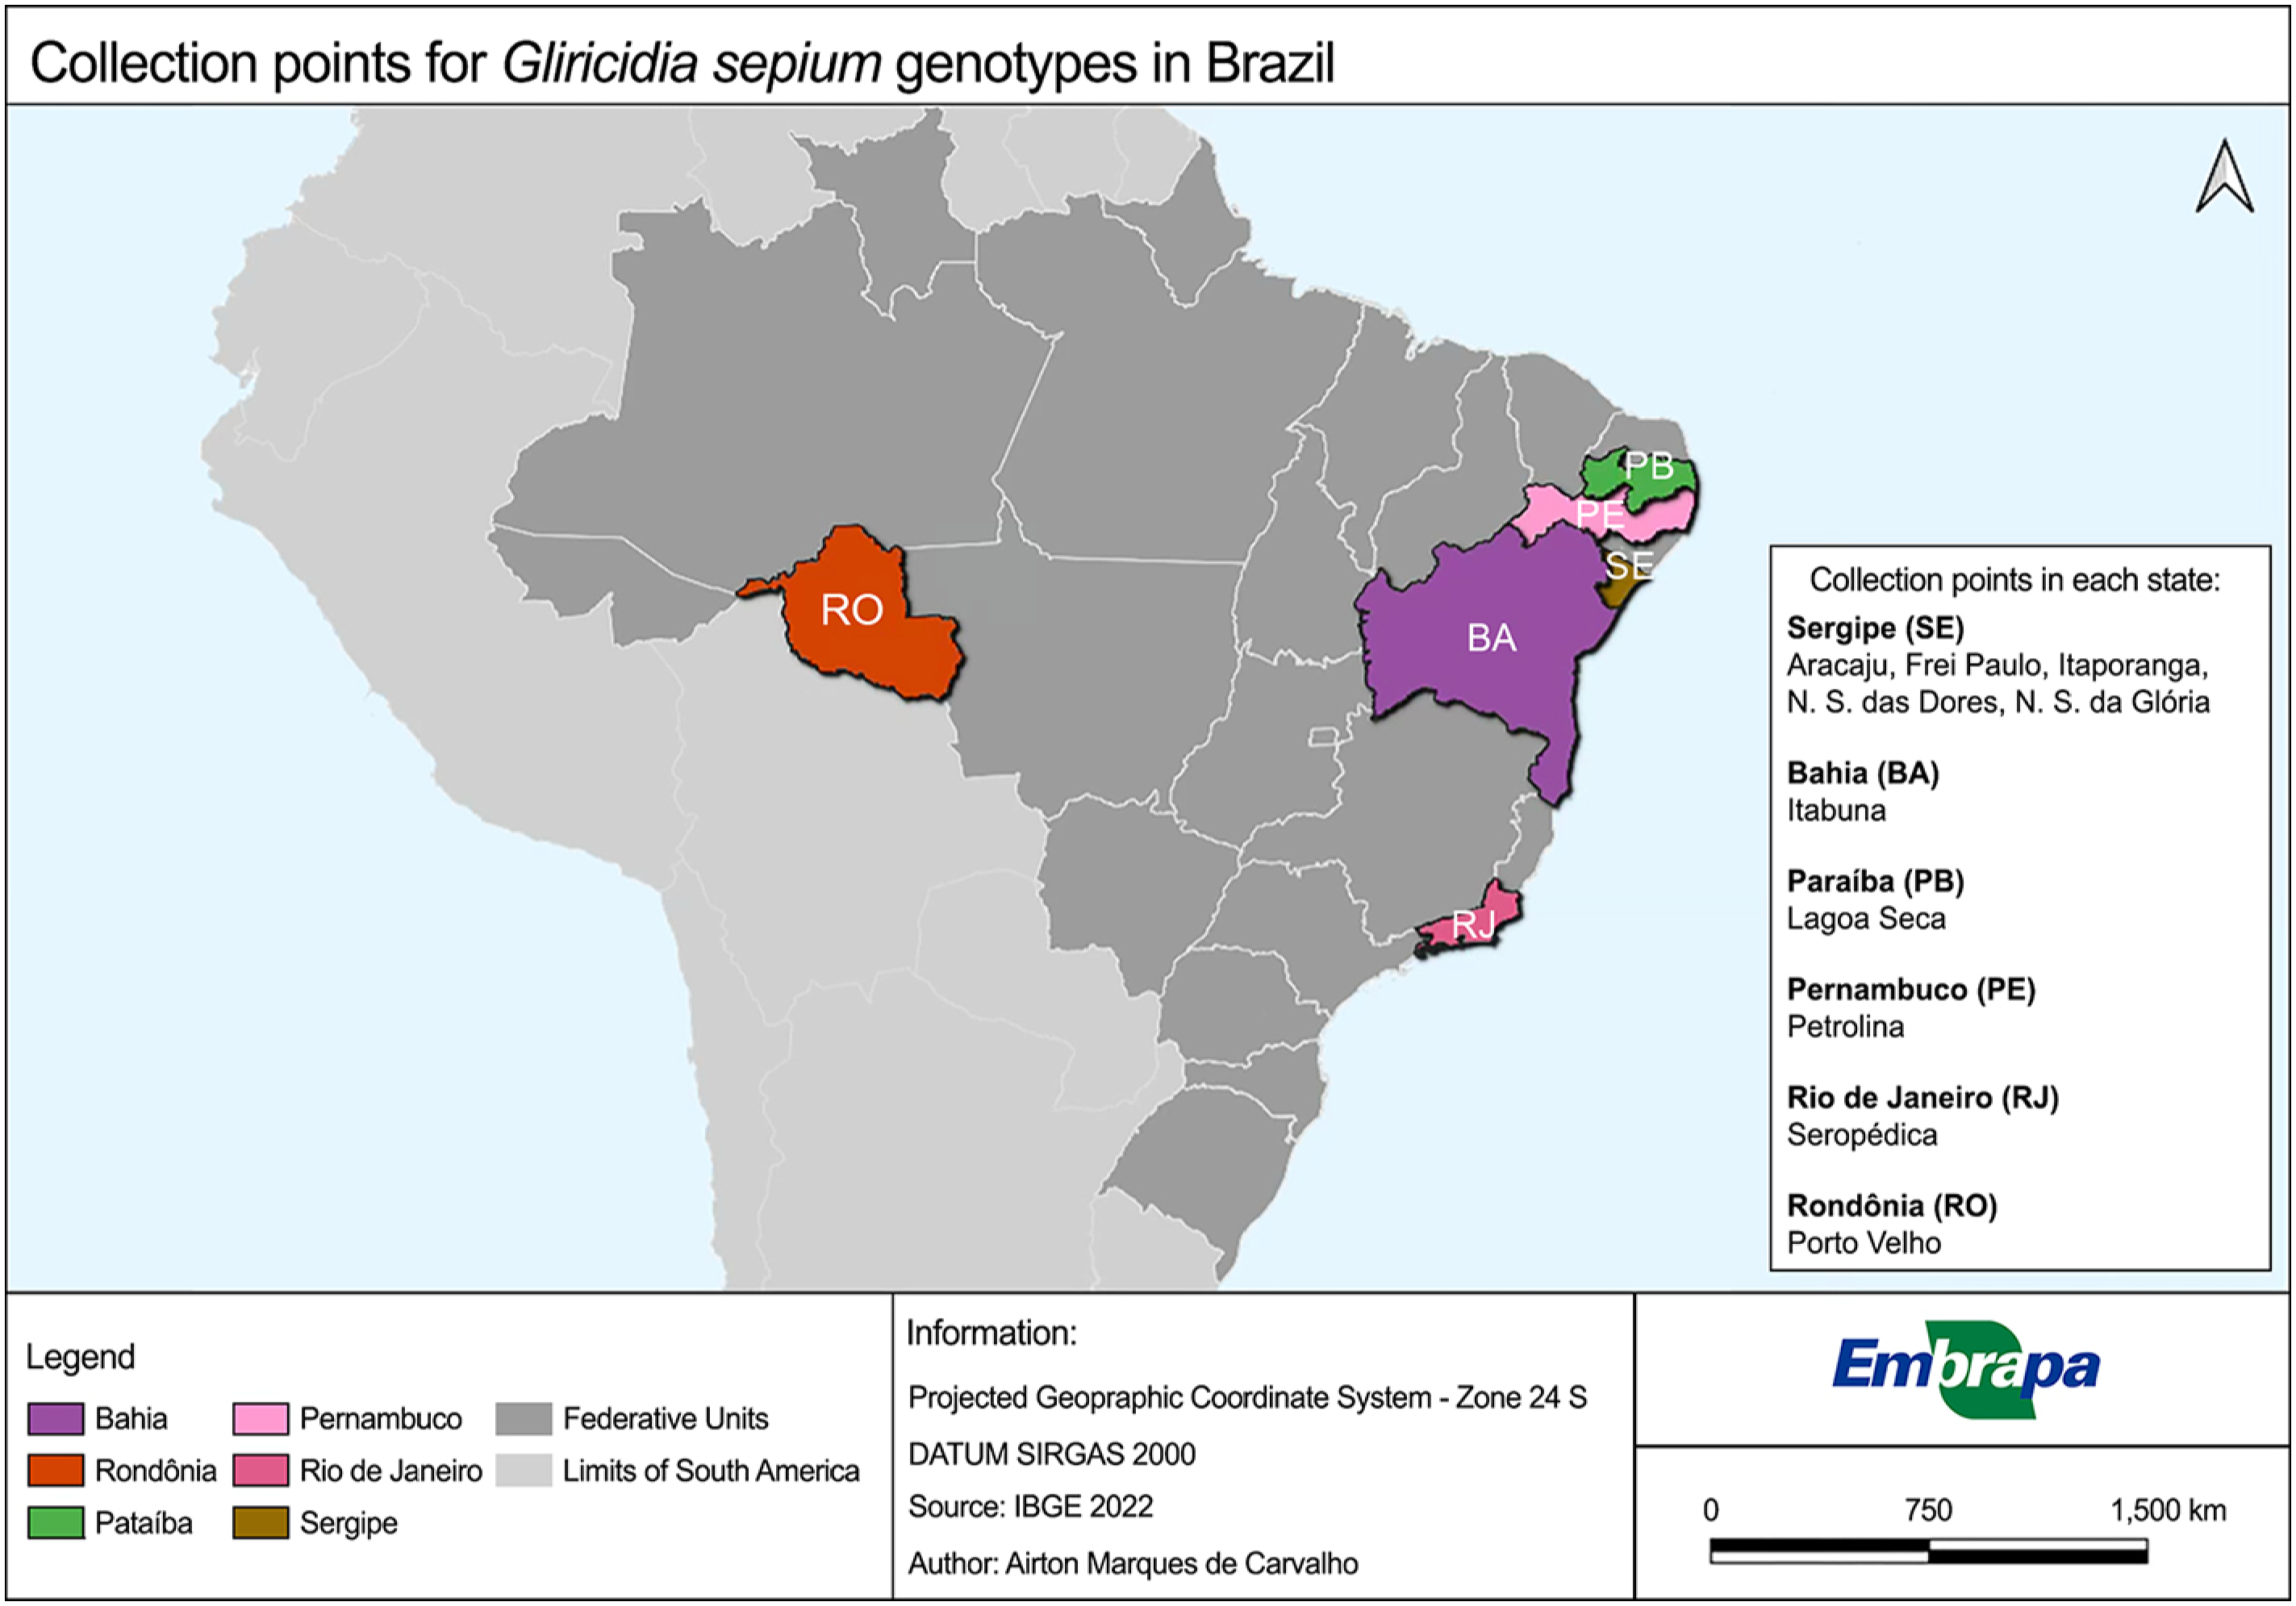
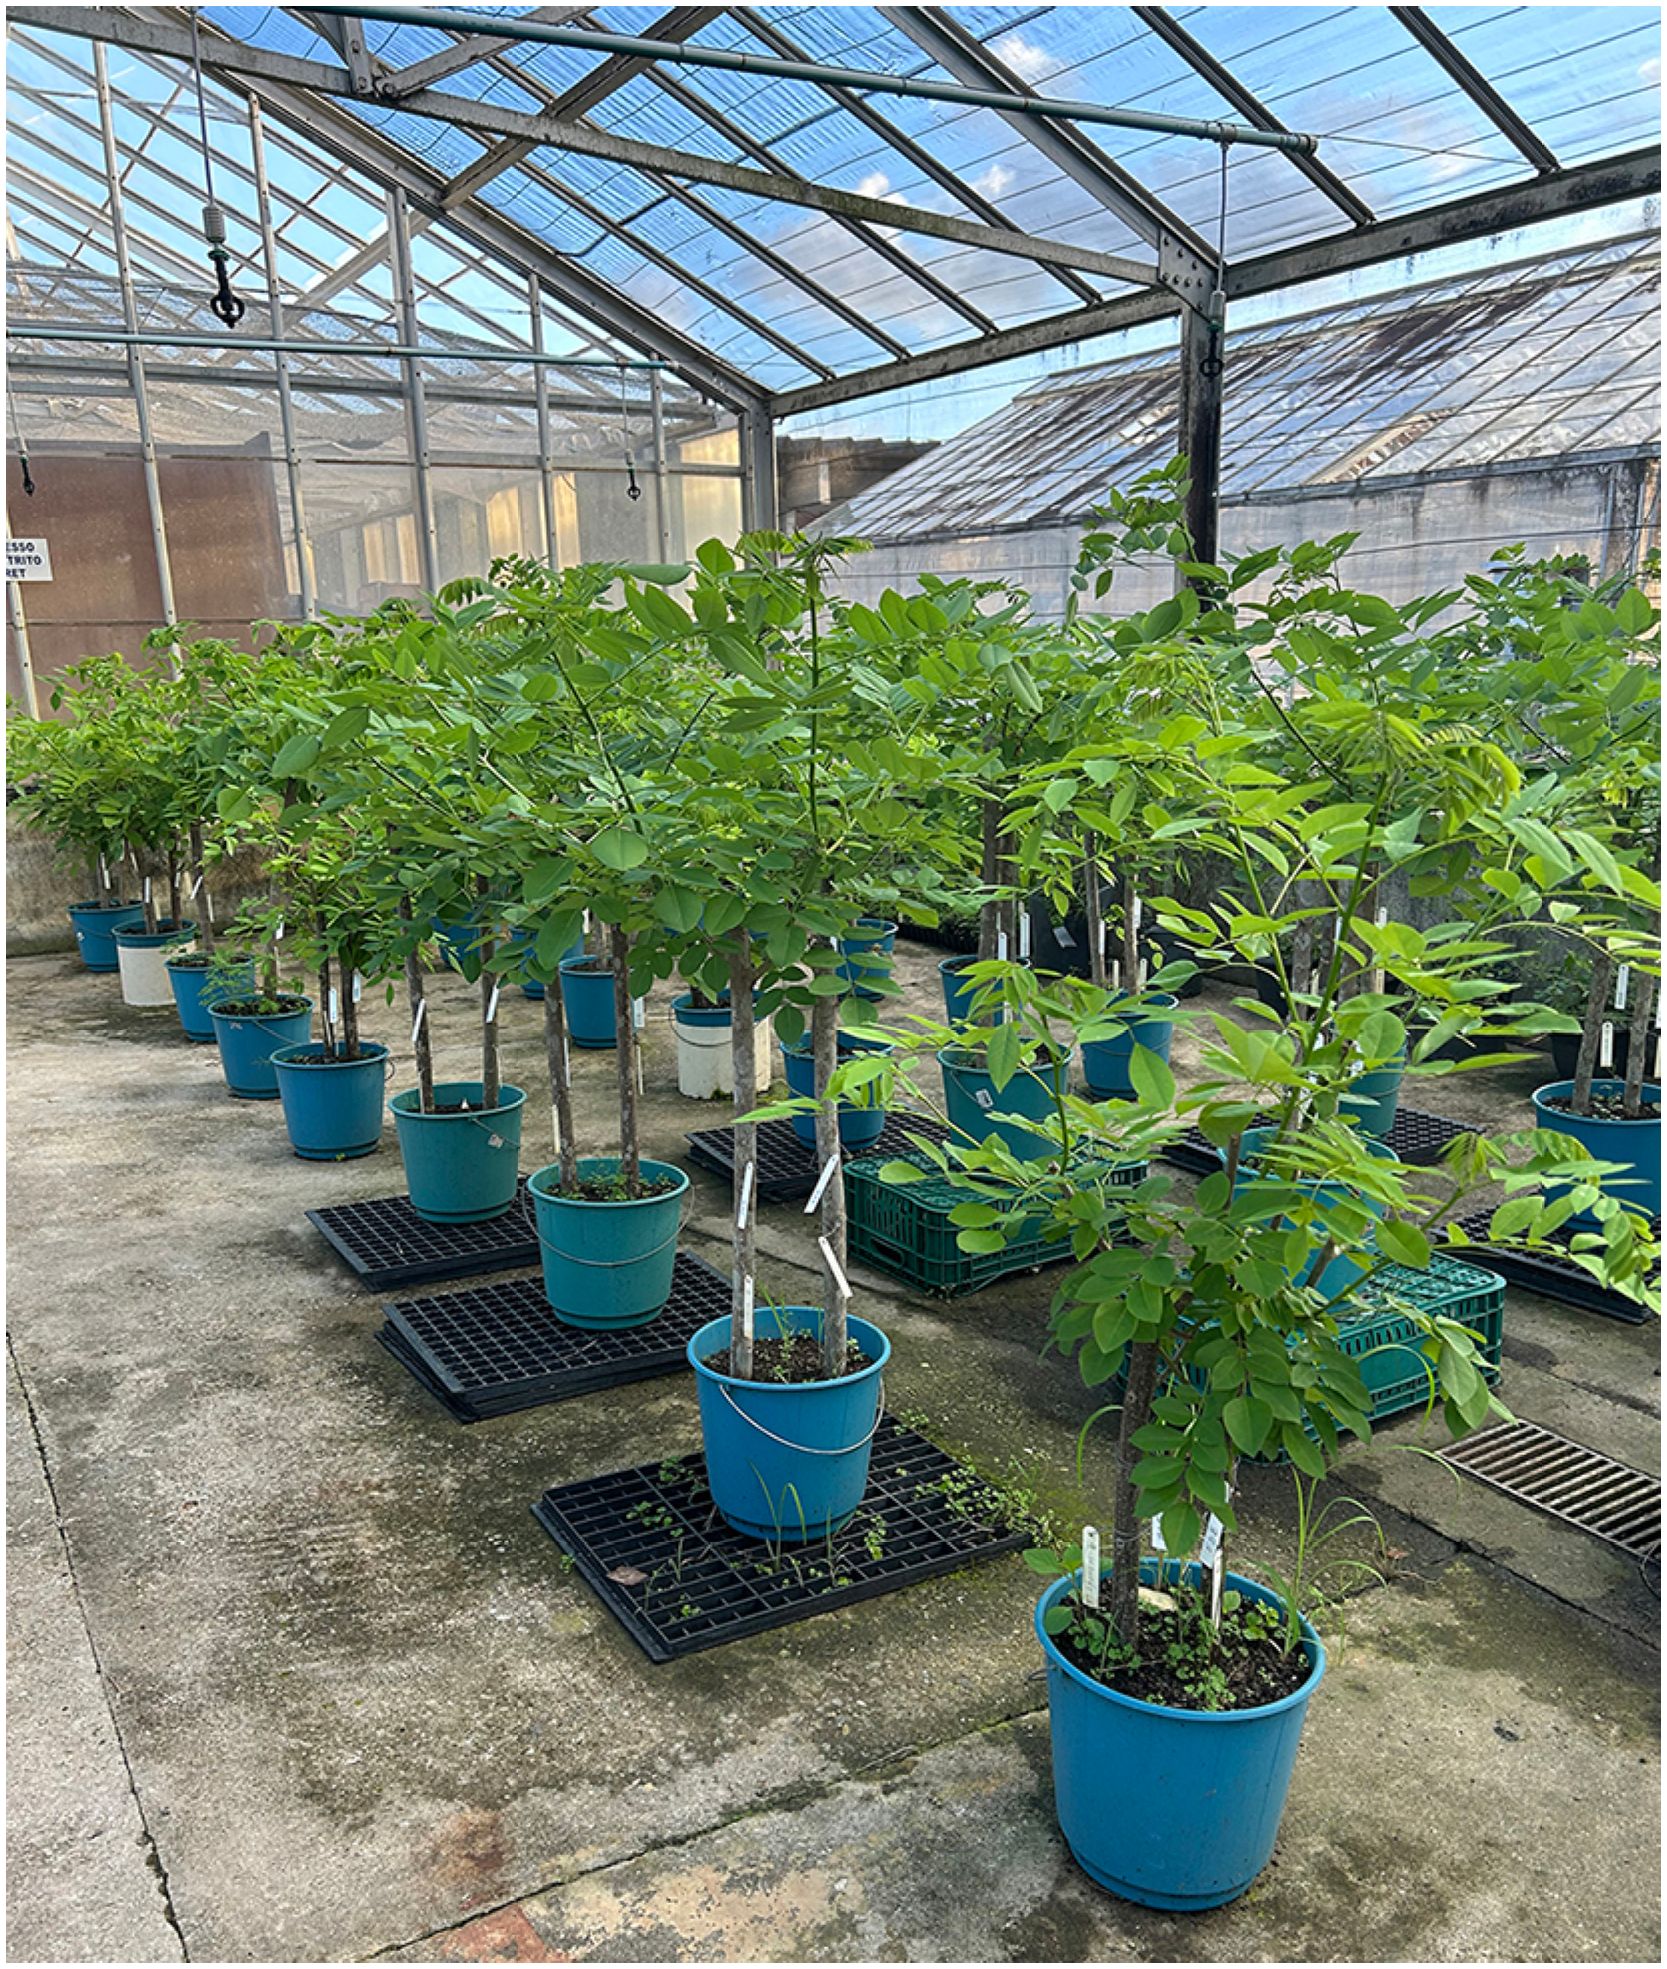
Gliricidia cuttings were collected or acquired through germplasm exchange with other institutions. The material originated from 17 populations in the states of Bahia, Paraíba, Pernambuco, Rio de Janeiro, Roraima, and six municipalities in the state of Sergipe (Frei Paulo, Itaporanga, Nossa Senhora das Dores, Nossa Senhora da Glória, Simão Dias, Umbaúba, and Aracaju) (Table 1, Figure 1). The cuttings were semi-woody or woody, approximately 40 cm long and 3 cm in diameter, and were propagated between Feb and May 2023 at Embrapa Tabuleiros Costeiros in Aracaju, Sergipe state, Brazil (10°55’56" S, 37°04’23" W, altitude 4 m), in 8 L plastic containers, using soil from the Umbaúba Experimental Field (1:1) as substrate (Figure 2). They were kept in a greenhouse with 50 % shading and irrigated by an automated system for four to six months to promote rooting of the cuttings.
Provenance and number of genotypes in the Gliricidia germplasm bank. Experimental field of Empresa Brasileira de Pesquisa Agropecuária - Tabuleiros Costeiros in Umbaúba, Sergipe state, Brazil.
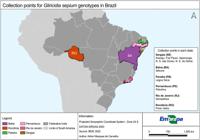
Location of the populations where the materials for the gliricidia germplasm bank of Empresa Brasileira de Pesquisa Agropecuária (Embrapa) Tabuleiros Costeiros were collected.
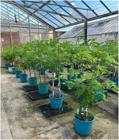
Gliricidia seedling production, Empresa Brasileira de Pesquisa Agropecuária - Tabuleiros Costeiros, Aracaju, Sergipe state, Brazil.
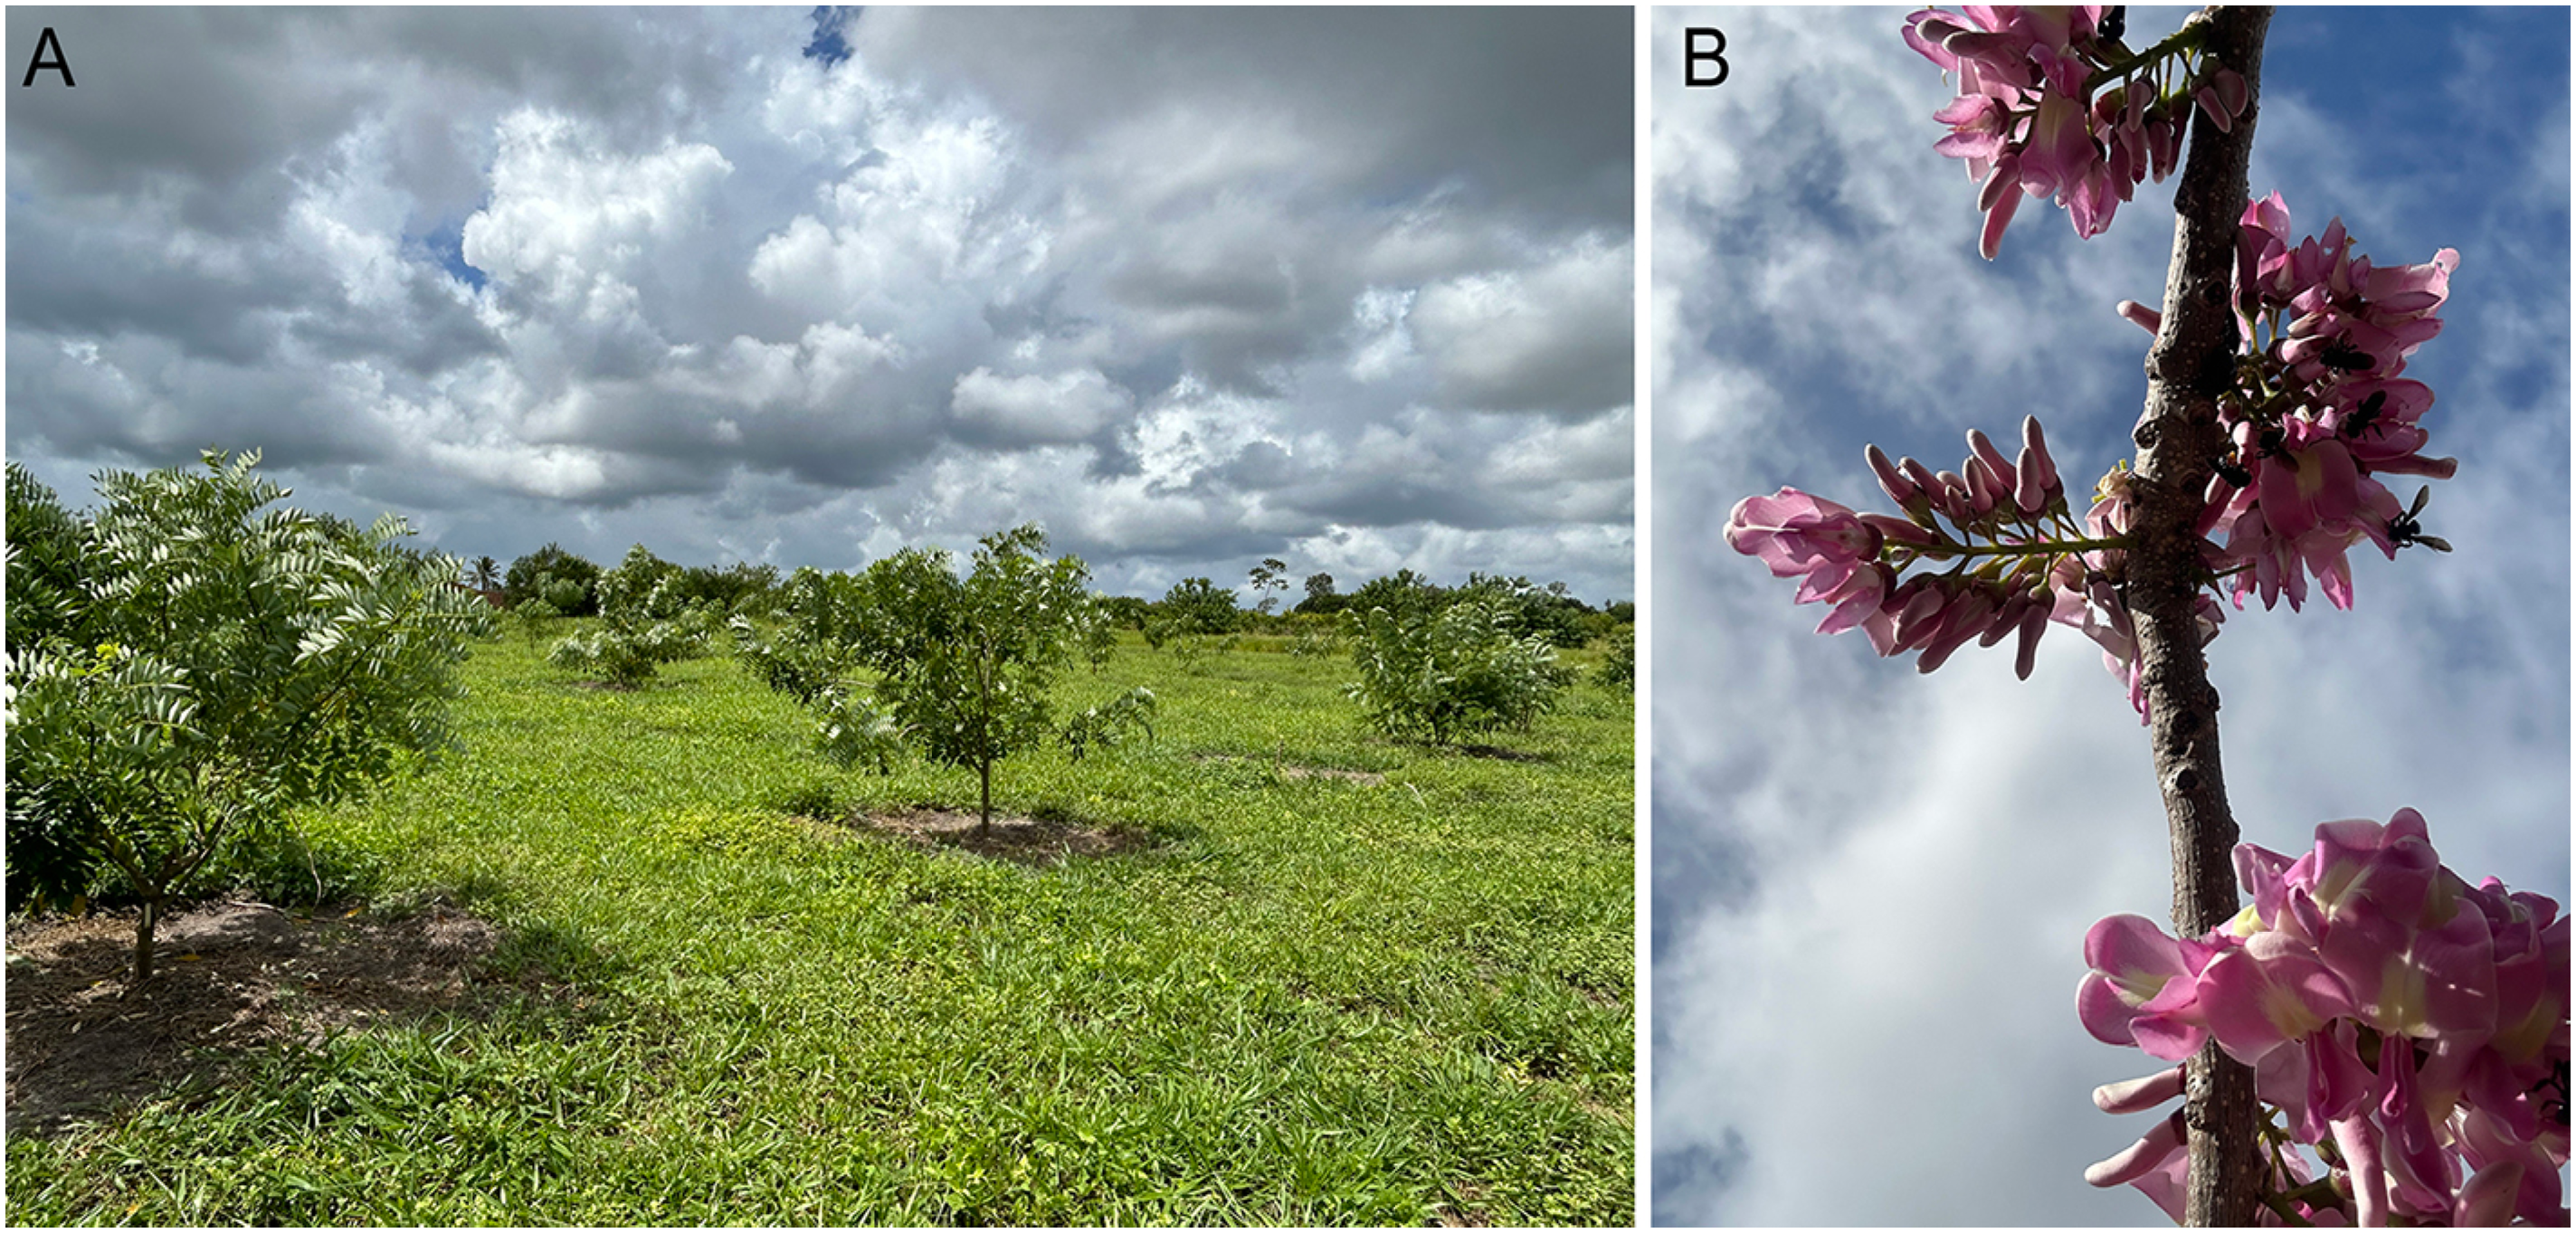
The gliricidia germplasm bank was established in the experimental field of Umbaúba, in the Sergipe state, Brazil (11°22’50,11" S, 37°40’29,70" W, altitude 50 m) (Figure 3A and B).
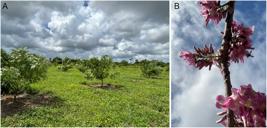
A) Gliricidia germplasm bank and B) inflorescence with pollinator. Experimental field of Empresa Brasileira de Pesquisa Agropecuária - Tabuleiros Costeiros in Umbaúba, Sergipe state, Brazil.
DNA extraction
A total of 115 plants were used in this study. Young leaves from each individual were collected and stored on ice for transporting to the laboratory, where they were stored at –80 °C until DNA extraction using the methodology of Doyle and Doyle (1990). The leaves were macerated with 1 mL of cetyltrimethylammonium bromide buffer, and the extracted DNA was quantified using a Nanodrop 2000c spectrophotometer. The samples were then diluted in Tris-Ethylenediaminetetraacetic acid to a concentration of 10 ng µL−1 and stored at –20 °C for polymerase chain reaction (PCR) amplifications.
Polymerase Chain Reaction
The PCR reaction (20 µL per sample) was prepared with 1 µL of genomic DNA solution, 4 µL of 10X PCR buffer, 0.4 µL of deoxynucleoside triphosphate (10 mM), 2.0 µL of MgCl2 (50 mM), 1 µL of primer, 0.1 µL of Ludwig Taq DNA polymerase, and 10.5 µL of ultrapure water. The samples were placed in an Applied Biosystem thermocycler programmed to amplify the DNA. Each reaction consisted of a denaturation stage at 95 °C for 2 min, 35 cycles of amplification (denaturation at 95 °C for 1 min, annealing at the specific temperature of each primer for 1 min, and a first extension at 72 °C for 1 min), followed by a final extension at 72 °C for 5 min. Nine ISSR primers were tested (Table 2).
Sequence and annealing temperature (AT) of inter simple sequence repeats (ISSR) markers used to characterize the diversity and genetic structure of the gliricidia germplasm bank of Empresa Brasileira de Pesquisa Agropecuária - Tabuleiros Costeiros in Umbaúba, Sergipe state, Brazil.
Electrophoresis and ISSR marker analysis
After PCR amplification, the samples were analyzed by electrophoresis. Were prepared a 2 %-agarose gels and run at a constant voltage of 182 V, 91 mA, and 17 W for 115 min. After electrophoresis, the gels were stained with an ethidium bromide solution (0.5 µL mL−1 of water) for 30 min. Subsequently, the agarose gels were visualized under ultraviolet light with the Gel Doc L-Pix photo documentation system (Loccus Biotecnologia).
Genetic diversity and statistical analysis
For each gel, the presence (1) or absence (0) of bands was converted into a binary matrix, and the polymorphism information content (PIC) was calculated for the markers (Ghislain et al., 1999). The genetic variability of each accession was assessed using the Shannon index (I), which allows for the distinguishing of the genetic variation between populations with the same number of alleles, and expected heterozygosity (He), which represents the diversity of a locus describing the proportion of heterozygous genotypes expected under Hardy Weinberg equilibrium (Nei, 1973). The number of observed alleles (Na) and the number of effective alleles (Ne) were also calculated.
The genetic variance between and within accessions was estimated using the analysis of molecular variance (AMOVA), and significance was determined by 9,999 permutations. The genetic distance between accessions was estimated (Nei, 1973), as a measure of total genetic variation, and its significance was tested using 10,000 bootstraps replicates. Additionally, the Nei genetic distance between the accessions was estimated, and a principal coordinates analysis (PCoA) was carried out for individuals.
The grouping of accessions was evaluated using Rogers’ genetic distance (1972) and visualized in a dendrogram constructed with unweighted pair group method with arithmetic mean (UPGMA) algorithm. The analysis was performed using the Multivariate Analysis package in the software R program, which was also used to format the dendrogram. Analyses were carried out using the Multivariate Analysis package in R (version 0.5.1) and the GenAlEx 6.5 software.
The genetic structure of individuals was estimated through Bayesian analysis using the Structure software v. 2.3.4 (Pritchard et al., 2000). Number of genetic clusters (k) ranging from 1 to 17 (corresponding to the number of accessions) were tested, with ten independent replicates performed for each k. Each replicate consisted of an initial period of 50,000 interactions, followed by 100,000 Markov chain Monte Carlo (MCMC) iterations, assuming a mixed ancestry model and uncorrelated allele frequencies. The number of genetic clusters (k) was determined using the ΔK method (Evanno et al., 2005), implemented in the Structure Harvester software. Individuals who presented affiliation values lower than 0.8 were considered to be of mixed ancestry.
Results
The nine ISSR primers generated 36 bands, of which 88.9 % were polymorphic (Table 3). The PIC averaged 0.27, ranging from 0.01 to 0.37. This information helps classify primers by their efficiency in detecting polymorphism. The PIC value ranged from 0 to 0.25 for markers considered to be uninformative; from 0.25 to 0.5 for moderately informative markers; and above 0.5 for markers with highly informative content (Xie et al., 2010). Thus, the primers used can be considered to have moderate efficiency. The number of bands generated by each primer ranged from 1 (UBC 807, 810, 818, 825, and 858) to 6 (UBC 826), with an average of three bands per primer. The I observed for the gliricidia accessions was 0.194, indicating low genetic diversity, as this parameter ranges from 0 to 1, where values closer to 1 reflect greater genetic diversity.
Inter simple sequence repeat (ISSR) primers used in gliricidia with their respective total fragments, polymorphic fragments, and polymorphism percentages.
The average value of the Na was 1.21, while the average Ne was 1.23. The average expected He was 0.13. These results indicate a deficiency of heterozygotes within the populations studied. The average value of the I was 0.19 (Table 4). This index ranges from 0 to 1, with lower values indicating reduced genetic diversity (Silva et al., 2015). In this study, we observed low genetic diversity, consistent with findings by Dawson et al. (1995) in Guatemala, who reported an I of 0.23.
Average values of diversity parameters: number of observed alleles (Na), number of effective alleles (Ne), expected heterozygosity (He), and Shannon index (I) in 115 individuals of the gliricidia germplasm bank, using inter simple sequence repeat primers.
Another relevant parameter for assessing genetic diversity among the accessions was Nei's Genetic Distance. This coefficient ranges from 0 to 1, with values closer to 0 indicating grater genetic similarity and those closer to 1 reflecting greater genetic divergence. The results indicated that the greatest genetic distance was observed between populations 4 (Umbaúba) and 21 (Nossa Senhora das Dores), with a coefficient of 0.414 (Table 5). In contrast, the populations from Frei Paulo (population 19) and Caju (population 24) were the most genetically similar, with a coefficient of 0.012, suggesting high genetic similarity.
Matrix using the coefficient of Nei's Genetic Distance from gliricidia germplasm bank accessions (G) from Empresa Brasileira de Pesquisa Agropecuária - Tabuleiros Costeiros.
In the AMOVA, the smallest percentage of variability was observed between the populations, accounting for 27 %, while 73 % of the variability was found within the accessions (Table 6). This indicates that most of the genetic diversity occurs within accessions rather than between them.
Analysis of molecular variance showing the genetic variation within and among accessions from the gliricidia germplasm bank of Empresa Brasileira de Pesquisa Agropecuária - Tabuleiros Costeiros based on nine inter simple sequence repeats primers.
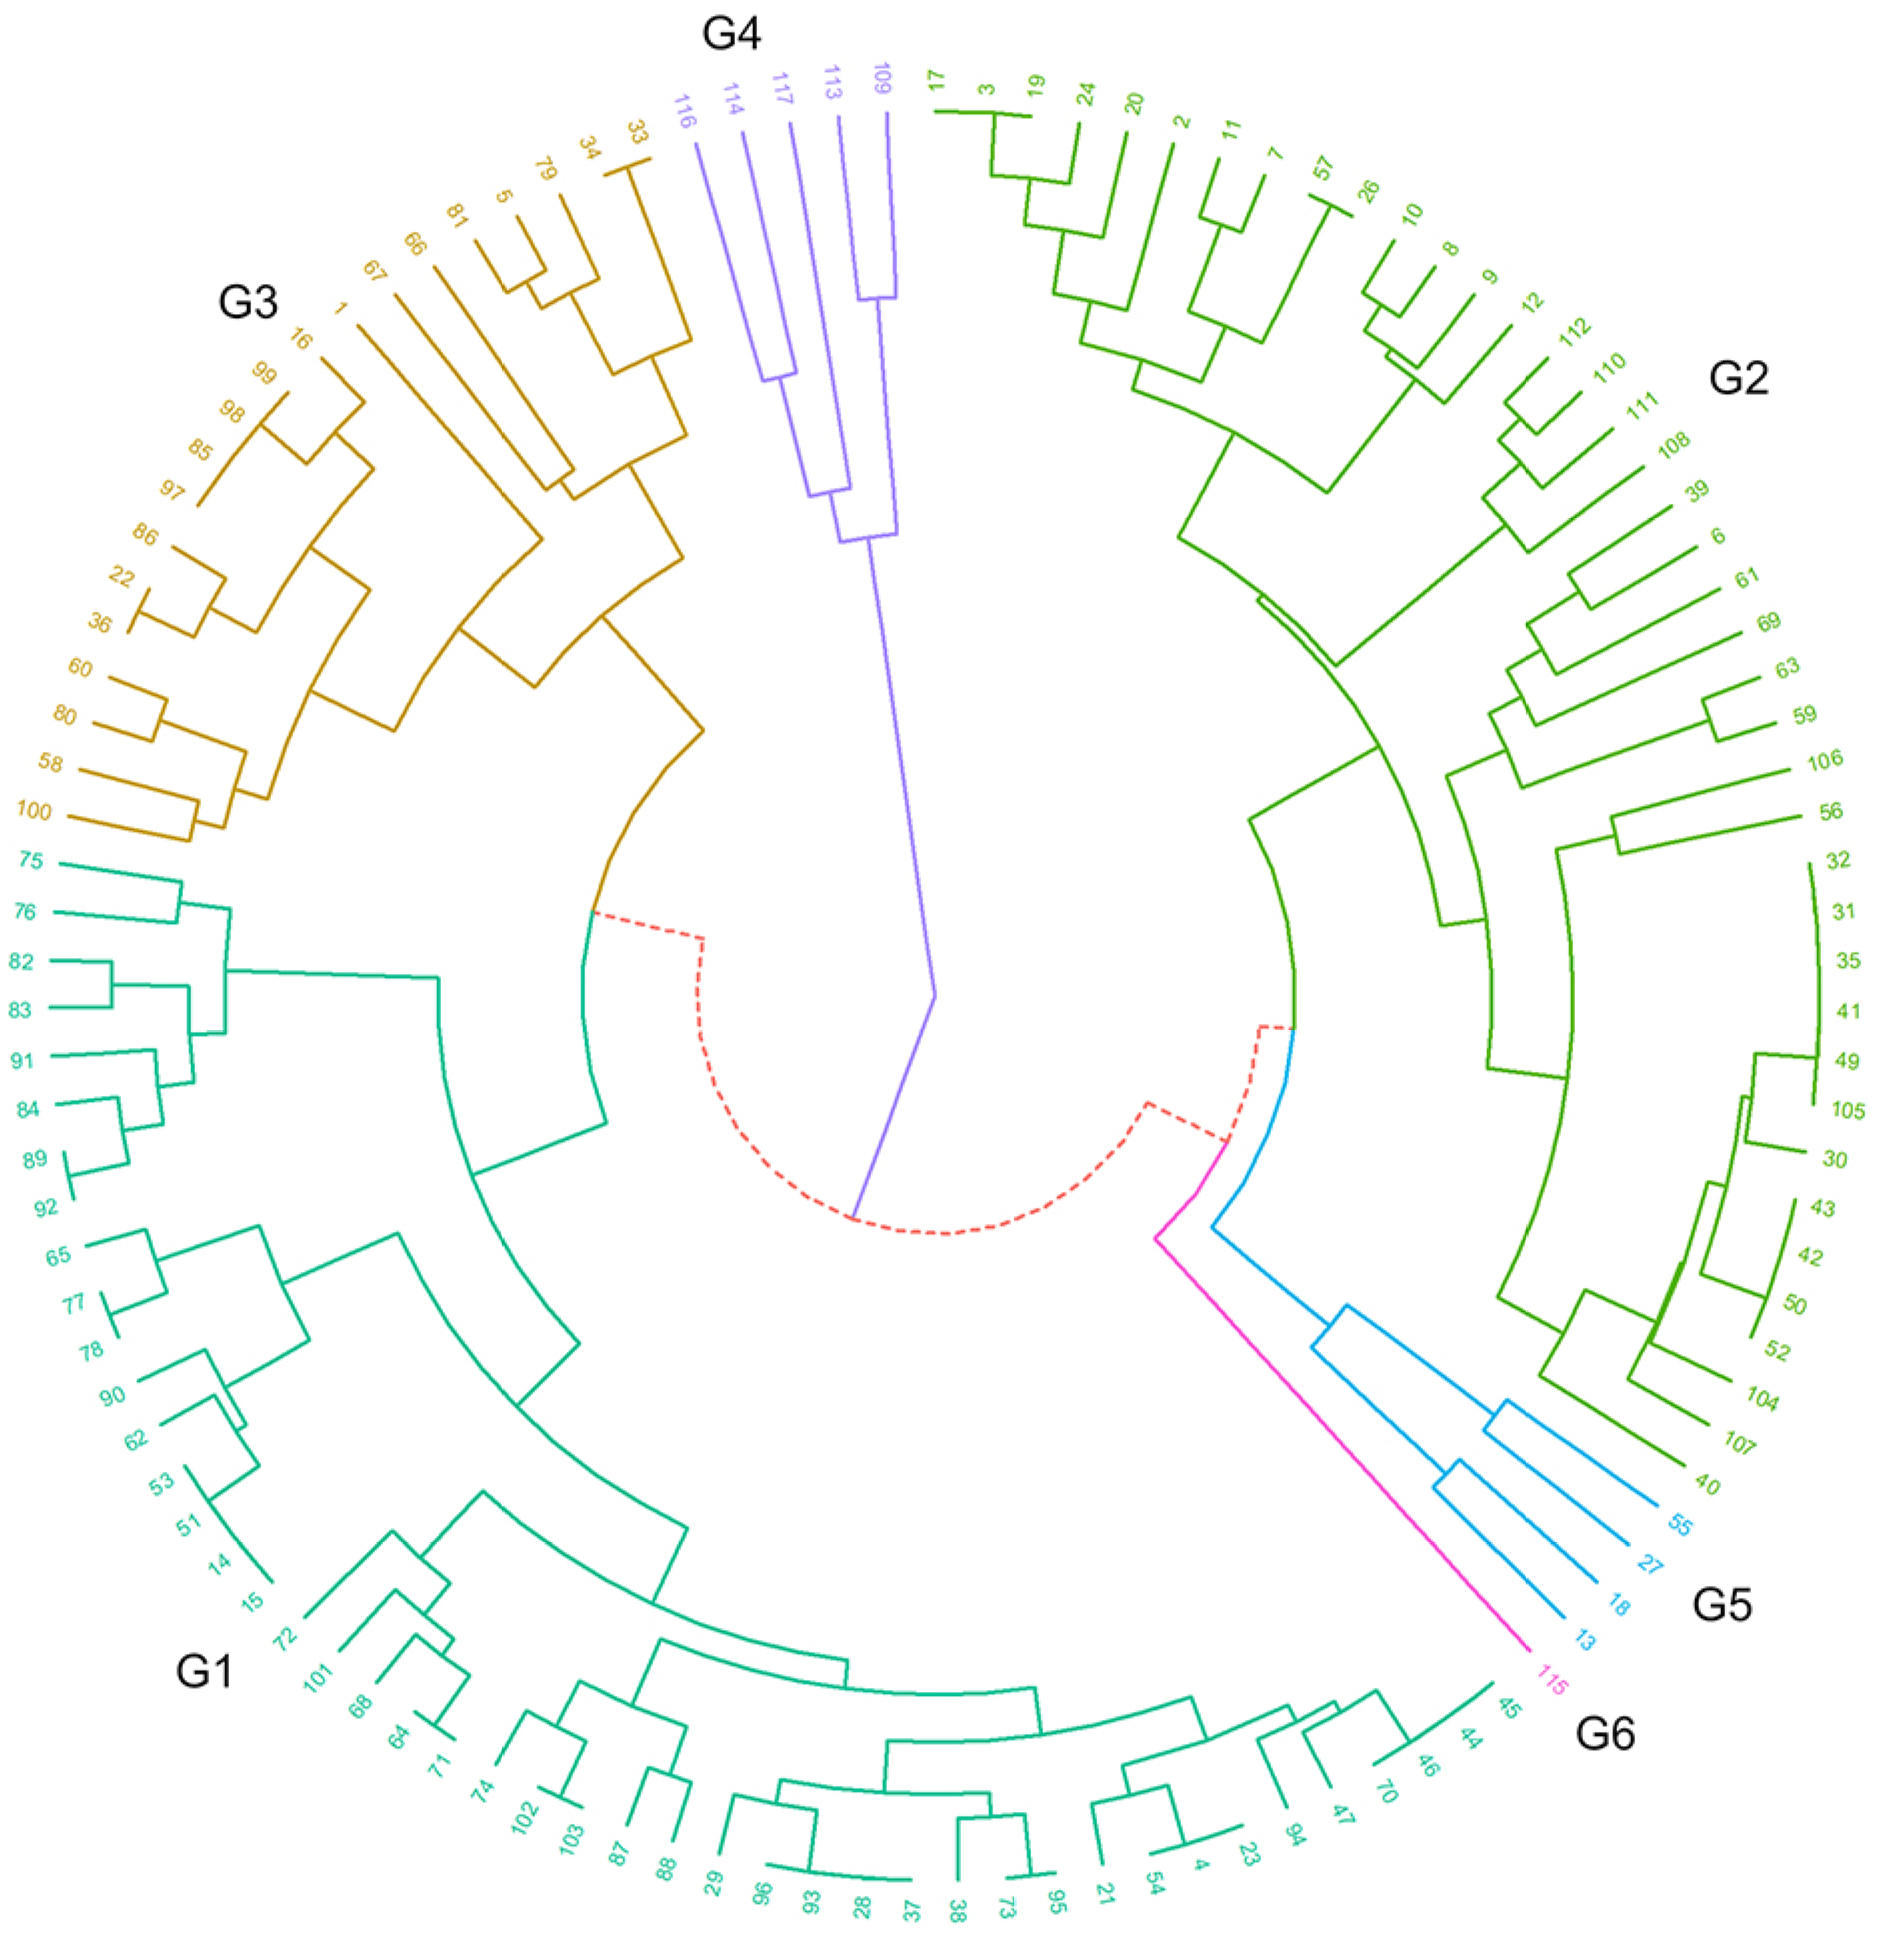
Genetic similarity analysis using the UPGMA method, based on Roger's Genetic Distance, grouped the 115 individuals into six distinct clusters (Figure 4). The groups highlighted in bright green (G2), green (G1), and yellow (G3) were particularly relevant because they included individuals from various geographic regions who exhibited high genetic similarity. The composition of these groups reveals that Group 2, which included the largest number of individuals (45), displayed high genetic similarity despite its wide geographic distribution, suggesting a common origin for the genotypes in this cluster. The genotypes belonged to the populations from Aracaju (51, 53, 54), Frei Paulo (62, 64, 65, 68, 70, 71, 72, 73, 74, 75, and 76), Lagoa Seca (21 and 23), Nossa Senhora das Dores (28, 29, 37, 38, 77, 78, 82, 83, 84, 87, 88, 89, 90, 91, 92, 95, 96, 101, 102 and 103), Nossa Senhora da Glória (4), Petrolina (14 and 15) and Seropédica (44, 45,46, and 47).
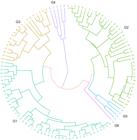
Dendrogram created using the unweighted pair group method with arithmetic mean (UPGMA) method based on Rogers’ genetic distance matrix of the 115 individuals from the gliricidia germplasm bank of Empresa Brasileira de Pesquisa Agropecuária - Tabuleiros Costeiros. G = gliricidia germplasm bank accessions; G1 = individuals 75, 76, 82, 83, 91, 84, 89, 92, 65, 77, 76, 90, 62, 53, 51, 14, 15, 72, 101, 68, 64, 71, 74, 102, 103, 87, 88, 29, 96, 93, 28, 37, 38, 73, 95, 21, 54, 4, 23, 94, 47, 70, 46, and 44; G2 = individuals 17, 3, 19, 34, 20, 2, 11, 7, 57, 26, 10, 8, 9, 12, 112, 110, 111, 108, 39, 6, 61, 69, 63, 59, 106, 56, 32, 31, 35, 41, 49, 105, 30, 43, 42, 50, 104, 107, and 40; G3 = individuals 33, 34, 79, 5, 81, 66, 67, 1, 16, 99, 98, 85, 97, 86, 22, 36, 60, 80, 58, and 100; G4 = individuals 109, 113, 117, 114, and 116; G5 = individuals 55, 27, 18, and 3; G6 = individual 115.
Group 1, with 40 individuals, also represented various regions, including Aracaju (52 and 56), Itaporanga (107, 108, 110, 111, and 112), Frei Paulo (57, 59, 61, 63, and 69), Lagoa Seca (20 and 24), Nossa Senhora das Dores (26, 30, 31, 32, 35, 39, 40, 41, 104, 105, and 106), Nossa Senhora da Glória (2, 3, 6, 7, 8, 9, 10, 11, and 12), Porto Velho (49 and 50), Seropédica (42 and 43) and Umbaúba (17 and 19). While Group 3 included 20 individuals, covering accessions from Frei Paulo (58, 60, 66, and 67), Lagoa Seca (22), Nossa Senhora das Dores (33, 34, 36, 79, 80, 81, 85, 86, 97, 98, 99 and 100), Nossa Senhora da Glória (1 and 5) and Petrolina (16). The smaller groups, purple (G4), blue (G5), and pink (G6), presented 5, 4, and 1 genotypes, respectively. Group 4 included individuals 109, 113, 114, 116, and 117, all from Itaporanga. Group 5 was composed of individuals 13 (Petrolina), 18 (Umbaúba), 27 (Nossa Senhora das Dores), and 55 (Aracaju). Group 6 was composed of only one individual, 115 from Itaporanga and was the most genetically distant. The dendrogram also showed that certain individuals from different regions or accessions were highly genetically similar, possibly due to agricultural management practices that favor the dissemination of specific genotypes. Examples of this genetic similarity were observed between individuals and regions (Table 7).
Composition and origin of the groups formed from the unweighted pair group method with arithmetic mean analysis.
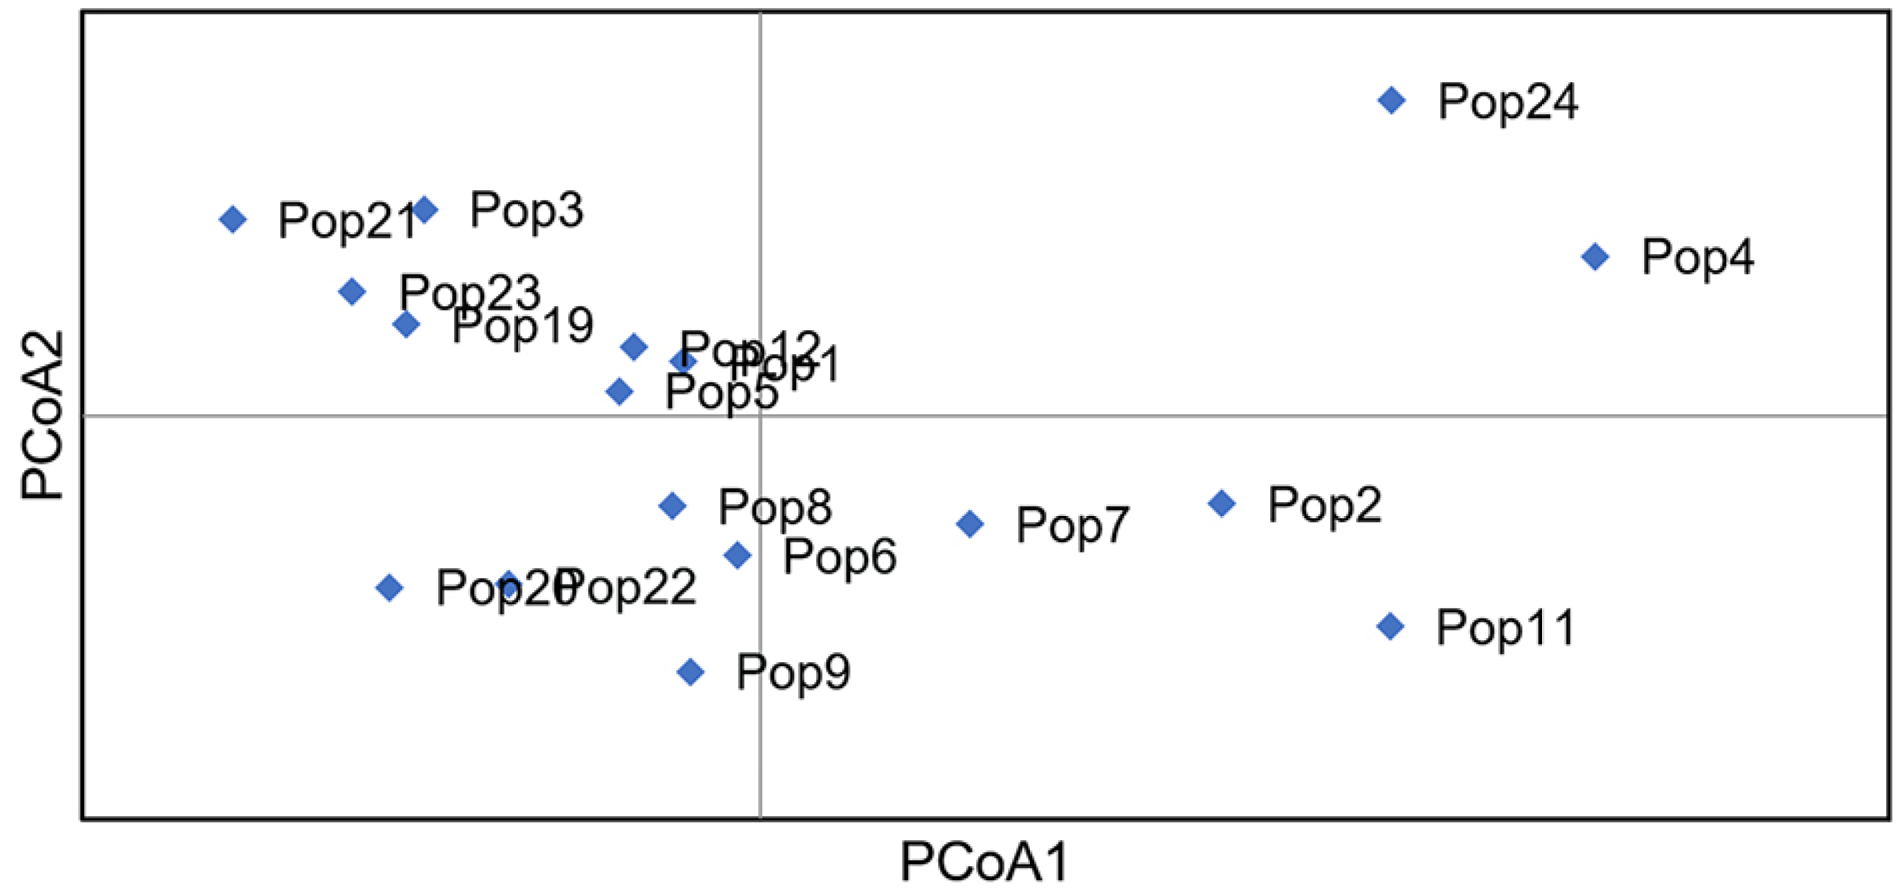
Principal coordinates analysis accounted for 63.04 % of the total variation and was used to further assess the distribution of genetic variability. The first principal component analysis (PCoA1) explained 42.82 % of the total variation, while the second principal component analysis (PCoA2) accounted for 20.22 %. These results indicate that genotypes collected from different states exhibit a high degree of genetic similarity, making it difficult to differentiate them by geographic origin (Figure 5).
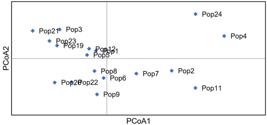
Principal coordinates analysis (PCoA) of 17 gliricidia populations (Pop) from the Sergipe, Bahia, Paraíba, Pernambuco, Rio de Janeiro, and Roraima states. PCoA1 = first principal component analysis; PCoA2 = second principal component analysis.
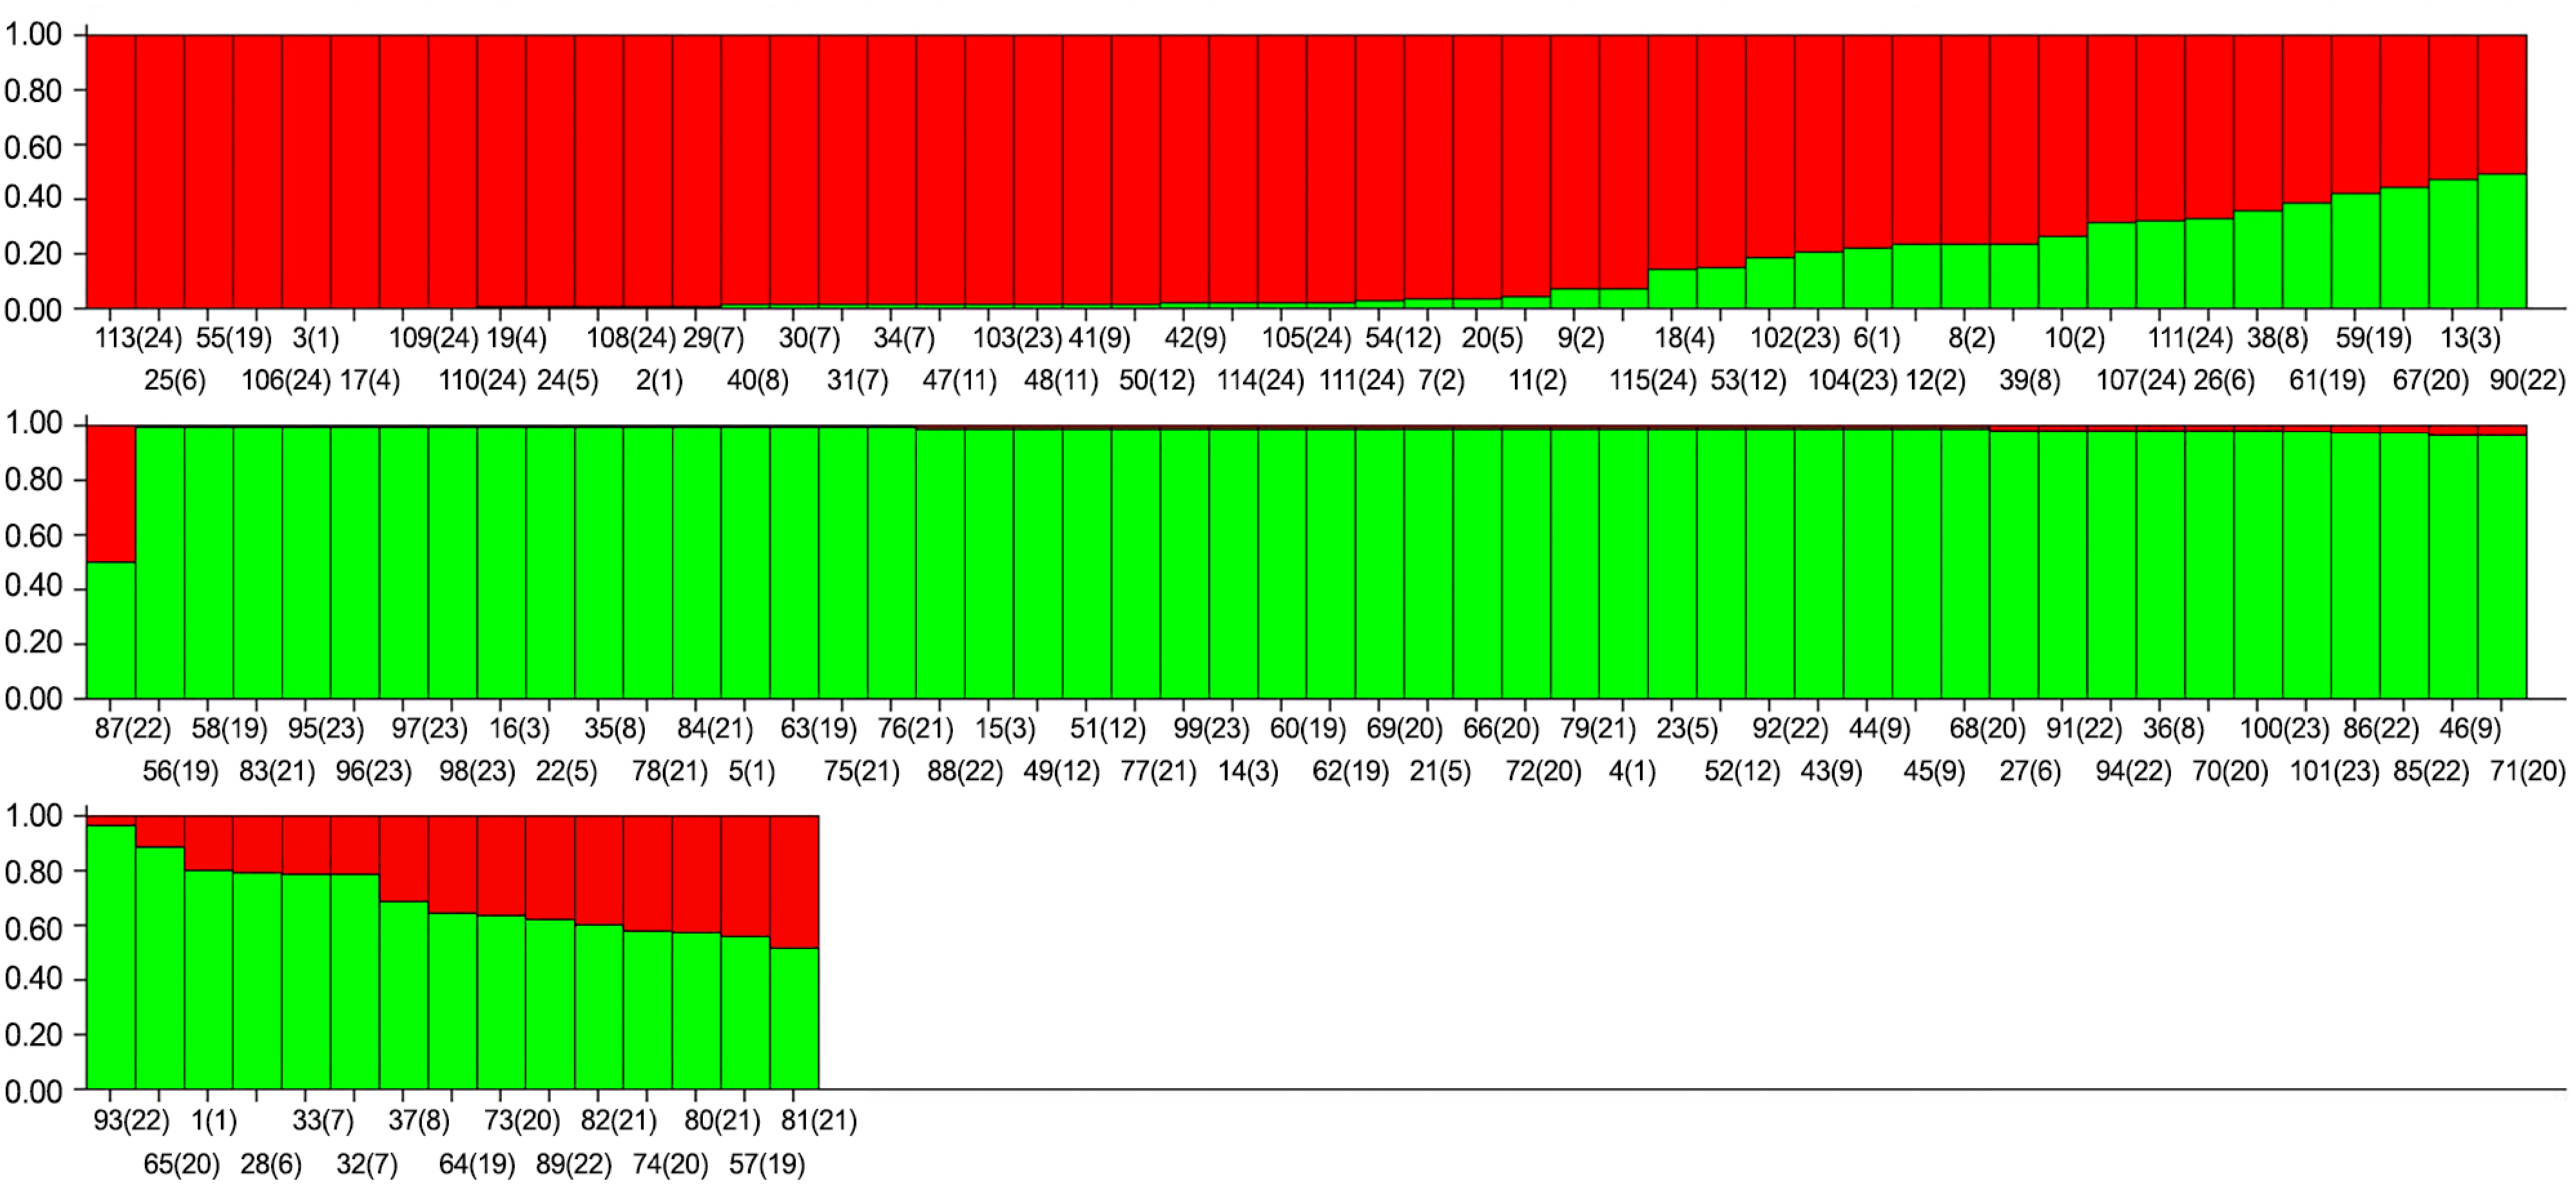
The Bayesian analysis conducted using the Structure software package v.2.3.4. revealed that the accessions were categorized into two distinct groups (K = 2) (Figure 6). The first group, identified by the color red, consists of individuals from the regions of Aracaju (52, 55, and 56), Itaporanga (108, 110, 111, 112, 114, and 115), Lagoa Seca (20 and 24), Nossa Senhora das Dores (26, 30, 31, 32, 35, 41, 104, and 105), Nossa Senhora da Glória (2, 3, 7, 9, and 11), Porto Velho (49 and 50), Seropédica (42 and 47) and Umbaúba (17, 18, and 19), with all from Porto Velho and Umbaúba grouped exclusively within this cluster. Contrarily, Group 2, represented by the color green, included individuals from the regions of Aracaju (51, 53, and 54), Frei Paulo (58, 60, 62, 64, 65, 67, 68, 70, 71, 72, 73, and 74), Lagoa Seca (21, 22, and 23), Itaporanga (107), Nossa Senhora das Dores (28, 36, 37, 77, 78, 79, 80, 81, 85, 86, 87, 88, 90, 93, 94, 95, 96, 97, 98, 99, 100, and 101), Nossa Senhora da Glória (1, 4, and 5), Petrolina (14, 15, and 16) and Seropédica (43, 44, 45, and 46).
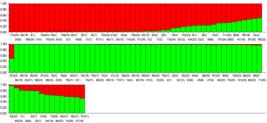
Representation of 17 populations with a total of 115 individuals from the molecular analysis of the gliricidia germplasm bank from Empresa Brasileira de Pesquisa Agropecuária - Tabuleiros Costeiros, divided into two groups (K = 2) using the Structure software with the use of nine inter simple sequence repeat markers. Red = group 1; Green = group 2.
Further analysis indicated that 28 individuals had mixed ancestry, with values below 80 % belonging to a single group. These were derived from various regions, including genotypes from Nossa Senhora da Glória (6, 8, 10, and 12), Petrolina (13), Nossa Senhora das Dores (27, 29, 33, 34, 38, 39, 40, 82, 83, 84, 89, 91, 92, and 106), Frei Paulo (59, 61, 63, 66, 69, 75, and 76) and Itaporanga (109 and 113).
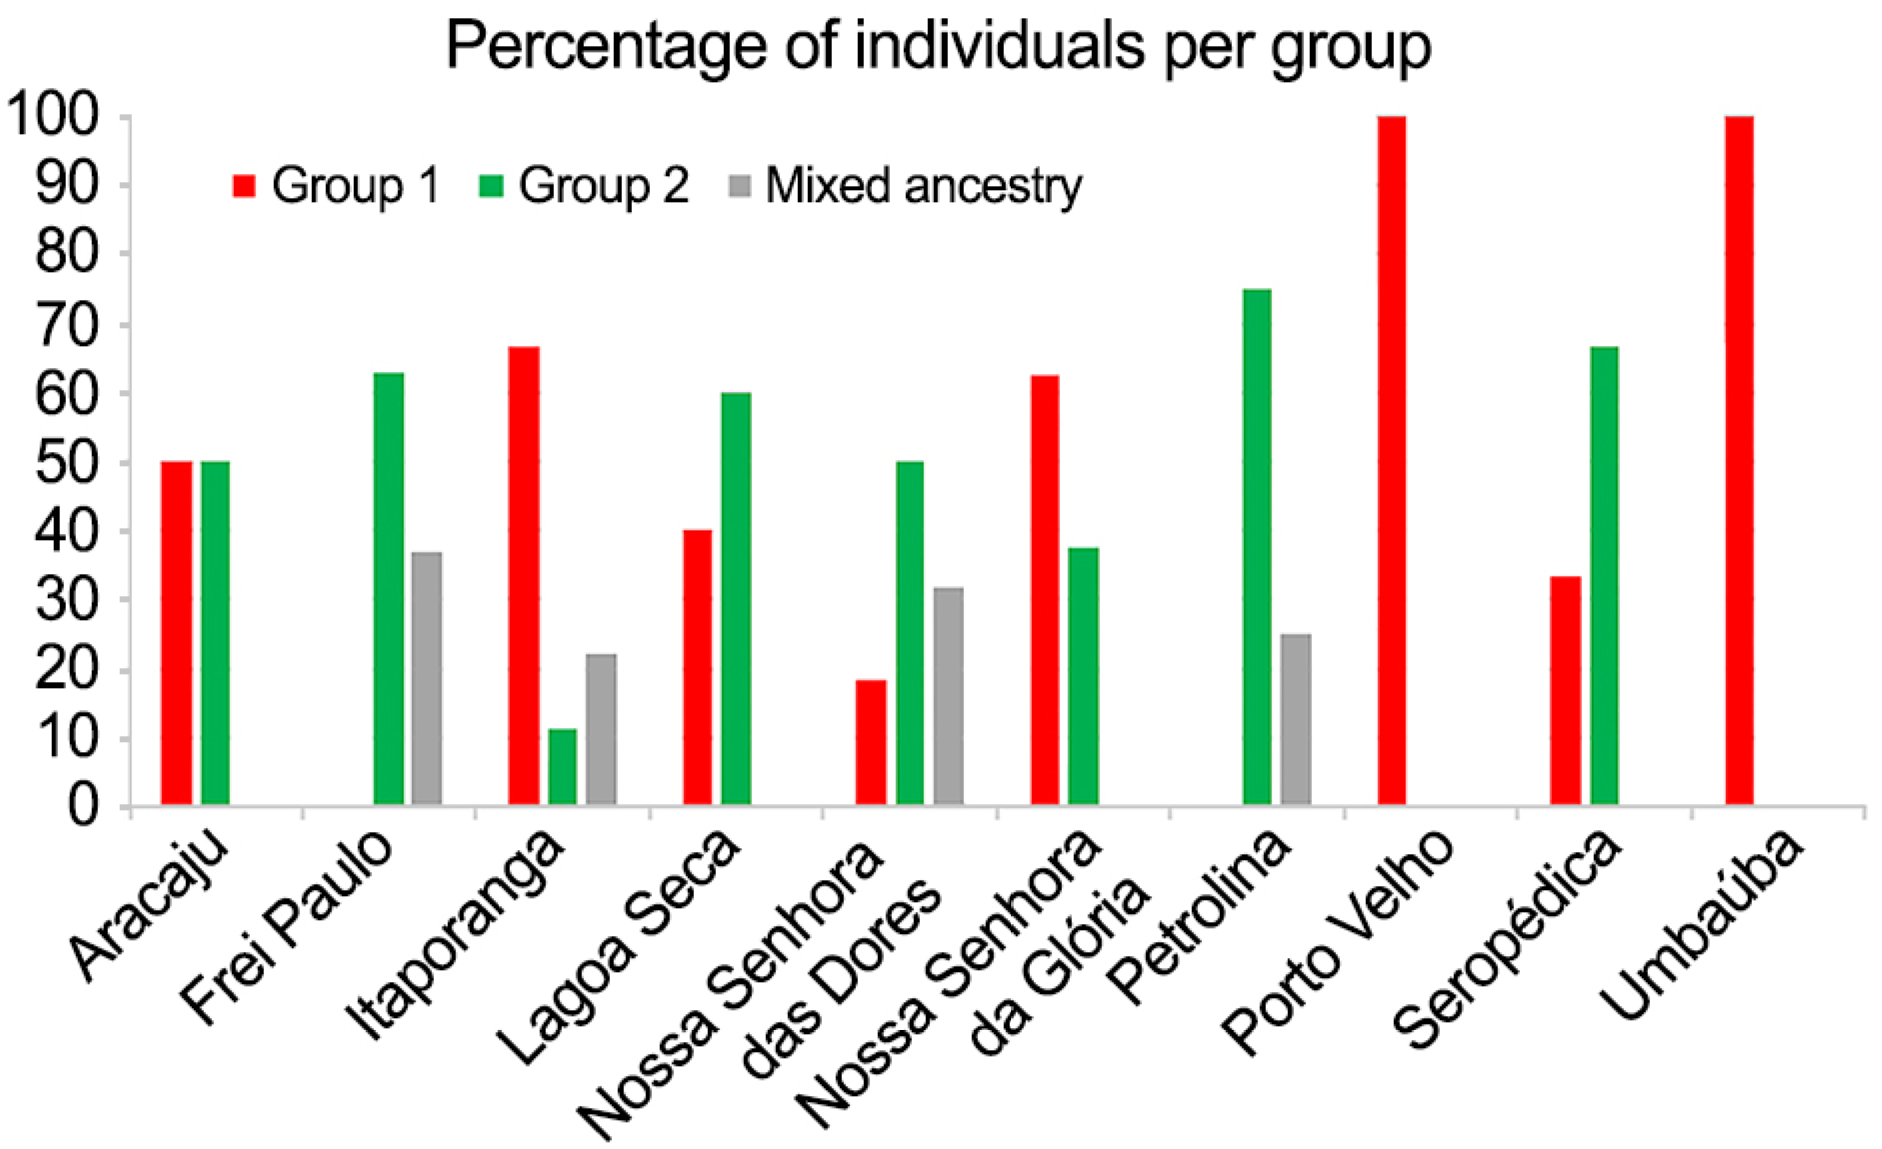
It was observed that certain genotypes from the same region were distributed across different groups, while others clustered together. Individuals from Aracaju were evenly divided between Group 1 (50 %) and Group 2 (50 %) (Figure 7). In contrast, a majority of individuals from Frei Paulo were assigned to Group 2 (63 %), while the remaining 37 % exhibited mixed ancestry. The distribution across different groups within the same municipality demonstrates that genetic diversity can exist even within a single geographic area.
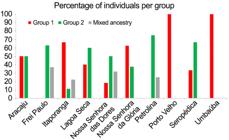
Percentage of 115 individuals from the gliricidia germplasm bank from Empresa Brasileira de Pesquisa Agropecuária - Tabuleiros Costeiros by groups from the Structure software analysis.
The individuals from Itaporanga were distributed across all groups: Group 1 (66.67 %), Group 2 (11.1 %), and the mixed ancestry Group (22.2 %). In the samples from Nossa Senhora das Dores, the distribution was also among the three groups, with Group 1 comprising 18.18 %, Group 2 comprising 50 %, and the mixed ancestry Group comprising 31.81 % of accessions. This distribution indicates that both municipalities have individuals across these groups, including a mixed-ancestry cluster, suggesting a greater genetic diversity within these locations. Variation among groups highlights genetic diversity among individuals, which may result from differences in the origins of the propagation materials.
The individuals from Lagoa Seca were divided into two groups: Group 1 (40 %) and Group 2 (60 %). Most of the individuals from Nossa Senhora da Glória were included in Group 1 (62.5 %), while the remaining individuals were in Group 2 (37.5 %). In Petrolina, the distribution skewed towards Group 2, with 75 % of individuals in this group and 25 % in the mixed ancestry group. At Seropédica, 33.3 % of individuals were in Group 1, while 66.7 % were in Group 2.
In Petrolina and Seropédica, there was a noticeable predominance of individuals belonging to Group 2. This suggests that the genetic populations in these municipalities may be more similar to the genotypes of Group 2, likely due to the sources of genetic material utilized in those regions. In contrast, all individuals from Porto Velho and Umbaúba were classified exclusively as Group 1.
The distribution of individuals across the different groups in municipalities such as Itaporanga, Lagoa Seca, Nossa Senhora das Dores, and Seropédica supports the notion that there is considerable genetic diversity even within localized regions. These results emphasize that agricultural practices, such as using cuttings for propagation, may contribute to the production of genetically similar materials across different regions. A number of locations exhibit higher genetic homogeneity, particularly those with limited genetic sources or isolated populations. The similar patterns observed in both the dendrogram and PCoA further support these conclusions.
Discussion
Analyzing genetic diversity is essential to both genetic improvement and species conservation programs, as it allows us to understand patterns of genetic variability and identify valuable genetic resources, which are important to the sustainability and effective management of populations (Salgotra and Chauhan, 2023). The genetic diversity of a species is influenced by several factors, including the geographic origin of genotypes, dispersal patterns, life cycles, breeding systems, and genetic composition (Castañeda-Cardona et al., 2020). Understanding how these factors are important to species adaptation can be further explored in genetic improvement programs.
This study is the first to use ISSR markers to investigate the genetic diversity of G. sepium in Brazil. Previous research in other countries has used random amplified polymorphic DNA (RAPD) and restriction fragment length polymorphism (RFLP-PCR) markers to assess the genetic diversity of species within the genus Gliricidia. Based at the Scottish Crop Research Institute and the Oxford Forestry Institute in England, RAPD markers were used to investigate the distribution and genetic diversity of G. sepium populations originating from Costa Rica, Guatemala, Mexico, Nicaragua, Panama, Thailand, and Venezuela, as well as Gliricidia maculata (Kunth) Walp. from Mexico (Chalmers et al., 1992). The results revealed a high level of genetic diversity among these populations, primarily due to the species’ breeding system. Additionally, the results indicated that G. maculata is a distinct taxon separate from G. sepium.
In Guatemala, a population of G. sepium was studied using RAPD and mitochondrial markers (Dawson et al., 1995). It was observed that 17 % of the genetic variation was distributed among subpopulations, and this distribution correlated with geographic distance. This observation suggested limited seed dispersal and greater genetic subdivision among subpopulations. In a subsequent study, hybridization between G. sepium and G. maculata in Mesoamerica was investigated using RAPD and RFLP-PCR markers (Dawson et al., 1996). This study revealed hybridization patterns and important genetic differences, further supporting the hypothesis that G. sepium has a complex genetic structure and significant variation within its populations, especially in areas of geographic juxtaposition with G. maculata.
The present study investigates the genetic diversity of G. sepium using nine ISSR markers. ISSR markers are widely recognized as an effective tool for characterizing plant genetic variability, particularly in studies of genetic diversity and population structure (Pimenta et al., 2022; Gelotar et al., 2019). Amongst these nine markers, 36 DNA fragments were identified, of which 88.9 % were polymorphic. This high level of polymorphism indicates that the methodology is sensitive and suitable for evaluating the species’ genetic diversity. ISSR primers were used to assess the genetic diversity of Desmanthus pernambucanus (L.), another forage legume species used in animal feed (Silva et al., 2015). The results showed 38 DNA fragments with 71.05 % polymorphism rate. Similar to G. sepium, D. pernambucanus is valued for its ability to efficiently fix biological nitrogen, an important characteristic for the recovery of degraded soils and enhancing of forage production (Freitas et al., 2011).
The results of the present study indicated low genetic diversity in G. sepium, reflected in the Nei genetic diversity indices, which had an average value of 0.213, and in the I, with an average of 0.194. The expected He, representing the probability of finding different alleles at a genetic locus within the population, was 0.132, corroborating the low genetic diversity among the studied genotypes (Al-Yassiry, 2024). In a previous study, similar patterns of low genetic diversity in Moringa oleifera Lam. were observed, using the same ISSR primers (Soares et al., 2024). For M. oleifera, the average value of I was 0.16, and the He ranged from 0.03 to 0.15. These results can be attributed to the restricted origin of the genetic material introduced into Brazil. M. oleifera, like gliricidia, is a species of great interest as animal feed (Leone et al., 2015) and was introduced in the Brazilian northeast in the 1950s. Since then, it has been widely distributed throughout the country as an ornamental tree (Rivas et al., 2013). The restricted genetic origin of the plants introduced may help explain the low genetic diversity observed in both species across Brazil.
Similar genetic diversity results were reported by Felix et al. (2020) in Pityrocarpa moniliformis (Benth.) Luckow & R.W. Jobson), a tree native to northeastern Brazil. Like gliricidia, P. moniliformis is used as animal forage, for the recovery of degraded areas, and firewood (Azerêdo et al., 2011). For P. moniliformis, the study reported mean values of 0.138 and 0.21 for Nei and Shannon genetic diversity indices, respectively. This study also used ISSR primers, and the low levels of genetic diversity were attributed to limited reproduction and fragmented population structure in the natural forest fragments where the species occurred.
However, another native species, Hymenaea stigonocarpa Mart. ex Hayne, from the same family as G. sepium, showed high levels of genetic diversity in accessions from the active germplasm bank of the Universidade Federal de Goiás, Goiânia, Goiás state, Brazil. A study that investigated 24 natural subpopulations of H. stigonocarpa in the Cerrado using ISSR markers found an average He of 0.554 (Gonçalves et al., 2019). The high genetic diversity observed in H. stigonocarpa was attributed to the diverse environment of the Cerrado and the continuous gene flow between populations, which contrasts with the restricted genetic base often observed in introduced species.
Our results indicate that most of G. sepium genetic diversity (73 %) is within accessions. This can be explained by the fact that the genotypes were obtained through vegetative propagation, via cuttings. In this process, cross-pollination does not occur, which generally limits genetic diversity. However, the variability observed within the accessions may result from the genetic origin of the propagation materials used. In populations of perennial species that reproduce by cross-pollination, the greatest diversity is expected within accessions (Hu et al., 2010). This characteristic may justify the low genetic diversity observed in the G. sepium genotypes analyzed, considering that G. sepium is a self-incompatible plant and produces fruit only through cross-pollination (Kill and Drumond, 2001).
Cluster analysis using UPGMA revealed six main groups of G. sepium individuals, indicating genetic similarity among them. However, individual 115 was an exception, as it formed a unique group on account of its genetic differences. Genetic structure studies performed on other species conserved in germplasm banks also identified restricted clustering patterns, as reported by Soares et al. (2024) for M. oleifera.
The analysis of the genetic structure of the gliricidia germplasm bank indicated that the optimal number of genetic groups (K value) was two, suggesting that the genotypes are divided into two main clusters. Group 1 includes individuals from several regions, such as Aracaju, Itaporanga, Lagoa Seca, Nossa Senhora das Dores, Nossa Senhora da Glória, Porto Velho, Seropédica, and Umbaúba. Group 2 consists of individuals from Aracaju, Frei Paulo, Itaporanga, Lagoa Seca, Nossa Senhora das Dores, Nossa Senhora da Glória, Petrolina, and Seropédica. Additionally, 28 individuals presented mixed ancestry, suggesting greater genetic diversity in populations from Itaporanga and Nossa Senhora das Dores, where individuals are distributed over the two groups. These results suggest that genetic diversity may be related to the origins of the planting material and reinforce the need for conservation strategies that account for population structure (Gibson et al., 2023).
The information obtained from the dendrogram can serve as an indicator of individuals with greater genetic diversity in the selection process for plant breeding strategies, especially to develop new cultivars with desirable characteristics, such as greater resistance to abiotic stress or nitrogen-fixation potential. Thus, this study contributes to understanding the genetic diversity of gliricidia and provides important information for conservation and future use in breeding programs.
Genetic analysis of 115 individuals identified two primary groups and a third group with mixed ancestry. This genetic distribution, along with the low diversity observed in both the Nei and Shannon indices, suggests that most genetic variability lies within populations rather than between them. The limited genetic diversity noted in this study was expected, largely due to the limited origins of the populations and the dispersal patterns of species in Brazil.
These results provide support for future breeding programs, particularly in addressing the demand for a registered gliricidia cultivar, which is considered the main barrier to the adoption of the species in the production sector. It is noteworthy that in 2018, the taxonomy of the species was confirmed with the herbarium of the Instituto do Meio Ambiente de Alagoas in the state of Alagoas, and an application for registration as a relevant "species for agricultural use" was issued from the Ministério da Agricultura e Pecuária (Reg 40658-2019). The enrichment and evaluation of the germplasm will remain ongoing activities. Consequently, expanding the number of populations and molecular markers will be an important tool for conservation strategies and for identifying individuals with desired genetic and phenotypic characteristics for selection and breeding programs.
Data availability statement
The data that support the findings of this study are available on request from the corresponding author.
Acknowledgments
This study was funded by the Coordenação de Aperfeiçoamento de Pessoal de Nível Superior (CAPES - Finance Code 001) and Conselho Nacional de Desenvolvimento Científico e Tecnológico (CNPq - 313273/2021-9). We also acknowledge the assistance of Silvio Gomes dos Santos, a Technician at Embrapa - Tabuleiros Costeiros, who helped with the laboratory analysis, and Marcela C. Muniz for English revision.
References
-
Al-Yassiry ZAN. 2024. Detection of genetic diversity of Vicia faba L using ISSR DNA markers. Journal of University of Babylon for Pure and Applied Sciences 32: 279-290. https://doi.org/10.29196/967gj564
» https://doi.org/10.29196/967gj564 -
Azerêdo GA, Paula RC, Valeri SV. 2011. Determining the viability of Piptadenia moniliformis Benth seeds with the tetrazolium test. Revista Brasileira de Sementes 33: 61-68 (in Portuguese, with abstract in English). https://doi.org/10.1590/S0101-31222011000100007
» https://doi.org/10.1590/S0101-31222011000100007 -
Castañeda-Cardona CC, Morillo-Coronado Y, Morillo AC. 2020. Assessing the genetic diversity of Dioscorea alata and related species from Colombia through inter-simple sequence repeat (ISSR) markers. Chilean Journal of Agricultural Research 80: 608-616. http://dx.doi.org/10.4067/S0718-58392020000400608
» http://dx.doi.org/10.4067/S0718-58392020000400608 -
Chalmers KJ, Waugh R, Sprent JI, Simons AJ, Powell W. 1992. Detection of genetic variation between and within populations of Gliricidia sepium and G. maculata using RAPD markers. Heredity 69: 465-472. http://dx.doi.org/10.1038/hdy.1992.151
» http://dx.doi.org/10.1038/hdy.1992.151 -
Dawson IK, Simons AJ, Waugh R, Powell W. 1995. Diversity and genetic differentiation among subpopulations of Gliricidia sepium revealed by PCR-based assays. Heredity 74: 10-18. http://dx.doi.org/10.1038/hdy.1995.2
» http://dx.doi.org/10.1038/hdy.1995.2 -
Dawson IK, Simons AJ, Waugh R, Powell W. 1996. Detection and pattern of interspecific hybridization between Gliricidia sepium and G. maculata in Meso-America revealed by PCR-based assays. Molecular Ecology 5: 89-98. http://dx.doi.org/10.1111/j.1365-294x.1996.tb00294.x
» http://dx.doi.org/10.1111/j.1365-294x.1996.tb00294.x - Doyle JJ, Doyle JL. 1990. Isolation of plant DNA from fresh tissue. Focus 12: 13-15.
-
Evanno G, Regnaut S, Goudet J. 2005. Detecting the number of clusters of individuals using the software structure: a simulation study. Molecular Ecology 14: 2611-2620. https://doi.org/10.1111/j.1365-294X.2005.02553.x
» https://doi.org/10.1111/j.1365-294X.2005.02553.x -
Felix FC, Chagas KPT, Ferrari CS, Vieira FA, Pacheco MV. 2020. Applications of ISSR markers in studies of genetic diversity of Pityrocarpa moniliformis Revista Caatinga, 33: 1017-1024. https://doi.org/10.1590/1983-21252020v33n417rc
» https://doi.org/10.1590/1983-21252020v33n417rc -
Freitas ADS, Silva TO, Menezes RSC, Sá Barreto Sampaio EV, Araújo ER, Silva Fraga V. 2011. Nodulation and nitrogen fixation of caatinga forage species grown in soils of the semiarid area of Paraiba. Revista Brasileira de Zootecnia 40: 1856-1861 (in Portuguese, with abstract in English). https://doi.org/10.1590/S1516-35982011000900003
» https://doi.org/10.1590/S1516-35982011000900003 -
Gelotar MJ, Dharajiya DT, Solanki SD, Prajapati NN, Tiwari KK. 2019. Genetic diversity analysis and molecular characterization of grain amaranth genotypes using inter simple sequence repeat (ISSR) markers. Bulletin of the National Research Centre 43:103. https://doi.org/10.1186/s42269-019-0146-2
» https://doi.org/10.1186/s42269-019-0146-2 -
Ghislain M, Zhang D, Fajardo D, Huamán Z, Hijmans RJ. 1999. Marker assisted sampling of the cultivated Andean potato Solanum phureja collections using RAPD markers. Genetic Resources and Crop Evolution 46: 547-555. https://doi.org/10.1023/A:1008724007888
» https://doi.org/10.1023/A:1008724007888 -
Gibson EL, Gonçalves EO, Silva Júnior AL, Santos AR, Araújo EF, Miranda FD, et al. 2023. Molecular characterization of Melanoxylon brauna (Fabaceae) matrices established in a multiclonal minigarden. Plant Gene 35: 100428. https://doi.org/10.1016/j.plgene.2023.100428
» https://doi.org/10.1016/j.plgene.2023.100428 -
Gonçalves AR, Chaves LJ, Campos Telles MP. 2019. Genetic variability and effective population size in Hymenaea stigonocarpa (Fabaceae) germplasm collection: tools for breeding programs and genetic conservation. Genetica 147: 359-368. https://doi.org/10.1007/s10709-019-00076-0
» https://doi.org/10.1007/s10709-019-00076-0 -
Hu Y, Wang L, Xie X, Yang J, Li Y, Zhang H. 2010. Genetic diversity of wild populations of Rheum tanguticum endemic to China as revealed by ISSR analysis. Biochemical Systematics and Ecology 38: 264-274. https://doi.org/10.1016/j.bse.2010.01.006
» https://doi.org/10.1016/j.bse.2010.01.006 -
Kaba JS, Zerbe S, Agnolucci M, Scandellari F, Abunyewa AA, Giovannetti M, et al. 2019. Atmospheric nitrogen fixation by gliricidia trees (Gliricidia sepium (Jacq.) Kunth ex Walp.) intercropped with cocoa (Theobroma cacao L.). Plant and Soil 435: 323-336. https://doi.org/10.1007/s11104-018-3897-x
» https://doi.org/10.1007/s11104-018-3897-x -
Kill LHP, Drumond MA. 2001. Floral biology and reproductive system of Gliricidia sepium (Jacq.) Steud. (Fabaceae-Papilionoidae) in region of Petrolina, Pernambuco state, Brazil. Ciência Rural 31: 597-601 (in Portuguese, with abstract in English). https://doi.org/10.1590/S0103-84782001000400006
» https://doi.org/10.1590/S0103-84782001000400006 -
Leone A, Spada A, Battezzati A, Schirald A, Aristil J, Bertoli S. 2015. Cultivation, genetic, ethnopharmacology, phytochemistry and pharmacology of Moringa oleifera leaves: an overview. International Journal of Molecular Science 16: 12791-12835. https://doi.org/10.3390/ijms160612791
» https://doi.org/10.3390/ijms160612791 -
Nei M. 1973. Analysis of gene diversity in subdivided populations. Proceedings of the National Academy of Sciences of the United States of America 70: 3321-3323. https://doi.org/10.1073/pnas.70.12.3321
» https://doi.org/10.1073/pnas.70.12.3321 -
Nogueira de Sá MK, Andrade AP, Magalhães ALR, Valença RL, Campos FS, Araújo FS, et al. 2021. Cactus pear silage with Gliricidia Sepium: food alternative for the semiarid region. Research, Society and Development 10: e27210212473. https://doi.org/10.33448/rsd-v10i2.12473
» https://doi.org/10.33448/rsd-v10i2.12473 -
Pérez-Almario N, Mora-Delgado J, Criollo-Cruz D, Carvajal-Bazurto CT, Moreno-Turriago JM, Orjuela-Franco OE. 2023. Relative palatability of woody forage species from the tropical dry forest using a cafeteria method. Tropical Grasslands-Forrajes Tropicales 11: 145-159 (in Spanish, with abstract in English). https://doi.org/10.17138/tgft(11)145-159
» https://doi.org/10.17138/tgft(11)145-159 -
Pimenta JMA, Felix FC, Araújo JSO, Fajardo CG, Pacheco MV. 2022. Selection of ISSR molecular primers for studies of genetic diversity in Handroanthus impetiginosus (MART. EX DC.) Mattos. Revista Caatinga 35: 231-238. http://dx.doi.org/10.1590/1983-21252022v35n124rc
» http://dx.doi.org/10.1590/1983-21252022v35n124rc -
Pritchard JK, Stephens M, Donnelly P. 2000. Inference of population structure using multilocus genotype data. Genetics 155: 945-959. https://doi.org/10.1093/genetics/155.2.945
» https://doi.org/10.1093/genetics/155.2.945 -
Rivas R, Oliveira MT, Santos MG. 2013. Three cycles of water deficit from seed to young plants of Moringa oleifera woody species improves stress tolerance. Plant Physiology and Biochemistry 63: 200-208. https://doi.org/10.1016/j.plaphy.2012.11.026
» https://doi.org/10.1016/j.plaphy.2012.11.026 - Rogers JS. 1972. Measures of genetic similarity and genetic distance. p. 145-153. In: Wheeler MR. ed. Studies in Genetics VII. University of Texas, Texas, TX, USA.
-
Salgotra RK, Chauhan BS. 2023. Genetic diversity, conservation, and utilization of plant genetic resources. Genes 14: 174. https://doi.org/10.3390/genes14010174
» https://doi.org/10.3390/genes14010174 - Santana Neto JA, Oliveira VS, Valença RL. 2015. Adapted legumes as a dietary alternative to sheep in the semi-arid – a review. Revista de Ciências Agroveterinárias 14: 191-200 (in Portuguese, with abstract in English).
- Silva AVC, Muniz EM, Almeida CS, Vitória MF, Ledo AS, Melo MFV, et al. 2015. Genetic diversity and sex identification in Genipa americana L. Tropical and Subtropical Agroecosystems 18: 81-86.
-
Soares TFSN, Gois IB, Souza JL, Muniz EM, Ledo AS, Silva AVC. 2024. Moringa oleifera Genebank in Brazil: current status and future approaches. Scientia Agricola 81: e20230233. https://doi.org/10.1590/1678-992X-2023-0233
» https://doi.org/10.1590/1678-992X-2023-0233 -
Xie WG, Zhang XQ, Cai HW, Liu W, Peng Y. 2010. Genetic diversity analysis and transferability of cereal EST-SSR markers to orchardgrass (Dactylis glomerata L.). Biochemical Systematics and Ecology 38: 740-749. https://doi.org/10.1016/j.bse.2010.06.009
» https://doi.org/10.1016/j.bse.2010.06.009 -
Yildirim B, Acar P, Genc H, Mavi-Idman DO. 2024. Molecular characterizations and taxonomic contributions in some taxa from Lathyrus sect. Platystylis (Fabaceae). South African Journal of Botany 167: 385-390. https://doi.org/10.1016/j.sajb.2024.02.021
» https://doi.org/10.1016/j.sajb.2024.02.021
Edited by
-
Edited by:
Evandro Vagner Tambarussi https://orcid.org/0000-0001-9478-5379