 Multi-trait selection and the relationship between sensory analysis and post-harvest variables in Coffea arabica
ABSTRACT
We aimed to estimate genetic parameters and multivariate selection in coffee related to quality and postharvest practices. In a population of 59 progeny of Coffea arabica, we analyzed the most important traits related to quality. Our analysis reveals significant genetic variance in all traits. We examined the effectiveness of direct selection and multivariate genetic gain using factor analysis. Our results suggest that genetic gains are achievable by all traits, although to varying degrees. In particular, selection based on the sensory quality factor alone can lead to gains opposite to those desired for traits such as ripening uniformity, bean size, and yield. This result may be due mainly to the way postharvest variables are processed for the standard Specialty Coffee Association of America (SCAA) beverage quality tests. Therefore, under this scenario, selection using factor analysis must be applied with care. These results provide a basis for future genetic selection strategies that will improve the quality of coffee.
Keywords:
genetic improvement; beverage quality; factor analysis; correlation network
Introduction
Coffee (Coffea arabica L.), one of the world's most widely consumed beverages, owes its popularity to its unique sensory properties. The quality of coffee is influenced by a complex interplay of genetic and environmental factors, as well as post-harvest practices. The growing specialty coffee market has driven the global coffee sector to enhance its agricultural practices to improve sensory quality.
There is a strong focus on selecting coffee genotypes based on beverage quality, which is influenced by numerous variables (Montagnon et al., 1998). Productivity, bean size, and weight have a direct impact on profitability and are highly valued by producers. Additionally, the uniformity of fruit maturation affects both the sensory quality and the efficiency of post-harvest processes. Therefore, traits related to productivity, ripening uniformity, bean size, and the ratio of processed coffee should be considered when selecting superior genotypes (Montagnon et al., 1998; Dessalegn et al., 2008; Kathurima et al., 2009; Reyes González et al., 2016; Sobreira et al., 2016; González et al., 2019).
Understanding the genetic basis of these traits can aid in breeding superior varieties. Evaluating the correlation between different traits and testing selection strategies is crucial to improving quality and accelerating the development of new cultivars (Ferreira et al., 2005; Paixão et al., 2022). The use of factor analysis in multivariate selection can optimize this process by summarizing many traits into a few latent variables or factors, thereby preserving essential information (Granate et al., 2001; Cruz et al., 2012; Barbosa et al., 2019). Factor analysis enables the structuring and simplification of a set of original data, allowing for the representation of a relatively large number of traits as latent variables or factors, thereby preserving as much information as possible (Cruz et al., 2012). As a result, multivariate selection can be more efficient when applied to a few factors that represent several strongly correlated original traits (Granate et al., 2001; Barbosa et al., 2019). Obtaining interpretable factors demonstrates that correlated variables of interest can be summarized through common factors (Ferreira et al., 2005).
In this context, this study applies factor analysis to identify key factors influencing post-harvest and beverage quality traits in C. arabica genotypes. By analyzing multiple traits simultaneously, we aim to improve the efficiency of genotype selection and predict genetic gains, thereby contributing to the development of superior coffee varieties with enhanced sensory characteristics and post-harvest qualities.
Materials and Methods
Genetic material and phenotypic data
Fifty-nine progenies of C. arabica cultivated at Rio Paranaíba, Minas Gerais state (19°12’59" S, 46°13’57" W, altitude 1124 m) were evaluated in the 2020 harvest season (Table 1). The experiment was conducted in a randomized complete block design with three replications. Each plot comprised ten plants, and the four central plants were evaluated in bulk. A total of 22 variables were evaluated during the harvest and post-harvest process.
Identification, description and genealogy of Coffea arabica genotypes at Rio Paranaíba, Minas Gerais state, 2020 harvest season.
Before harvesting, the °Brix (BRI) was determined by direct reading on a refractometer at 20 °C, using four randomly selected cherry fruits from each plot. All the fruits from the selected plants were harvested, and the yield (YLD) was estimated in liters per plot (L plot–1). After that, a 20-liter sample was taken for the post-harvesting processes. Variables related to fruit ripening were assessed. These included the percentage of ripe fruit (RIF), unripe fruit (UNR), semi-ripe fruit (SEM), and overripe fruit (OVF) in a representative volume of 1 L per plot. The percentage of floating fruits (FLO) in the 20 L sample was determined by the water immersion method in which the buoyant fruits with lower density were collected and their volume measured. Next, a subsample of 5 L of cherry fruits was separated from the total 20 L sample and dried on raised beds until reaching a moisture content of 11.5 %. We used this specific subsample for subsequent processing.
After drying, the coffee was hulled, and the following measurements were taken: estimated volume of cherry coffee per 60 kg bag (L bag–1) (LBG), weight of 100 beans (WEI), percentage of defect (DEF) beans, and variables related to bean size: percentage of beans retained on the bottom sieve (B15), sieve 15 (S15), sieve 17 (S17), and sieve 17 together with sieve 19 (T19).
A 300 g sample of coffee from sieves 15 and above was prepared for sensory evaluation based on the protocol of the Specialty Coffee Association (SCAA, 2015). Three Q-Graders, in a blind analysis, assessed the sensory attributes of the beverage: final score (FIN), fragrance/aroma (ARO), flavor (FLA), acidity (ACI), body (BOD), overall (OVE), balance (BAL), and aftertaste (AFT). The scale for the final score ranged from zero to 100, while for the other attributes, it ranged from six to ten. The scores for sweetness, uniformity, and clean cup received the same maximum score and were excluded from the data analysis.
Statistical analysis
Phenotypic data were subjected to univariate analysis of variance (ANOVA) to test the significance of genotypic variance and estimation of genetic parameters. Phenotypic (), genetic (), and environmental variance () components were estimated via the Method of Moments, based on the mean performance of progenies.
Other genetic parameters were obtained from:
-
;
-
;
-
;
-
;
and ratio.
After estimating the phenotypic means, we applied Factor Analysis (FA) to investigate the relationship between variables and identify latent variables associated with quality coffee. The FA model was used according to Eq. (1):
where Xj is the j-th variable, with j = 1, 2, … v, Ijk, the factor loading for the j-th variable, associated with the k-th factor, and where k = 1, 2, … m; Fk is the k-th common factor and εj the specific factor associated to the j-th variable.
The number of factors retained in the model was defined by analyzing the highest eigenvalues and the percentage of accumulated variance. The final factor loadings were established through varimax rotation and used to interpret the factor meanings related to coffee quality complexes. In connection with this, we examined the relationship between phenotypic mean variables using the Pearson coefficient, visualized through network correlation plots (Rosado et al., 2017; Rosado et al., 2019). We used a cut-off value where only lines with |rij| ≥ 0.5 were highlighted proportional to the correlation intensity (Epskamp et al., 2012).
After identifying new latent variables (factors), we estimated factorial scores for all genotypes to simulate multivariate selection. Previously, we had calculated the direct gain for each variable using 15 % selection intensity. We decided to increase the factor scores for the variables RIF, YLD, LBG, BRI, S17, T19, FIN, ARO, FLA, ACI, BOD, OVE, BAL, and AFT, and to decrease them for the characteristics UNR, SEM, OVF, FLO, DEF, B15 and S15. In factorial multivariate selection, we used the factor score values as a new variable for a selection criterion to obtain simultaneous gains in the original variables. We obtained genetic gain estimates according to the Eq. (2):
where ΔG (%) is the percentage selection gain, DS the differential selection, h2 the heritability, and the original mean of the trait.
Statistical analyses were carried out using the Genes program (Cruz, 2013) and the "qgraph" package in the R software program (R Core Team, v. 4.1.3).
Results
Significant genetic variance was found in all investigated traits (p < 0.01), except for ARO (Table 2). The estimated heritabilities varied widely. For the sensory attributes, heritability values ranged from 19.47 % for the ARO to 71.25 % for the FIN. It should be noted that the lower heritability for fragrance/aroma is due to the reduced genetic variance.
Genetic and environmental parameters of the traits evaluated in Coffea arabica progenies: F-value, p-value, heritability, accuracy, phenotypic variance (), environmental variance (), genetic variance (), coefficient of genetic variation (CVg %) and the ratio of the coefficient of genetic variation to the coefficient of environmental variation ().
The other quality traits of coffee beans, such as bean size and fruit ripening uniformity, exhibit high heritability (Table 2). The sieve variables S15, S17, and P19 had estimates above 70 %. As regards the characteristics of the beans, heritability ranged from 45 % (°Brix) to 64 % (WEI). The yield showed a value equivalent to 55 %. For variables related to fruit ripening uniformity, values ranged from 39 % (overripe fruit) to 65 % (green bean).
The estimated accuracies for all traits showed moderate to high values except for the fragrance/aroma variable. For the attributes assessed in the sensory analysis, accuracy values were also high, exceeding 70 %. The final score variable had the highest accuracy value (84 %), indicating good precision in estimating genetic merit. As regards the ratio, values less than one were found for almost all traits studied, indicating a high influence of environmental factors.
Factor analysis revealed the formation of four groups of latent variables (Table 3). For the composition of the factors, we adopted as a criterion a factor loading above 0.5 and a communality above 0.6. Thus, certain variables in Table 3, although listed, do not exert a decisive influence on the interpretation of the factors, such as the variables B15 and WEI (in the sieves factor) and YLD, SEM, and DEF (in the fruit ripening uniformity factor).
Final factor loadings of the first four factors and communality (C) obtained by factor analysis and varimax rotation. Variables in each factor were selected based on factor loadings > 0.5 and communality > 0.6. The highlighted numbers in bold meet the criteria for each factor. The name of each factor was chosen based on its agronomic significance.
The first factor is associated with the sensory attributes of beverage quality. It has been named the sensory quality complex, encompassing attributes such as FIN, FLA, ACI, BOD, OVE, BAL, and AFT. The second factor is related to bean size variables and is referred to as sieves (S17, S15, T19). The third factor is influenced by variables related to ripening and harvest practices, which explains the complex called fruit ripening uniformity (RIF, UNR, BRI). The fourth group, the overripe fruit factor, is similar to the third group and is represented by traits OVF and FLO.
To complement the factor analysis, we analyzed a correlation network based on Pearson's correlation (Figure 1). The analysis of the correlation network made it possible to identify the groupings of variables in the four factors similarly identified. Higher correlations were observed between the variables within the factors, and lower correlations were observed between variables belonging to different factors.
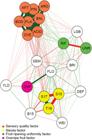
Correlation network between sensory quality (FIN = final score; ARO = fragrance/aroma; FLA = flavor; BOD = body; ACI = acidity; BAL = balance; OVE = overall; AFT = aftertaste), postharvest traits (UNR = unripe fruit; RIF = ripe fruit; SEM = semi-ripe fruit; OVF = overripe fruit; FLO = floating fruit), and yield (BRI = °Brix; YLD = yield; LBG = volume of cherry coffee per bag; DEF = defects; WEI = weight of 100 beans; S17 = sieve 17; S15 = sieve 15; B15 = bottom sieve; T19 = sieve 17 together with sieve 19) in Coffea arabica. Red lines represent negative correlations, and green lines represent positive correlations. The thickness of the line is proportional to the magnitude of the correlation. The highlighted lines show a correlation greater than 0.5 in modulus.
Our results show that the most substantial gains were achieved in traits related to sieve quality (B15, S17, S15, and T19) and fruit ripening uniformity (RIF, UNR, OVF, SEM, and FLO) (Table 4). In contrast, gains in sensory attributes, although present, were more modest, ranging between 1 % and 2 %. Genetic gains for yield were about 14%. These findings highlight the effectiveness of both direct selection and multivariate genetic gain through factor analysis in enhancing various coffee traits.
Direct gain and multivariate gain based on the sensory quality factor. is the mean population. is the mean of selected individuals based on the direct selection on the th variable. is the mean of individuals selected based on the sensory quality factor. ΔG and ΔGM represent the direct gain and the multivariate gain, respectively.
Based on the selection made in the sensory quality factor, the gains obtained in the sensory attributes were maintained as regards the direct gain, as expected (Table 4). As for the sieves factor, the direction of the selection was altered. In other words, it is desirable to increase the bean size, but selection using the sensory quality factor can result in a reduction in bean size by reducing the percentage of S17 and T19. As regards the fruit ripening uniformity factor, we also observed that the UNR trait was selected in the opposite direction (thereby increasing the percentage of green coffee), which is not desirable for producing quality coffee. For the overripe fruit factor, there was a reduction in genetic gain, but it remained in the desired direction, with a reduction in OVF and FLO. Finally, yield (YLD) was negatively affected by selection based on the sensory quality factor.
Discussion
In this study, we investigated the genetic parameters and correlations in C. arabica for the main traits related to coffee quality, post-harvest characteristics, and productivity. In a population of 59 C. arabica progenies, we analyzed the most important quality-related traits. Our analysis revealed significant genetic variation in all traits. In addition, we examined the effectiveness of direct selection and multivariate genetic gain using factor analysis.
The estimated heritability and accuracy varied widely between variables, reflecting differences in genetic control and the potential for selection. Sensory attributes showed moderate to high heritability (19.5 % to 71.3 %), indicating considerable genetic variability that can be exploited in breeding programs. These findings align with the study by Cheserek et al. (2022), which reported significant genetic variability and high heritability (> 60 %) for sensory traits such as taste and aroma. However, our results also revealed lower heritability for specific sensory attributes, such as fragrance/aroma (19.47%), consistent with previous reports of limited genetic control over sensory traits (Malau et al., 2018). These differences confirm that the heritability of sensory quality is influenced by specific factors of the experiment, such as the populations studied or the evaluation methods. In contrast, other quality-related traits, such as bean size and ripening uniformity, showed high genotypic coefficients and heritability.
The predicted genetic gains for ripening uniformity and coffee sieve quality (about 25 %) and yield (about 14 %) were high. On the other hand, direct genetic gains for sensory traits were lower (1-2 %). This is to be expected given the complexity of coffee quality variation resulting from the interaction of multiple traits and environmental influences (Ferreira et al., 2005; Paixão et al., 2022). These results suggest an effective strategy for enhancing coffee quality by targeting indirect traits rather than focusing solely on sensory quality. Therefore, it is essential to consider the relationships between various quality variables and other agronomic traits to establish more effective selection strategies.
As regards the relationship between variables, our results showed low Pearson correlation between sensory attributes and other quality-related traits, such as bean size, ripening uniformity, and yield. Although an increase in bean size generally indicates superior coffee quality (Lima et al., 2020; Velásquez and Banchón, 2023), our results revealed weak correlations between the sensory attributes and sieve sizes (S15, S17, and P19). The low correlation found between sensory attributes and other quality-related characteristics can be attributed to the processing of samples for sensory analysis according to the SCAA protocol, which removes defective beans and standardizes the samples for analysis. Although this practice is essential to ensure the accuracy of sensory analysis, it can obscure biological connections between variables.
Factor analysis effectively grouped the correlated characteristics into four latent variables: sensory quality, sieves (bean size), ripening uniformity, and overripe fruit. Obtaining interpretable factors shows that the variables evaluated have a correlation pattern that can be summarized using common factors. These factors make sense from an agronomic point of view when discussing coffee breeding (Ferreira et al., 2005; Barbosa al., 2019; Paixão et al., 2022).
The use of factorial scores as selection criteria can optimize the selection process by preserving the biological and agronomic significance of the correlated traits (Ferreira et al., 2005; Barbosa et al., 2019; Piza et al., 2023). The sensory quality factor captures the combined effects such as aroma, flavor, acidity, body, and balance, allowing for the simultaneous selection of overall cup quality. This internal consistency highlights the potential for optimizing genetic gains for sensory quality by evaluating the final score rather than focusing on individual sensory components. This approach is particularly beneficial due to the high heritability of the final score, which was observed to be 71.25 %.
Selection based on the sieve factor enables breeders to select the ideal bean size distribution, which directly impacts grading and market price. The ripening uniformity and overripe fruit factors allow for simultaneous improvement in harvesting efficiency and a reduction in undesirable post-harvest defects. This multivariate selection strategy is particularly advantageous for perennial crops, such as coffee, where the breeding cycle is long and genetic progress can be slow (Piza et al., 2023). By selecting several correlated traits simultaneously, breeders can accelerate the development of new cultivars with enhanced sensory quality, productivity, and post-harvest attributes (Barbosa et al., 2019).
One of the important aspects of multivariate selection is to check for correlated responses in other characteristics. We tested this by carrying out a direct selection based on the sensory quality factor. The results suggest that focusing exclusively on sensory quality can result in a reduction in bean size and overall yield. The low correlation observed between sensory attributes and other agronomic traits suggests that selection strategies should be balanced to avoid undesirable responses. To optimize selection gains, we recommend direct selection for highly heritable traits such as bean size and fruit ripening uniformity. The use of factor analysis in selection for quality can serve as a strategy to monitor simultaneous genetic gains without compromising essential agronomic traits such as yield.
Acknowledgments
The authors would like to thank the Coordenação de Aperfeiçoamento de Pessoal de Nível Superior (CAPES), Finance code 001, (grant 88887.499809-2020-00) and Fundação de Amparo à Pesquisa do Estado de Minas Gerais (FAPEMIG) (grant 1568 - 655) for Masters scholarships; and Coffee Research Consortium (grant 10.18.20.037.00.00) for supporting this study.
Data availability statement
All datasets were generated and analyzed in the current study.
References
-
Barbosa IP, Costa WG, Nascimento M, Cruz CD, Oliveira ACB. 2019. Recommendation of Coffea arabica genotypes by factor analysis. Euphytica 215: 1-10. https://doi.org/10.1007/s10681-019-2499-x
» https://doi.org/10.1007/s10681-019-2499-x -
Cheserek JJ, Ngugi K, Muthomi JW, Omondi CO, Kathurima CW. 2022. Genetic variability and correlation of biochemical and sensory characteristics of coffee. Journal of Agricultural Science 14: 95-103. https://doi.org/10.5539/jas.v14n2p95
» https://doi.org/10.5539/jas.v14n2p95 - Cruz CD, Carneiro PCS, Regazzi AJ. 2012 Modelos Biométricos Aplicados ao Melhoramento Genético. Editora UFV, Viçosa, MG, Brazil (in Portuguese).
-
Cruz CD. 2013. GENES - a software package for analysis in experimental statistics and quantitative genetics. Acta Scientiarum 35: 271-276. https://doi.org/10.4025/actasciagron.v35i3.21251
» https://doi.org/10.4025/actasciagron.v35i3.21251 -
Dessalegn Y, Labuschagne MT, Osthoff G, Herselman L. 2008. Genetic diversity and correlation of bean caffeine content with cup quality and green bean physical characteristics in coffee (Coffea arabica L.). Journal of the Science of Food and Agriculture 88: 1726-1730. https://doi.org/10.1002/jsfa.3271
» https://doi.org/10.1002/jsfa.3271 -
Epskamp S, Cramer AOJ, Waldorp LJ, Schmittmann VD, Borsboom D. 2012. qgraph: network visualizations of relationships in psychometric data. Journal of Statistical Software 48: 1-18. https://doi.org/10.18637/jss.v048.i04
» https://doi.org/10.18637/jss.v048.i04 -
Ferreira A, Cecon PR, Cruz CD, Ferrão RG, Silva MF, Fonseca AFA, et al. 2005. Simultaneous selection of Coffea canephora by means of combination of factor analysis and selection indexes. Pesquisa Agropecuária Brasileira 40: 1189-1195. https://doi.org/10.1590/S0100-204X2005001200005
» https://doi.org/10.1590/S0100-204X2005001200005 -
González AL, Lopez AM, Gaytán ORT, Ramos VM. 2019. Cup quality attributes of Catimors as affected by size and shape of coffee bean (Coffea arabica L.). International Journal of Food Properties 22: 758-767. https://doi.org/10.1080/10942912.2019.1603997
» https://doi.org/10.1080/10942912.2019.1603997 - Granate MJ, Cruz CD, Cecon PR, Pacheco CAP. 2001. Analysis of prediction factors in yields by maize selection (Zea mays L.). Acta Scientiarum 23: 1271-1279 (in Portuguese, with abstract in English).
- Kathurima CW, Gichimu BM, Kenji GM, Muhoho SM, Boulanger R. 2009. Evaluation of beverage quality and green bean physical characteristics of selected Arabica coffee genotypes in Kenya. African Journal of Food Science 3: 365-371.
-
Lima JSS, Silva SA, Fonseca A, Pajehu LF. 2020. Quality of Coffea canephora beverage as a function of genotype, processing method and grain size. Coffee Science 15: e151714. https://doi.org/10.25186/.v15i.1714
» https://doi.org/10.25186/.v15i.1714 -
Malau S, Siagian A, Sirait B, Ambarita H, Pandiangan S, Sihotang MR, et al. 2018. Variability of organoleptic quality of Arabica coffee. Anatolian Journal of Agricultural Sciences 33: 241-245 (in Turkish, with abstract in English). http://doi.org/10.7161/omuanajas.405418
» http://doi.org/10.7161/omuanajas.405418 -
Montagnon C, Guyot B, Cilas C, Leroy T. 1998. Genetics parameters of several biochemical compounds from green coffee, Coffea canephora Plant Breeding 117: 576-578. https://doi.org/10.1111/j.1439-0523.1998.tb02211.x
» https://doi.org/10.1111/j.1439-0523.1998.tb02211.x -
Paixão PTM, Nascimento ACC, Nascimento M, Azevedo CF, Oliveira GF, Silva FL, et al. 2022. Factor analysis applied in genomic selection studies in the breeding of Coffea canephora Euphytica 218: 42. https://doi.org/10.1007/s10681-022-02998-x
» https://doi.org/10.1007/s10681-022-02998-x -
Piza MR, Luz SROT, Andrade VT, Figueiredo VC, Abrahão JCR, Bruzi AT, et al. 2023. Multiple traits selection strategies: a proposal for coffee plant breeding. Agronomy 13: 2033. https://doi.org/10.3390/agronomy13082033
» https://doi.org/10.3390/agronomy13082033 -
Reyes González F, Prado EE, Portilla EP, Vargas GA, Curiel-Rodríguez AC, Gómez JAH. 2016. Evaluation of productivity, physical and sensory quality of coffee (Coffea arabica L.), beans in coffee trees grafted on CRUO, Huatusco, Veracruz. Revista de Geografía Agrícola 56: 45-53 (in Spanish, with abstract in English). https://doi.org/10.5154/r.rga.2016.56.006
» https://doi.org/10.5154/r.rga.2016.56.006 -
Rosado RDS, Rosado LDS, Cremasco JPG, Santos CEM, Dias DCFS, Cruz CD. 2017. Genetic divergence between passion fruit hybrids and reciprocals based on seedling emergence and vigor. Journal of Seed Science 39: 417-425. https://doi.org/10.1590/2317-1545v39n4183293
» https://doi.org/10.1590/2317-1545v39n4183293 -
Rosado RDS, Rosado LDS, Borges LL, Bruckner CH, Cruz CD, Santos CEM. 2019. Genetic diversity of sour passion fruit revealed by predicted genetic values. Agronomy Journal 111: 165-174. https://doi.org/10.2134/agronj2018.05.0310
» https://doi.org/10.2134/agronj2018.05.0310 -
Sobreira FM, Oliveira ACB, Pereira AA, Guarçoni AM, Sakiyama NS. 2016. Divergence among Arabica coffee genotypes for sensory quality. Australian Journal of Crop Science 10: 1442-1448. http://doi.org/10.21475/ajcs.2016.10.10.p7430
» http://doi.org/10.21475/ajcs.2016.10.10.p7430 -
Specialty Coffee Association of America (SCAA). 2015. SCAA Protocols: Cupping Specialty Coffee. SCAA, Santa Ana, CA, USA. Available at http://www.scaa.org/?page=resources&d=cupping-protocols [Accessed Jan 20, 2024]
» http://www.scaa.org/?page=resources&d=cupping-protocols -
Velásquez S, Banchón C. 2023. Influence of pre-and post-harvest factors on the organoleptic and physicochemical quality of coffee: a short review. Journal of Food Science and Technology 60: 2526-2538. https://doi.org/10.1007/s13197-022-05569-z
» https://doi.org/10.1007/s13197-022-05569-z
Edited by
-
Edited by:
Leonardo Oliveira Medici