 Association between work stress and dietary variety and diversity scores in ELSA-Brasil baseline participants
ABSTRACT
Objective To analyze the association between work-related stress and dietary variety and diversity scores in ELSA-Brasil participants.
Methods Cross-sectional study using data from ELSA-Brasil (2008-2010). Food frequency questionnaires were used to compile dietary variety and diversity scores. Psychological demand, work control and social support at work were assessed. Each dimension of the outcome variable was scored as the sum of all the items and categorized as adequate and inadequate, using the median (≥18) for variety and the highest number of items consumed (≥9) for diversity. For high psychological demand, high control and high social support, the medians were >14, >18 and >20, respectively. A logistic regression model was used, controlled for sociodemographic, lifestyle and health variables.
Results Individuals with high demand had higher odds of inadequate diet variety compared to those with low demand (OR 1.05, CI: 0.96-1.14) and those with high control (OR 1.21, CI: 1.11-1.32) compared to those with low control, which was statistically significant.
Conclusion The results show a positive and significant association between work control and diet variety.
Keywords
Occupational stress; Diet, Food, and Nutrition; Work; Feeding behavior; Index
RESUMO
Objetivo Analisar a associação entre o estresse no trabalho e os escores de variedade e de diversidade da dieta em participantes da linha de base do ELSA-Brasil.
Métodos Estudo seccional com participantes do ELSA-Brasil. Questionário de frequência alimentar utilizado para a elaboração dos escores de variedade e diversidade da dieta. Demanda psicológica, controle no trabalho e apoio social no trabalho foram avaliados. Cada dimensão da variável desfecho foi pontuada como a soma de todos os itens e categorizadas como adequado e inadequado, usando para variedade a mediana (≥18) e para a diversidade o maior número de itens consumidos (≥9). Para alta demanda psicológica, alto controle e alto apoio social considerou-se como ponte de corte as medianas, >14, >18 e >20, respectivamente. Modelo de regressão logística foi utilizando sendo controlado pelas variáveis sociodemográficas, de estilo de vida e saúde.
Resultados Indivíduos com alta demanda tiveram maiores chances de inadequação na variedade de dieta comparado àqueles com baixa demanda (OR 1,05, IC: 0,96-1,14) e os de alto controle (OR 1,21, IC: 1,11-1,32) comparados ao de baixo controle, estatisticamente significativo.
Conclusão Os resultados mostram uma associação positiva e significativa entre controle no trabalho e variedade da dieta.
Palavras-chave
Estresse ocupacional; Alimentos, Dieta e nutrição; Trabalho; Comportamento alimentar; Índices
INTRODUCTION
Exposure to psychosocial risks in work contexts has been one of the greatest challenges in occupational health policies. According to the World Health Organization (WHO), psychosocial factors such as the interactions between the environment and working conditions, organizational conditions, job roles and content, effort levels, and individual and family characteristics of workers play a significant role in workers’ mental health [1]. However, the nature of psychosocial factors is complex, involving issues related to health risks through social and psychological mechanisms of the general and work environment [2].
Work has been considered one of the sources of stress [3], with the main workplace stressors being the division of tasks in the work environment, precarious work organization conditions, low worker appreciation, and the lack of synchrony between the job description and what is performed in daily work practice. Stress is a state that causes wear and tear on the human body and/or a decrease in work capacity. On its own, stress cannot trigger an organic disease or cause significant dysfunction in an individual’s life, unless other conditions are present, such as organic vulnerability or an inadequate way of assessing and coping with the stressful situation; it can pose a health risk [4]. Furthermore, attitudes and behaviors towards food can be shaped by stress in a bidirectional manner, decreasing or increasing food consumption [3].
Souza et al. [5] emphasize that eating habits can be altered when individuals are subjected to psychosocial stress, contributing to unfavorable health outcomes such as obesity, biochemical and metabolic changes, and cardiovascular diseases.
Given the growing importance of studying the association between eating habits and health outcomes, several indices have been developed based on conceptual criteria of healthy eating and nutritional recommendations. These indices aim to provide a summary measure of the main characteristics of eating (diet variety, adequate intake of nutrients and food groups) [6]. These indices or scores facilitate the assessment of diet quality in populations or groups of individuals, since their components are generally quantified and, when added together, offer an overall measure of quality, such as Diet Variety Scores (DVS), which quantify the number of different foods consumed, which can be expressed over a period, a week, a month or a year or even a day, and the Diet Diversity Score (DDS), which expresses the consumption of food groups considered healthy [7]. In addition to these, the following indices have also been used: Nutrient Adequacy Ratio (NAR), which compares the individual daily intake of a nutrient with the Recommended Dietary Allowance (RDA), and the Mean Adequacy Ratio (MAR), which verifies the adequacy of nutrients for the nutrients selected for a given individual [8,9].
Psychosocial stress, which is associated with both increased and decreased food consumption, affects eating in a bidirectional manner. Around 40% of individuals reduce their food intake and lose weight during or after stress, while another 40% increase their food intake during stress [3].
Although some studies have been carried out on stress at work and its impact on dietary intake [10,11], no publications were found that correlate psychosocial stress with diet diversity and variety. Therefore, this study aimed to analyze the association between work-related stress and dietary variety and diversity scores among baseline participants of the ELSA-Brasil study.
METHODS
Design and study population
For the present study, data from the baseline of the Estudo Longitudinal da Saúde do Adulto (ELSA-Brasil, Longitudinal Study of Adult Health) cohort were analyzed. This cohort is composed of active or retired employees from five Public Educational Institutions (Federal Universities of Bahia, Espírito Santo, Minas Gerais, and Rio Grande do Sul; University of São Paulo) and one Public Research Institution, Fundação Oswaldo Cruz (FIOCRUZ, Oswaldo Cruz Foundation) in Rio de Janeiro, at the time the baseline was established, 2008-2010 [12].
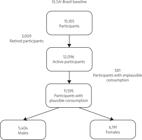
Of the 15,105 participants, 3,009 retired participants were excluded. From the remaining 12,096 participants, 501 individuals with extreme dietary intake were excluded, i.e., those whose dietary intake was less than 500 kcal or greater than 5000 kcal. Thus, the final sample comprised 11,595 individuals, including 5,404 men and 6,191 women (Figure 1).
Standardized questionnaires were used to record sociodemographic data of all participants during in-person visits to the research centers. Interviews and anthropometric measurements were obtained by trained and certified interviewers following standardized protocols.
Diet scores
The diet variety and diversity scores were calculated from food consumption data obtained from the Food Frequency Questionnaire (FFQ), which included 114 food items. The FFQ was administered to assess the participants’ habitual consumption over the past 12 months. The ELSA-Brasil FFQ was structured into three sections: (1) foods/preparations, (2) consumption portion sizes, and (3) consumption frequencies, with eight response options: “more than 3 times/day,” “2-3 times/day,” “1 time/day,” “5-6 times/week,” “2-4 times/week,” “1 time/week,” “1-3 times/month,” and “never/rarely”. Participants were asked to read a list of foods they had habitually consumed over the past 12 months and encouraged to respond to how often consumption occurred per day, week, or month.
Diet variety scores
The DVS [13] was composed of the main food groups consumed by the study population, considering the healthy diet recommended by the Dietary Guidelines for the Brazilian Population [14]. The score quantifies the number of different healthy foods consumed, which can be expressed over a period, a week, a month, a year, or even a day. Foods and preparations typical of the regions (including typical dishes), ultra-processed foods and beverages, and alcoholic beverages were excluded.
The following groups composed the variety score: 1) Cereals, 2) Dairy products, 3) Red meat (beef and pork), 4) Fruits, 5) Vegetables, 6) Eggs, 7) Fish, 8) Roots, 9) Legumes, 10) Seafood, 11) Poultry, 12) Nuts and seeds, 13) Breads, 14) Tubers, 15) Leafy greens, 16) Rice, 17) Pasta, 18) Coffee and tea, 19) Natural juice with or without added sugar, 20) Fermented beverages, and 21) Fats and oils. Individuals who consumed any food from any defined food group received the score related to the item, and the final sum was calculated, ranging from 1 to 21 (Chart 1). The total score was dichotomized, based on the median of the distribution (Md=18), into inadequate (when below the cutoff point) and adequate (when above or equal to the cutoff point).
Diet diversity score
The DDS quantifies the number of food groups consumed daily, considering a predetermined list of foods distributed among the aforementioned groups, grouped by nutritional similarity, based on healthy eating recommendations. The main utility of food scores lies in their ability to indicate diet quality, as diet with a greater variety of items tends to meet adequacy for all nutrients. This score can provide a good indication of the nutritional adequacy of the diet, particularly when combined.
The score [15] was divided into 9 groups: 1) Cereals; 2) Milk (whole and skimmed); 3) Meats (red and white); 4) Fruits; 5) Vegetables; 6) Eggs; 7) Fish; 8) Roots and tubers; and 9) Legumes and nuts (Chart 1). Participants who had a minimum daily consumption of 15 g were considered adequate. The DDS was dichotomized into less than or equal to eight and equal to nine, i.e., individuals who consumed below nine groups were considered inadequate, and individuals who consumed all nine food groups were considered adequate.
Food groups for constructing the Diet Variety Score and Diet Diversity Score and Micronutrients for composing the Nutrient Adequacy Ratio.
Nutrient Adequacy Ratio
To determine the micronutrient adequacy, the Nutrient Adequacy Ratio (NAR) was used for each of the following 14 micronutrients: vitamin A, vitamin C, vitamin E, thiamine (B1), riboflavin (B2), calcium, iron, zinc, selenium, niacin (B3), phosphorus, sodium, magnesium, and potassium (Chart 1) [16]. The NAR was calculated based on the participant’s nutrient intake divided by the recommended nutrient intake according to the Dietary Reference Intake (DRI). Adequate Intake (AI) was used alternatively for the NAR calculation for sodium and potassium. The NAR value for nutrients could be below, equal to, or greater than 1.
Mean Adequacy Ratio
The Mean Adequacy Ratio (MAR) is an indicator used to assess individual nutrient intake. This index quantifies the overall nutritional adequacy of a population based on the individual’s diet, using the recommended amount of a group of nutrients of interest [16]. The first step in estimating the MAR is to calculate the NAR for all nutrients of interest. The first step to estimate the MAR is to estimate the NAR for all nutrients of interest. The mean adequacy index (MAR,%), which reflects overall diet adequacy, was defined as the sum of NAR for each micronutrient divided by the number of all micronutrients involved. In this article, NAR was truncated at 1 so that a nutrient with a high NAR could not compensate for a nutrient with a low NAR.
It is important to note that the ideal value for both indicators above is equal to 1, since it represents that the daily nutrient intake meets the nutritional recommendation.
Exposure variable
The DCSQ model, used in this study to assess psychosocial stress at work, was applied through the Brazilian version of the Demand-Control-Support (DCS) questionnaire, adapted by Alves et al. [17]. This version consists of 17 items that address three dimensions. The DCSQ questionnaire covers questions related to psychological demands at work, control at work, and social support in the work environment.
Psychological demands at work (composed of five items) and control at work (six items) were evaluated using a 1 to 4 Likert-type scale, ranging from “frequently” to “never/almost never”. For the calculation of scores, a value of 1 to 4 was assigned to each response, considering reverse scoring in the items of both scales. Social support at work, in turn, was measured through six items related to interaction with colleagues and supervisors, with responses ranging from “strongly agree” to “strongly disagree” on the same 1 to 4 Likert scale [18].
In the literature, various statistical techniques are employed to implement the scores of these scales, such as the use of quadrants, logarithmic transformation, calculation of quotients, and dichotomization of dimensions based on the median, as described by some authors [18,19].
Each dimension was scored as the sum of all corresponding items and then categorized as high or low, using the median of the studied population as the cutoff point (high psychological demand >14, and low psychological demand ≤14; high control >18, and low control ≤18; and high social support >20, and low social support ≤20), according to Griep et al. [20].
Covariates
The covariates selected in this study were those related to the following characteristics: sex (male and female); age range in years: “35 to 44”, “45 to 54”, “55 to 64”, and “65 to 72”; education level (“incomplete primary education”, “complete primary education”, “complete secondary education “, and “complete higher education”); marital status (“married/partnered”, “separated/widowed”, and “single”); skin color/race (“white”, “black/brown”, and “yellow/indigenous”); smoking status (“never smoked”, “former smoker”, and “smoker”); alcohol use (“never used”, “former user”, “user”); Body Mass Index (BMI), calculated from weight and height (kg/m²) (“underweight/eutrophy” (BMI <25.0 kg/m²), “overweight” (BMI = 25.0-29.9 kg/m²), and “obesity” (BMI ≥30.0 kg/m²); physical activity, assessed through the commuting and leisure-time physical activity blocks of the International Physical Activity Questionnaire (IPAQ), long version (“low,” “moderate,” and “high”); and Common Mental Disorders (CMD), evaluated using the Clinical Interview Schedule − Revised Version (CIS-R) adapted to Portuguese (“no” and “yes”).
Data analysis
Absolute and relative frequencies were used in the descriptive analyses. The significance criterion of p-value =0.05 was adopted for selecting variables to compose the multiple regression model. The logistic regression model was used to test associations between the exposure (psychosocial stress) and the outcomes (variety and diversity scores). The covariates were inserted into the model following the distal structure (age range, education level, marital status, and race), followed by the intermediate (BMI and CMD) and proximal (sex, physical activity, tobacco use, and alcohol use). Those that maintained statistical significance in the analysis of the models were kept until reaching the adjusted multiple model. All analyses were conducted using R software, version 2022 [21].
Ethical aspects
The ELSA-Brasil study had its protocols – Protocol No. 976/2006 – approved by the Comissão Nacional de Ética em Pesquisa (CONEP, National Research Ethics Commission) and the Research Ethics Committee of Fundação Osvaldo Cruz (Fiocruz). All participants only answered the questionnaires and underwent examinations and measurements after signing the Informed Consent Form.
RESULTS
Table 1 shows that dietary variety inadequacy occurred in 38.6% of participants with low psychological job demand, 42.9% of those with low job control, and 40.0% of those who reported high social support at work. Inadequate DVS was concentrated in men (39.7%), in the age group of 65 to 72 years old (42.9%), in those with incomplete primary education (69.3%), and in single individuals (40.3%). Furthermore, we observed that those who reported smoking habits (45.5%) and those classified as obese (42.3%) had higher proportions of inadequate variety. It is also observed that, among participants with inadequate diet diversity, those with the highest proportions were those with low psychological job demand (31.2%), low job control (31.5%), and low social support at work (31.1%). It is worth noting that inadequate diet diversity among women was 34.3%, 34.6% in the age group of 65 to 72 years old, 41.7% in those with incomplete elementary education, 34.0% in separated/widowed individuals, and 35.8% in those who reported being smokers.
Distribution of inadequacy, Diet Variety Score and Diet Diversity Score according to the variables of the ELSA-Brasil study (2008-2010).
The Mean Adequacy Ratio (MAR) was 93.0%, with higher scores in DVS and DDS associated with higher MAR percentages (Table 2).
Mean MAR Scores for Different Levels of Diet Variety Score and Diet Diversity Score. ELSA-Brasil, 2008-2010 (n=11,595).
Table 3 shows that participants with high job control have higher odds of inadequate diet variety compared to those with low job control, with statistical significance (OR 1.21, 95% CI: 1.11-1.32).
Odds ratios of the association between demand, control and social support at work and Diet Variety Score and Diet Diversity Score. ELSA-Brasil, 2008-2010 (n=11,595).
DISCUSSION
The results suggest a higher likelihood of inadequacy in the diet variety score among those with high job control. For the diet diversity score, the association with psychological demand and social support at work appears protective, although it lacks statistical significance.
The results of a meta-analysis showed that the relationship between stress and overall food consumption was of small magnitude, but these findings were aligned with previous narrative reviews, which suggested that food consumption could vary in response to stress among different individuals. Although the effect sizes were modest, they were significant, as they evidenced that stress impacts the consumption of healthy and unhealthy foods in a differentiated way [22]. On the other hand, when investigating the relationship between psychosocial stress at work and food compulsion, the results indicated a direct association, with BMI acting as a modifying factor [23].
Our results indicated that high psychological demand is positively associated with dietary variety, although this association lost statistical significance after adjustments. In a study involving 324 public servants from a public university in Ceará, using the DCSQ questionnaire and two dietary recalls, the results showed, in relation to dietary patterns with high psychological demand in the adjusted model, the patterns named mixed dietary pattern (tubers, poultry, eggs, pasta, smoothies, and cheeses) and prudent dietary pattern (grains, olive oil and oilseeds, skimmed dairy products and white cheeses, fruits) without statistical significance when compared to low psychological demand. The “vegetable, seafood, and infusions” dietary pattern (vegetables, leafy greens, coffee, tea, fish, and seafood) (PR=1.57; 95% CI 1.01–2.43) and the “energy-dense” dietary pattern (industrialized beverages, fast food, processed meats, ultra-processed foods, sugars and sweets, sweetened fruit juices and pulps) (PR=1.57; 95% CI 1.01–2.43) showed that high psychological demand was associated with a 57% higher prevalence ratio compared to low psychological demand. Conversely, the “common Brazilian” dietary pattern (bread, cakes and cookies, rice and risottos, beans and legumes, fats, meat) (PR=0.57; 95% CI 0.33–0.97) was found to be protective for individuals classified as having high psychological demand when compared to those with low psychological demand [24].
When evaluating control at work and the association with variety and diversity scores, individuals with high control showed a higher chance of risk for variety scores, and for diversity, the results indicated a borderline protective effect. In the adjusted model of public servants from a university in Ceará, the mixed and energy-dense patterns did not show statistical significance when comparing low control at work to high control. Regarding the prudent pattern (PR=0.43; 95% CI 0.27-0.70) and plant-based/vegetables pattern (PR=0.50; 95% CI 0.31-0.80) patterns, the results showed that low control at work has an inverse relationship when compared to high control at work [24].
Regarding social support, some studies corroborate our findings, i.e., social support at work as a protective factor, although we found a borderline association for diet inadequacy [24,25]. In the study by Monteiro Sampaio et al. [24] with public servants, those with low social support compared to those with high social support showed a higher risk for the common Brazilian dietary pattern, however, it was not statistically associated (PR=1.59; 95% CI 0.85-2.07). The prudent dietary pattern (PR=0.62; 95% CI 0.40-0.97) showed a protective relationship between those with low social support at work when compared to those with high social support. Furthermore, another study observed positive associations between diet and social support, such as the study that evaluated the association between dietary patterns and social support at work with Brazilian bank employees, aged 20 to 64 years, the authors showed that the “traditional and protein” pattern (beans, rice, meats and derivatives, eggs, French fries, breads and butter) showed risk for those with low social support when compared to those with high social support (PR=1.50; 95% CI 1.04-2.15) [26].
Ferranti et al. [27] also found in a study with workers from Emory University (Georgia/USA) that social support is associated with better diet quality for the diet quality indices evaluated: Alternate Healthy Eating Index (AHEI), Dietary Approaches to Stopping Hypertension (DASH) diet, and Mediterranean diet score. These results indicate that individuals with greater social support at work, maintaining a more active interaction among themselves, allow for greater adherence to a diet more related to local culture and healthier.
In the China Health and Nutrition Survey (CHNS) study, conducted with 7434 participants, the association between diet diversity score and perceived psychosocial stress, measured by the Perceived Stress Scale (PSS), was examined. The scale, validated for the Chinese population, has 14 items, with scores ranging from zero to 56, and a score >25 may have a certain degree of negative impact on a person’s physical and mental health. The result showed that those who had greater dietary diversity (scores ≥9, OR: 0.480, 95% CI: 0.300-0.770) in their daily diet were less likely to have a higher level of psychological stress, compared to participants with lower daily dietary diversity (scores = 3) (OR: 0.809, 95% CI: 0.521-1.258) [28].
The results found from the association of dietary diversity and psychosocial stress at work, observed in the ELSA-Brasil worker sample, show a protective relationship, similar to those found in the study with Chinese individuals. The proximity between the results, despite cultural and dietary differences, can be explained by the fact that the DDS is a tool that assesses the diversity of food groups consumed daily, considering the food culture of each individual. This tool uses a specific list of foods, which are organized into groups according to their nutritional similarities. This approach is based on healthy eating recommendations, which can indicate the consumption of a diversified diet.
In the PROMESTRE study, conducted with 502 teachers from 20 public schools in Londrina (Paraná, Brazil), in 2012 (1st wave) and 2015 (2nd wave), verifying the association between psychosocial stress at work, using the combination of low control at work, distinguishing four basic types of work experiences, generated by the interaction of “high” and “low” levels of psychological demand and control: “high job strain” (characterized as high demand and low control), “active work” (high demand and high control), “passive work” (low demand and low control), and “low job strain” (combining low demand and high control), verifying the weekly frequency of fruit and other vegetable consumption, the substitution of meals for snacks, and the removal of visible fat from red meat and the removal of skin from chicken meat, showed that teachers who reported high psychological demand and low control were more likely to reduce fruit consumption (coefficient = 0.064, 95% CI: 0.018, 0.109) and less likely to increase (coefficient = -0.066, 95% CI: 0.115, -0.016) the frequency of fruit consumption compared to teachers who reported low stress. Furthermore, teachers with passive work, i.e., low psychological demand and low control, were more likely to increase the frequency of skin removal from chicken meat (coefficient = 0.061, 95% CI: 0.014-0.108) compared to respondents with high stress at work [25].
The strength of these results is based on the ELSA-Brasil data, a large-scale multicenter cohort study with 15,105 participants, which applied rigorous measures to ensure data quality and used diet variety and diversity scores in relation to psychosocial stress. However, limitations are also found in the results, since it is a cross-sectional study, and temporality cannot be established, and reverse causality seems likely with diet, temporal evidence on the nature of the association is less clear, and associations may possibly be bidirectional and explainable by common causes. Furthermore, the variation among proposals regarding the number of food groups to be formed makes it difficult to reach a consensus on which and how many items and food groups should be grouped for the formation of scores. Additionally, the application of the diet variety score does not take into account the quantity of foods consumed within the groups, nor the variation within the group itself, i.e., the individual may always consume the same food within a food group that encompasses several other foods. Thus, there is no way to know whether the individual varied only the food groups or also the foods belonging to the same group.
Finally, the result of the work stress assessment is related to the sample of this study, composed of public servants, in which the levels of the DCSQ dimensions are also more similar, which can lead to an underestimation of the association measures.
CONCLUSION
In conclusion, the results show a positive association between control at work and diet variety. Although the observed odds ratios were not statistically significant, their borderline values suggest that psychological demand and social support at work may act as protective factors against inadequate diet diversity. It is worth noting that 80% of the population studied followed the recommendations for a varied and diversified diet, according to the indices used. These findings reinforce the importance of considering psychosocial aspects related to work when promoting a healthy diet, going beyond the simple focus on nutritional recommendations.
-
Article based on the dissertation by BVG LOUREIRO, intitled “Associação entre estresse psicossocial no trabalho e os índices de diversidade e variedade da dieta: resultados da linha de base do ELSA-Brasil”. Universidade do Estado do Rio de Janeiro; 2021.
-
How to cite this article:
Loureiro BVG, Fonseca MJM, Barreto SM, Alvim SM, Griep RH, Aguiar OB. Association between work stress and dietary variety and diversity scores in ELSA-Brasil baseline participants. Rev Nutr. 2025;38:e240025. https://doi.org/10.1590/1678-9865202538e240025
REFERENCES
-
1 World Health Organization. World mental health report: transforming mental health for all. Geneva: World Health Organization; 2022 [cited 2022 Jan 10]. Available from: https://www.who.int/publications/i/item/9789240049338
» https://www.who.int/publications/i/item/9789240049338 -
2 Vasconcelos VD, Trentini CM. Avaliações psicossociais no trabalho no Brasil: Estudo de levantamento sobre variáveis, modelos teóricos, instrumentos e critérios adotados. RPOT. 2021;21(1):1355-66. doi: https://dx.doi.org/10.5935/rpot/2021.1.20373
» https://doi.org/10.5935/rpot/2021.1.20373 -
3 Matos SMR, Ferreira JCS. Stress and eating behavior. RSD. 2021 [cited 2023 Aug 23];10(7):e26210716726. Available from: https://rsdjournal.org/index.php/rsd/article/view/16726
» https://rsdjournal.org/index.php/rsd/article/view/16726 -
4 Freitas PP, Lopes MS, Assunção AÁ, Lopes ACS. Health and work in Brazil: physical and psychosocial demands. Cad Saúde Pública. 2021;37(9): e00129420. doi: https://doi.org/10.1590/0102-311X00129420
» https://doi.org/10.1590/0102-311X00129420 -
5 Souza MPG, Sampaio R, Cavalcante ACM, Arruda SPM, Pinto FJM. Comportamento alimentar e fatores associados em servidores: contribuições para a saúde coletiva. Rev Aten Saúde. 2020;18(63):99-109. doi: https://doi.org/10.13037/ras.vol18n63.6162
» https://doi.org/10.13037/ras.vol18n63.6162 -
6 Burggraf C, Teuber R, Brosig S, Meier T. Review of a priori dietary quality indices in relation to their construction criteria. Nutr Rev. 2018;76(10):747-64. doi: https://doi.org/10.1093/nutrit/nuy027
» https://doi.org/10.1093/nutrit/nuy027 -
7 Trijsburg L, Talsma EF, de Vries JHM, Kennedy G, Kuijsten A, Brouwer ID. Diet quality indices for research in low- and middle-income countries: a systematic review. Nutr Rev. 2019;77(8):515-40. doi: https://doi.org/10.1093/nutrit/nuz017
» https://doi.org/10.1093/nutrit/nuz017 -
8 Román-Viñas B, Serra-Majem L, Ribas-Barba L, Ngo J, García-Alvarez A, Wijnhoven TM, et al. Overview of methods used to evaluate the adequacy of nutrient intakes for individuals and populations. Br J Nutr. 2009;101(Suppl 2): S6-S11. doi: https://doi.org/10.1017/S0007114509990535
» https://doi.org/10.1017/S0007114509990535 -
9 Cowan AE, Jun S, Tooze JA, Dodd KW, Gahche JJ, Eicher-Miller HA, et al. A narrative review of nutrient based indexes to assess diet quality and the proposed total nutrient index that reflects total dietary exposures. Crit Rev Food Sci Nutr. 2023;63(12):1722-32. doi: https://doi.org/:10.1080/10408398.2021.19678
» https://doi.org/10.1080/10408398.2021.19678 -
10 Penaforte F, Matta N, Japur C. Associação entre estresse e comportamento alimentar em estudantes universitários. Demetra. 2015;11(1):225-37. doi: https://doi.org/10.12957/demetra.2016.18592
» https://doi.org/10.12957/demetra.2016.18592 -
11 Amano H, Fukuda Y, Baden MY, Kawachi I. Is work engagement associated with healthier dietary patterns? A cross-sectional study. J Occup Health. 2020;62(1):e12149. doi: https://doi.org/10.1002/1348-9585.12149
» https://doi.org/10.1002/1348-9585.12149 -
12 Schmidt Mi, Duncan BB, Mill JG, Lotufo PA, Chor D, Barreto SM, et al. Cohort Profile: Longitudinal Study of Adult Health – ELSA/BRASIL. Int J Epidemiol. 2015;44(1):68-75. doi: https://doi.org/10.1093/ije/dyu027
» https://doi.org/10.1093/ije/dyu027 -
13 Danquah I, Galbete C, Meeks K, Nicolaou M, Klipstein-Grobusch K, Addo J, et al. Food variety, dietary diversity, and type 2 diabetes in a multi-center cross-sectional study among Ghanaian migrants in Europe and their compatriots in Ghana: the RODAM study. Eur J Nutr. 2018;57(8):2723-33. doi: https://doi.org/10.1007/s00394-017-1538-4
» https://doi.org/10.1007/s00394-017-1538-4 -
14 Ministério da Saúde, Secretaria de Atenção à Saúde, Departamento de Atenção Básica (Brasil). Guia alimentar para a população brasileira. 2nd ed. Brasília: Ministério da Saúde; 2014 [cited 2022 Jan 18]. Available from: https://bvsms.saude.gov.br/bvs/publicacoes/guia_alimentar_populacao_brasileira_2ed.pdf
» https://bvsms.saude.gov.br/bvs/publicacoes/guia_alimentar_populacao_brasileira_2ed.pdf -
15 Gómez G, Fisberg RM, Nogueira Previdelli Á, Sales CH, Kovalskys I, Fisberg M, et al. Diet quality and diet diversity in eight Latin American Countries: results from the Latin American Study of Nutrition and Health (ELANS). Nutrients. 2019;11(7):1605. doi: https://doi.org/10.3390/nu11071605
» https://doi.org/10.3390/nu11071605 -
16 Wang Z, Chen Y, Tang S, Chen S, Gong S, Jiang X, et al. Dietary Diversity and Nutrient Intake of Han and Dongxiang Smallholder Farmers in Poverty Areas of Northwest China. Nutrients. 2021;13(11):3908. doi: https://doi.org/10.3390/nu13113908
» https://doi.org/10.3390/nu13113908 -
17 Alves MGM, Chor D, Faerstein E, Lopes CS, Werneck GL. Versão resumida da “job stress scale”: adaptação para o português [Short version of the “job stress scale”: a Portuguese-language adaptation]. Rev Saúde Pública. 2004;38(2):164-71. doi: https://doi.org/10.1590/s0034-89102004000200003
» https://doi.org/10.1590/s0034-89102004000200003 -
18 Alves MGM, Braga VM, Faerstein E, Lopes CS, Junger W. The demand-control model for job strain: a commentary on different ways to operationalize the exposure variable. Cad Saúde Pública. 2015;31(1):208-12. doi: https://doi:10.1590/0102-311x00080714
» https://doi.org/10.1590/0102-311x00080714 -
19 Portela LF, Griep RH, Landsbergis P, RotenbergL. Self-reported hypertension and job strain in nursing personnel: assessing two different formulations of demand-control model. Clin Nurs Stud. 2015;3(2):46-52. doi: https://doi.org/10.5430/cns.v3n2p46
» https://doi.org/10.5430/cns.v3n2p46 -
20 Griep RH, Rotenberg L, Landsbergis P, Vasconcellos-Silva PR. Combined use of job stress models and self-rated health in nursing. Rev Saúde Pública. 2011;45(1):145-52. doi: http:https://doi:10.1590/s0034-89102011000100017
» https://doi.org/10.1590/s0034-89102011000100017 -
21 R Core Team. R: A language and environment for statistical computing. Vienna: R Foundation for Statistical Computing; 2022 [cited 2022 Mar 18]. Available from: https://www.R-project.org/
» https://www.R-project.org/ -
22 Hill D, Conner M, Clancy F, Moss R, Wilding S, Bristow M, et al. Stress and eating behaviours in healthy adults: a systematic review and meta-analysis. Health Psychol Rev. 2022;16(2):280-304. doi: https://doi.org/10.1080/17437199.2021.1923406
» https://doi.org/10.1080/17437199.2021.1923406 -
23 Pena Gralle APB, Barbosa Moreno A, Lopes Juvanhol L, Mendes da Fonseca MJ, Prates Melo EC, Antunes Nunes MA, et al. Job strain and binge eating among Brazilian workers participating in the ELSA-Brasil study: does BMI matter? J Occup Health. 2017;59(3):247-55. doi: https://doi.org/10.1539/joh.16-0157-OA
» https://doi.org/10.1539/joh.16-0157-OA -
24 Monteiro Sampaio RM, Montenegro Cavalcante AC, Pinheiro Machado AS, Façanha BMLC, Pimentel GSM, Sampaio LAC. Estresse no trabalho e qualidade de vida associados aos padrões alimentares em servidores de uma universidade pública. Gest Cuid Saúde. 2023;1(2):e11144. doi: https://doi.org/10.70368/gecs.v1i2.11144
» https://doi.org/10.70368/gecs.v1i2.11144 -
25 Rodrigues R, Birolim MM, de Andrade SM, González AD, Mesas CE, Fernández-Rodríguez R, et al. Job strain is prospectively associated with a lower frequency of fruit consumption in schoolteachers. Public Health Nutr. 2021;24(7):1678. doi: https://doi.org/10.1017/S1368980021000860
» https://doi.org/10.1017/S1368980021000860 -
26 Cattafesta M, Zandonade E, Bissoli NS, Salaroli LB. Padrões alimentares de trabalhadores bancários e sua associação com fatores socioeconômicos, comportamentais e laborais. Ciênc Saúde Coletiva. 2019;24:3909-22. doi: https://doi.org/10.1590/1413-812320182410.31342017
» https://doi.org/10.1590/1413-812320182410.31342017 -
27 Ferranti EP, Dunbar SB, Higgins M, Dai J, Ziegler TR, Frediani JK, et al. Psychosocial factors associated with diet quality in a working adult population. Res Nurs Health. 2013;36(3):242-56. doi: https://doi.org/10.1002/nur.21532
» https://doi.org/10.1002/nur.21532 -
28 Zhou J, Wang H, Zou Z. Inverse association between dietary diversity score calculated from the diet quality questionnaire and psychological stress in chinese adults: a prospective study from China Health and Nutrition Survey. Nutrients. 2022;14(16):3297. doi: https://doi.org/10.3390/nu14163297
» https://doi.org/10.3390/nu14163297
Edited by
-
Editor
Luciana Bertoldi Nucci