 Enhancing crop insurance analysis with agricultural zoning data
Abstract
Abstract This article proposes a framework for integrating agricultural zoning data into insurance risk analysis. It is based on combining official public information from the Brazilian zoning program, ZARC, with open insurance data provided by the Brazilian Ministry of Agriculture and Livestock. The methodology presented in this article transforms ZARC information into distributional data and integrates it into a Bayesian model alongside insurance indemnities data, allowing for comprehensive risk analysis. It uses information on soil types from ZARC to develop basic best- and worst-case scenarios and calculate posterior distributions using insurance data. The resulting framework enables the comparison of municipalities, crop types, and overall risk classification. The study applies the framework to analyze the risk of soybeans, corn, wheat, and corn double-crop in Paraná State, resulting in consistent risk classifications across all crops and municipalities. The proposed framework has the potential to enhance agricultural risk management analysis for reinsurers, insurers, government agencies, and private companies. Future research could explore the use of this methodology to compare insurers, analyze risk in structured operations of credit and insurance, and evaluate risks at the farm level. This article presents a potential tool for improving risk analysis and decision-making in the agricultural sector.
Keywords:
crop risk-management; Bayesian Analysis; agricultural risk classification; adverse selection; beta distribution
Resumo
Resumo Este artigo propõe uma estrutura para integrar dados de zoneamento agrícola na análise de riscos de seguros. Baseia-se na combinação de informações públicas do programa brasileiro de zoneamento, o ZARC, com dados abertos de seguros fornecidos pelo Ministério da Agricultura e Pecuária. A metodologia apresentada transforma as informações do ZARC em dados de distribuição e as integra em um modelo Bayesiano juntamente com dados de indenizações de seguros, permitindo uma análise de risco abrangente. Utiliza informações sobre tipos de solo do ZARC para desenvolver cenários e calcular distribuições posteriores. A estrutura resultante possibilita a comparação entre municípios, tipos de culturas e classificação geral de risco. O estudo aplica a estrutura para analisar o risco de soja, milho, trigo e milho safrinha no Paraná, resultando em classificações de risco consistentes em todas as culturas e municípios. A estrutura proposta aprimora a análise de gestão de risco agrícola para resseguradoras, seguradoras, agências governamentais e empresas privadas. Pesquisas futuras poderiam explorar a metodologia para comparar seguradoras, analisar riscos em operações estruturadas de crédito e seguro, e avaliar riscos no nível das fazendas. O artigo apresenta uma ferramenta para melhorar a análise de risco e a tomada de decisões no setor agrícola.
Palavras-chave:
gestão de riscos rurais; Análise Bayesiana; classificação de risco agrícola; seleção adversa; distribuição beta
1. Introduction
Extreme weather is the primary cause of agricultural production loss, with drought, floods, and storms responsible for substantial global agricultural losses (Food and Agriculture Organization of the United Nations, 2021). Climate variation explains over 60% of yield variability globally (Ray et al., 2015). Agricultural risk management models, crucial for producers and governments, must evolve due to increasing climate variability (Wilson et al., 2022). Producers face heightened exposure to severe weather, necessitating improved risk mitigation programs. However, progress requires integrating databases for a comprehensive risk management strategy.
The Brazilian agricultural risk management strategy and its connections to the Climatic Risk Agricultural Zoning system (ZARC) remain underexplored in the literature. This paper introduces ZARC and proposes an empirical Bayesian approach to enhance its role in agricultural risk management in Brazil. The uniqueness of ZARC, as a risk management tool for producers and policymakers, is that it uses scientific support from several disciplines, including agricultural climatology, soil science, crop science, and agricultural engineering (Gonçalves & Wrege 2018, Cunha et al. 2001a). Most advanced contributions to ZARC depart from crop growth and decision-making models while relying on geographic and historical weather data and soil information (Pandolfo et al. 2021).
The technical literature supporting ZARC mostly comprises crop- and region-specific studies. For example, Cunha et al. (2001b) evaluated optimal sowing dates and production risk for wheat in Rio Grande do Sul, the southernmost Brazilian state. Bonatto et al. (2021) developed agricultural zones for gladiolus in Santa Catarina, while Uhlmann et al. (2020) focused on gladiolus production in Rio Grande do Sul. Brito et al. (2022) examined optimal sowing dates for corn in Northeast Brazil, a drought-prone region, and found adequate time windows for satisfactory crop development and production. Other contributions use similar methods for other crop-region combinations (Aparecido et al., 2019; Dominoni et al., 2021; Caldana et al., 2019). A different set of technical papers focuses on innovative crops and candidates to be incorporated into ZARC in future revisions (Yamada & Sentelhas, 2014). The supporting literature available is rather extensive, and the articles cited here exemplify the analytical steps taken by Embrapa to refine ZARC periodically.
Producers tend to adhere to ZARC to access crop insurance premium subsidies. Insurance companies, in turn, rate contracts more efficiently when producers adhere to ZARC because it reveals their behavior ex-ante signing the contracts. By engaging through ZARC and following planting recommendations, producers reveal critical information such as region-specific weather, soil, and cultivar information. The same feature is absent in numerous agricultural insurance programs worldwide. Contract rating procedures tend to use deterministic variables only, failing to incorporate weather, for example, a stochastic variable, in the computation of policy premiums (Liu & Ramsey, 2023). In the United States, the Federal Crop Insurance Program (FCIP) attempts to circumvent this limitation by employing weather data to adjust contact ratings ex-post computation (Rejesus et al., 2015). The authors demonstrate empirically that adding long-term temporal weather data improves rating estimations (Liu & Ramsey, 2023). Several articles have contributed to the literature in these veins (Tack & Ubilava, 2015; Rejesus et al., 2015; Zhu et al., 2019; Dalhaus et al., 2020; Yi et al., 2020), frequently demonstrating economic gains in employing historical weather data to estimate production risk and price contract premiums.
Soil and topographic information are rarely included in risk management appraisals despite extensive crop science literature emphasizing their impact on yield and farm revenue (Sene et al., 1985; Campbell et al., 1993; Kravchenko & Bullock, 2000; Cox et al., 2003; Nyiraneza et al., 2012). Recent studies argue for the inclusion of soil data in methods to predict yield loss, estimate guarantees, or rate premiums (Woodard & Verteramo-Chiu, 2017; Tsiboe & Tack, 2021), noting that the Federal Crop Insurance Program (FCIP) currently omits this information. This omission leads to significant rating errors by the U.S. Risk Management Agency (RMA), potentially contributing to low participation in the FCIP (Woodard & Verteramo-Chiu, 2017). Without soil data, risk heterogeneity across farms cannot be accurately estimated, leading to overpriced contracts as a precaution against risk and adverse selection (Tsiboe & Tack, 2021). Tsiboe & Tack (2021) propose integrating soil data into rating procedures, finding that it enhances RMA's ability to predict losses and price contracts more accurately, especially for farms with limited historical data.
There is currently no research connecting ZARC information to crop insurance claims, hindering its potential as a decision-support tool. This study aims to bridge this gap by proposing an empirical Bayesian method converging agroclimatic zoning and insurance claims data to refine crop insurance offerings. Drawing inspiration from Shi & Irwin (2005), our study transforms ZARC's projections into a prior distribution of production loss frequencies and updates it with insurance claims data. This aligns information within a unified framework, assessing deviations from ZARC's baseline. Focusing on Paraná State in Brazil, our model demonstrates how technical agricultural data enriches risk assessment for better risk procedures. The results, reported at the municipality level, showcase the model's superior predictability in various risk categories.
2. Theoretical Foundation
The accurate quantification of loss probability in agricultural insurance is crucial, requiring careful consideration of probability distributions. Studies highlight the impact of extreme value theory and the importance of distribution assumptions in pricing insurance, particularly in regions with skewed probability distributions, as well as the differences in premium rates for revenue versus yield insurance, influenced by price risk (see Ozaki et al., 2014; Brisolara & Ozaki, 2022).
In the context of insurance methodologies, Bayesian models offer a structured and rational approach to updating beliefs and predictions. The sample space Y is the set of all possible datasets from which a single dataset y will result. The parameter space Θ is the set of possible parameter values from which we hope to identify the value that best represents the true population characteristics. The idealized form of Bayesian learning begins with a numerical formulation of joint beliefs about y and θ, expressed in probability distributions over Y and Θ. For each numerical value θ ∈ Θ, our prior distribution p(θ) describes our belief that θ represents the true population characteristics. For each θ ∈ Θ and y ∈ Y, our sampling model p(y∣θ) describes our belief that y would be the outcome of our study if we knew θ to be true (Hoff, 2009).
The Bayesian approach has proven to be a robust methodology for risk analysis and pricing in agricultural insurance, particularly in contexts where data is limited or spatially correlated. Abbaspour (1994) proposed using Monte Carlo simulation to calculate the risk of a project based on uncertain variability of inputs, providing a solid foundation for decision-making under uncertainty in agricultural insurance. Complementarily, Ozaki (2009) applies Bayesian Hierarchical Models to price farm-level agricultural insurance, considering temporal effects and spatial dependencies, significantly improving premium rate estimation. These methods have been applied to data from Brazil and demonstrated that empirical insurance rates tend to be underestimated in high-risk areas and overestimated in low-risk areas, highlighting the importance of models that incorporate the dynamic structure of data and spatial correlations.
Additionally, the technique of Nonparametric Bayesian Models for agricultural insurance adjustment, as described by Liu & Ker (2020), allows for the incorporation of extrinsic information without rigid assumptions about the parametric form of the data. This approach has effectively improved premium estimates in small and medium sample scenarios. Park et al. (2019) expand this approach by using Bayesian Kriging for spatial smoothing in agricultural insurance pricing, demonstrating significant improvements in the accuracy of insurance policies, especially in regions with distinct spatial structures. The combination of these advanced methodologies stands out for its ability to integrate stochastic and spatial variables in risk analysis, offering a promising pathway for the evolution of agricultural insurance practices, particularly in the context of limited and heterogeneous data.
This Bayesian approach has been applied in agricultural insurance to incorporate historical weather data and estimate conditional yield and loss cost distributions, improving the accuracy of risk predictions and premium ratings (Liu & Ramsey, 2023). Ozaki & Silva (2009) use a hierarchical Bayesian framework to account for spatio-temporal relationships in yield estimation, revealing that insurers may underprice insurance contracts in high-risk areas while overpricing them in low-risk areas. In the Bayesian framework, “the probability of an event is given by the belief in how likely or unlikely the event is to occur. This belief may depend on quantitative and/or qualitative information, but it does not necessarily depend on the relative frequency of the event in a large number of future hypothetical experiments, a characteristic that has led some to comment that Bayesians do it with less frequency” (Judge et al., 1988).
Our contribution to the agricultural risk management literature is twofold. First, we converge the recent crop insurance literature and the agroclimatic zoning literature to explore synergies and demonstrate empirically how the latter may refine the former to better assess crop-specific and municipality-level risk. To the best of this article’s knowledge, this is the first scientific attempt to link agroclimatic zoning and crop insurance claims data to inform risk assessment procedures undertaken by insurers, reinsurers, and policymakers. We demonstrate how the complexity of an agroclimatic zoning system in systematizing weather, soil, and crop databases can be exploited further for risk analysis in crop insurance and credit. Second, we explore the possibilities of the Bayesian approach to propose a framework for risk categorization and classification of microregions (municipalities) or individual farmers.
A central task of this work was to harmonize the theoretical foundations of statistical disciplines, such as Bayesian Analysis and statistical distributions, with the technical assumptions used in risk management mechanisms in Brazil, such as agroclimatic zoning and agricultural insurance. This involved not only considering the appropriate mathematical apparatus but also systematizing the variables used in the empirical application of the Brazilian ZARC. To ensure a clearer and more objective presentation, these theoretical foundations and systematization efforts are directly integrated into the modeling, which is explained in the subsequent methodology section.
3. Methodology
ZARC reports the maximum frequencies of production loss organized in four risk classes for every possible 10-day sowing window for 43 cropping systems grown in three soil types. The information is updated yearly and becomes accessible to agricultural producers from all municipalities nationwide. The analytical steps within ZARC begin with combining crop information, soil characteristics, and weather data in an application of the Water Requirement Satisfaction Index (WRSI) procedure to compute the risk classes. Historic rainfall (R), temperature (C), and evapotranspiration (ET) are the primary data used for computing WRSI at every plant growth stage (i.e., sowing and emergence, vegetative growth, flowering and fruiting, and ripening). While R and C are direct readings from meteorological stations, ET is conditional on crop characteristics and soil type. The equation below summarizes WRSI as a function of R, C, and ET.
A total of 3,575 weather stations linked to a network managed by Embrapa are spread across the national territory and provide primary data for ZARC calculations. The meteorological series used for WRSI computations comprise 30 years of daily data on R and C and are updated annually. Critical WRSI thresholds are defined according to empirical and technical criteria for crops and soils.
With a series of WRSI estimates and critical thresholds at hand, simulations follow by varying sowing dates. An algorithm calculates the frequency of WRSI occurring under critical thresholds. Unfavorable events occur when the calculated WRSI falls below critical thresholds at some point during the crop cycle, temperatures reach 0ºC during the emergence stage (favorable to frost conditions), or rainfall exceeds expected averages during harvest windows. ZARC estimates probabilities as a sum of unfavorable events divided by the length of the crop cycle (coded as 10-day windows) and averaged across the 30-year historical series. These simulation-based computations are standard for all cropping systems and municipalities included in ZARC and can be summarized as follows:
where are probabilities simulated for three soil textures and by varying the 10-day period in which crops are sowed. Soil textures are assumed as proxies for soil types and defined as follows:
-
if clay content is higher than 10% and lower than 15%.
-
if clay content falls between 15% and 35%, and the content of sand is less than 70%.
-
if clay content is higher than 35%.
ZARC labels the risk classes using the upper threshold probabilities. The reported estimates are 20% for , 30% for , 40% for , and “-” when . In other words, ZARC makes it explicit for producers that sowing is not recommended in 10-day periods marked with a “-” sign. Sowing crops in all other 10-day periods suggests that production losses occur with maximum frequencies of 20%, 30%, or 40%. Recommendations of ZARC are summarized in tables as presented in the matrix below:
Subscript represents a given municipality, and denotes a crop-specific characteristic such as maturation group. The matrix reports frequencies of loss with set for municipality and maturation group , and set . Table 1 below offers an example of ZARC’s outcomes.
Example of ZARC recommendation for sowing soybeans in the municipality of Castro in the State of Paraná.
It is worth noting that ZARC’s predictions are the frequency of production losses and do not capture the severity of occurrences. To obtain premium subsidies through PSR, complying growers sow crops in windows reported with 20, 30, or 40% maximum loss frequency.
To assess the risk of crop insurance, we utilize the ZARC's predicted loss frequencies and sowing recommendations for four major crops, namely soybeans, corn, corn double-crop, and wheat, over a five-season period spanning from 2017/18 to 2021/2022.
This approach aligns with the timeframe adopted by insurers in their market projections, allowing us to comprehensively evaluate the performance of the insurance policy. Our findings provide valuable insights into the crop insurance market and can guide policymakers and stakeholders in enhancing the policies to better meet the needs of farmers and mitigate the risks associated with crop production in Paraná, Brazil. We take ZARC’s reported frequencies ( for four cropping systems cultivated in 399 municipalities. The choice of these data is justified by the significant role of Paraná State in Brazil's agribusiness sector and the widespread participation of producers in the crop insurance market. To ensure a robust analysis, we analyzed a time series of five years of insurance data for each of these five seasons. This approach aligns with the timeframe used by insurers in their market evaluation.
We manipulate ZARC’s reported estimates ( to build a prior distribution of production losses. Three steps describe the process of transforming ZARC data.
-
We convert the maximum frequencies into expected loss frequencies. Simple transformation leads us to taking values contained in set , where .
-
To match the plausible assumption that producers will concentrate sowing activities in time windows with low frequencies of production loss, we use planting progress estimates published seasonally by the Secretary of Agriculture (Secretaria Estadual de Agricultura e Abastecimento, 2022 - in Portuguese). We multiply the transformed loss frequencies by the area sowed in municipality in 10-day window to arrive at the weighted frequency of loss. Let denote the area rate sowed in 10-day window , extracted from planting progress estimates. While the weighted frequencies of production loss may be interpreted as a variable , with , the sum of over all possible sowing windows leads to , an adequate representation of the expected production loss frequency for maturation group cultivated in soil type in municipality coming from ZARC. In summary:
-
When we multiply the resulting term by the number of 10-day periods () with positive sowing recommendations, we arrive at the estimated number of events with production loss over all possible sowing windows . In mathematical notation, the expected number of crop production attempts with loss and the expected number of successful production attempts (without loss) become:
Estimates and were normalized on a percentage basis to ensure the distribution follows the same proportions utilized in ZARC. The estimates as well as the natural bounded behavior of , with , become convenient parameters for studying the frequency of production losses through the lenses of the finance and insurance literature. We employ and as parameters for fitting a beta distribution, commonly used for modeling insurance loss. The beta distribution has the advantage of being flexible and assuming several shapes as and vary. Further details on the application of beta distributions to model crop production risk (Ozaki et al., 2011) and a theoretical treatment for modeling the probability of occurrences (Casella & Berger, 1990) are available in the literature. In our application, if then the probability of a given production attempt to experience loss follows the probability density function:
where, refers to the probability density function of loss frequencies derived from ZARC. In our application, for example, means that half of the production attempts are likely to experience a loss every ten crop years.
Depending on the analytical goals or granularity of interest, analysts conducting research for insurance companies or policymakers may apply steps 1 through 3 and aggregate or disaggregate results as needed. Parameters and can be calculated for state average by summing estimates over all municipalities and dividing by the number of municipalities M. Equations E8 and E9 summarize the aggregation procedure.
The same aggregation step is possible over maturation groups or soil types . For the purposes of this application, we aggregate and over maturation groups and soil types, leading to and . Specific characteristics such as maturation groups and soil types are also absent in insurance contracts, so aggregating over these parameters does not compromise the effort of combining agricultural zoning loss projections and insurance claims data.
The beta distribution derived from ZARC’s loss projections becomes the prior for improving the predictability power of production losses. We employ the Bayesian updating method to combine historical data of crop insurance claims and obtain a posterior distribution with a refined capability to predict the frequency of crop losses.
Historical data on insurance contracts with subsidized premiums is publicly available through the “open data” (“dados abertos”) platform maintained by the federal government of Brazil. Data on individual policies are available from 2006. In this article, we retrieved data for individual insurance contracts issued for soybean, corn, corn double-crop, and wheat grown in all Paraná municipalities during the seasons spanning from 2012/13 to 2021/22. The dataset consists of 21 variables for all 27 States of Brazil. We focused on a subset of five variables: municipalities, crop, value of indemnity, and year of the policy. We then compiled a dataset specifically for Paraná, which included 348,343 rows, with 154,384 for soybean, 26,206 for corn, 112,269 for double-cropped corn, and 55,484 for wheat.
The variable reporting indemnity amounts is of central interest. Of all policies in the dataset, 56,650 resulted in indemnities, totaling R$2.8 billion over the selected time span. When indemnity payment is greater than zero for a given contract, we let it take the value of 1 and 0 otherwise. Let denote the number of indemnity payment occurrences across all insurance contracts issued for the crop of interest in municipality , such that . Considering the origin of the dataset and the institutional mechanisms in place to monitor and verify crop production loss, one may plausibly infer that the occurrence of indemnity payments is conditional on the occurrence of loss. Therefore, the probability of conditional on the occurrence of production loss, follows a binomial distribution with parameters c and . In mathematical notation:
While the conditional probability of indemnity payments holds for all crops of interest in all municipalities , the aggregation argument presented above is also applicable. Analysts and policymakers may find useful examining the conditional probability of indemnities at the State level, for example.
Knowing that the prior distribution of production loss frequencies derived from ZARC has a beta () distribution and the transformed data on the occurrence of indemnity payments gives origin to a conditional probability that follows a binomial distribution (), we can apply the Bayesian updating method to obtain the posterior predictive distribution for production losses. The posterior distribution computation follows the procedure demonstrated by Hoff (2009, pp. 35-38):
The beta posterior distribution becomes a combination of the prior and the transformed insurance claims data with easily recognized raw moments:
Empirical calculations were conducted in a Microsoft Excel spreadsheet. We built a system of equations to simulate alternative scenarios for varying crops and municipalities. A classification criterion was developed to validate our methodology and compare the predictability power of the posterior distribution against production loss frequencies derived from the agricultural zoning system ZARC.
While the resulting posterior distribution utilized a beta prior with aggregated parameters over crop-specific characteristics and soil types, our empirical comparative assessment requires the preparation of two additional beta prior distributions. The first followed the procedural steps 1 through 3 listed above but maintained sandy soils for soil type instead of aggregating over the parameter. The second beta prior distribution used clay soils for soil type.
We assume the sandy-soil beta distribution represents the worst-case production scenario for grains in Paraná, whereas the clay-soil beta distribution corresponds to the best-case scenario. The underlying reasons for this assumption are twofold. First, clay and sandy soils are in the two extremes of a water-holding capacity continuum, where clay soils retain more water and meet crop water requirements longer than sandy soils. Thus, one may plausibly argue that clay soils tend to reduce crop exposure to drought stress compared to sandy soils. Second, a careful examination of Table 1 suggests that soil type 3 (clay) decreases the expectation of production losses consistently regardless of the maturation group. It also extends sowing windows compared to sandy soils. These are common trends for all municipalities or crops considered in this work. In fact, the reasons provided for the determination of risk boundaries as a function of soil types converge as WRSI computations lead to ZARC risk classes () and rely on the technical characteristics of soils and crops.
The classification criteria comprise three broad categories and seven sub-categories based on the direct comparison of expected values and distributions for the best-case production scenario (with and ), the worst-case production scenario (with and ) and the posterior (with and ) (Figure 1). The three broad risk categories are:
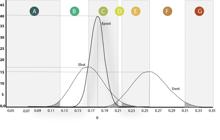
Classification criteria based on the position of the posterior, best-case scenario, and worst-case scenario distributions. Source: Prepared by the authors.
-
When If lays to the left of the 47.5% tail of the best-case scenario, we attributed class “A”. If falls inside of the 47.5% left tail of best-case production scenario, we attribute class “B”.
-
When If falls within the right 47.5%-tail of best-case distribution and to the left of the 47.5%-tail of the worst-case distribution, we classify as “C. If is within in both tails, we classify as “D”. If lays within the left 47.5%-tail of the worst-case distribution but not in the right 47,5%-tail of best-case distribution, we classify as “E”.
-
When If falls within the right 47.5%-tail of worst-case production scenario distribution, we classify it as “F”, and “G” otherwise.
Every municipality followed this classification for all four crops of interest and five 5-year ranges, as presented in the results. We omitted municipalities with less than 50 insurance contracts from the comparative analyses.1
4. Results and discussion
First, we report results on the state-level aggregated results to demonstrate the use of our analytical framework and provide an overview of crop-specific production risk at the macroregional level. The analysis for the 399 municipalities follows and details the intuitions drawn from the state-level results.
Table 2 presents basic descriptive statistics for the total number of policies and policies with losses in five-year periods. Soybean dominates in the number of policies and production area with corn double-crop ranking second, followed by wheat. Production loss data indicate higher probabilities for winter crops (corn double-crop and wheat) than soybean and corn. Approximately 20% of insurance contracts for corn double-crop and wheat incur losses, while soybean and corn experience losses in about 10% and 4% of cases, respectively.
Total number of policies, policies with loss, and loss rates for the crops of interest per period of analysis
Notably, the last 5-year period saw a high loss rate for all crops, particularly for corn double-crop. Contracts for all crops were executed more frequently in this period than in the previous quinquennials. Over 40% of contracts for corn double-crop were executed due to losses, primarily associated with the La Niña phenomenon in the 2021/2022 season, causing droughts in Southern Brazil and Argentina (Grimm, 2004; Heinemann et al., 2021). La Niña is recognized as one of the El Niño Southern Oscillation (ENSO) phases, resulting from unusual water temperature changes in the Central and Eastern Tropical Pacific Oceans (National Oceanic and Atmospheric Administration, 2023). The detailed statistics for the crops of interest per analysis period are provided in Table 2.
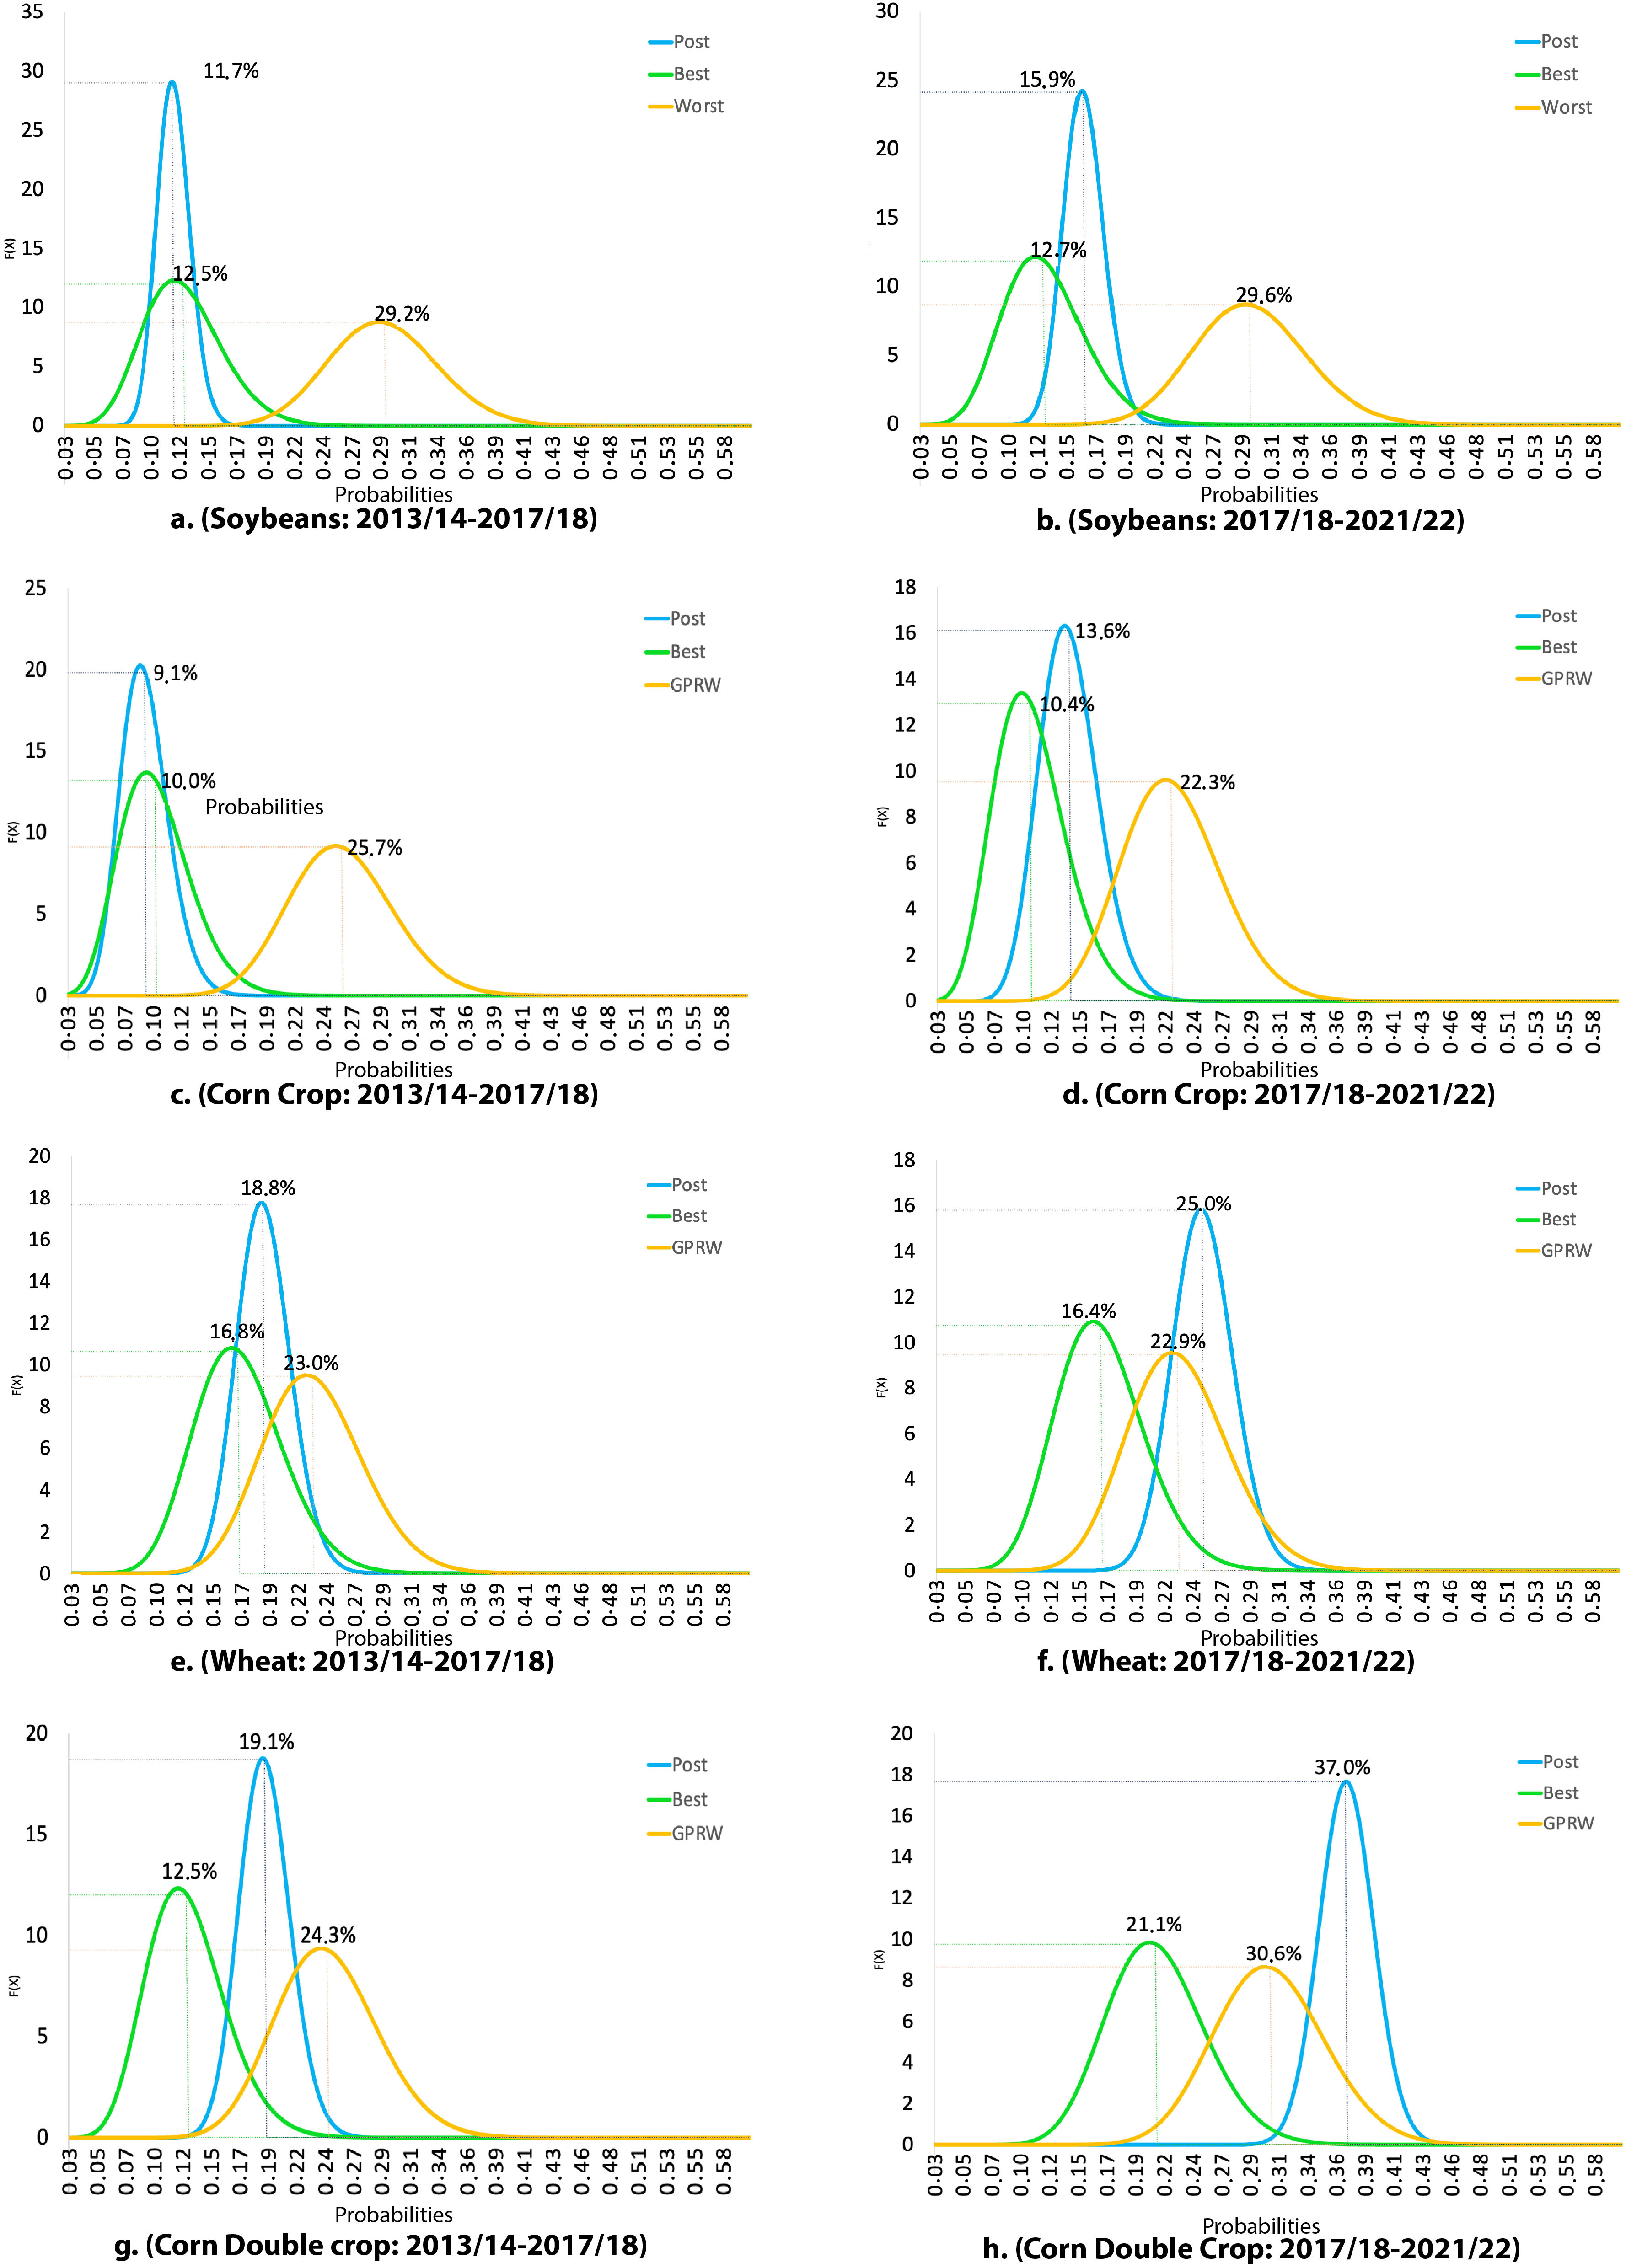
Figure 2 illustrates the proposed methodology and presents state-level analysis results, showing posterior, best-case, and worst-case scenario distributions for each crop in two 5-year periods. Visually, the fifth period shifted all posterior distributions to the right, aligning expected losses for summer crops with ZARC's predictions only in that period. For winter crops, expected losses moved outside ZARC's inner range in the last quinquennial. While the analysis suggests ZARC may overestimate losses for summer crops in neutral years and underestimate losses for winter crops in unfavorable seasons, municipality-specific observations may differ.

Risk comparison using the posterior distribution versus the best-case scenario and the worst-case scenario distributions for four crops and two 5-year periods. Source: Prepared by the authors.
The expected risk level for summer crops (soybean and corn) tends to be lower than ZARC's best-case scenarios in most 5-year periods, except for the fifth period (2017/18 to 2021/2022) influenced by La Niña. In neutral weather seasons, the predictive distribution from insurance data and ZARC leads to lower production risk expectations than ZARC predicts. However, in challenging years, especially during La Niña, the expected probabilities of losses align with ZARC's predictions.
Expected losses for winter crops (wheat and corn double-crop) derived from posterior distributions align more closely with ZARC's predictions. In neutral weather years, loss frequencies from the combination of insurance data and zoning information fall within ZARC's predictions. Under unfavorable conditions, insurance policies tend to yield higher expected loss probabilities than ZARC's baseline. This is observed in the 5-year period 2017/18 to 2021/22.
The municipality analysis yielded 2,904 comparative cases (municipalities with data on crops × four crops × five 5-year periods). While it is impractical to report all results, we provide a summary and an extract for the municipality of Maringá as an example, reinforcing the model's applicability with microregional data. Table 3 outlines municipality counts per risk category, showing that most summer crop-producing municipalities fall in categories “B” or “C.” Notably, the last corn quinquennial saw increased risk, with more municipalities in categories “D” and “E.” Some soybean and corn-producing municipalities exhibit considerably less risk than the state average, supporting the argument that ZARC overestimates losses for summer crops.
For winter crops, risk categories are more dispersed. Over 37% of wheat-growing municipalities are in category “B” initially, shifting to “D” in later periods. La Niña led to more “G” municipalities in the last 5-year period. Similar observations apply to corn double-crop. The dispersion underscores the need for regional granularity. Although wheat was generally in category “C” at the state-level analysis, the municipality-specific analysis reveals variations from the state average, with some showing less risk (category B) and others more risk (categories “F” or “G”).
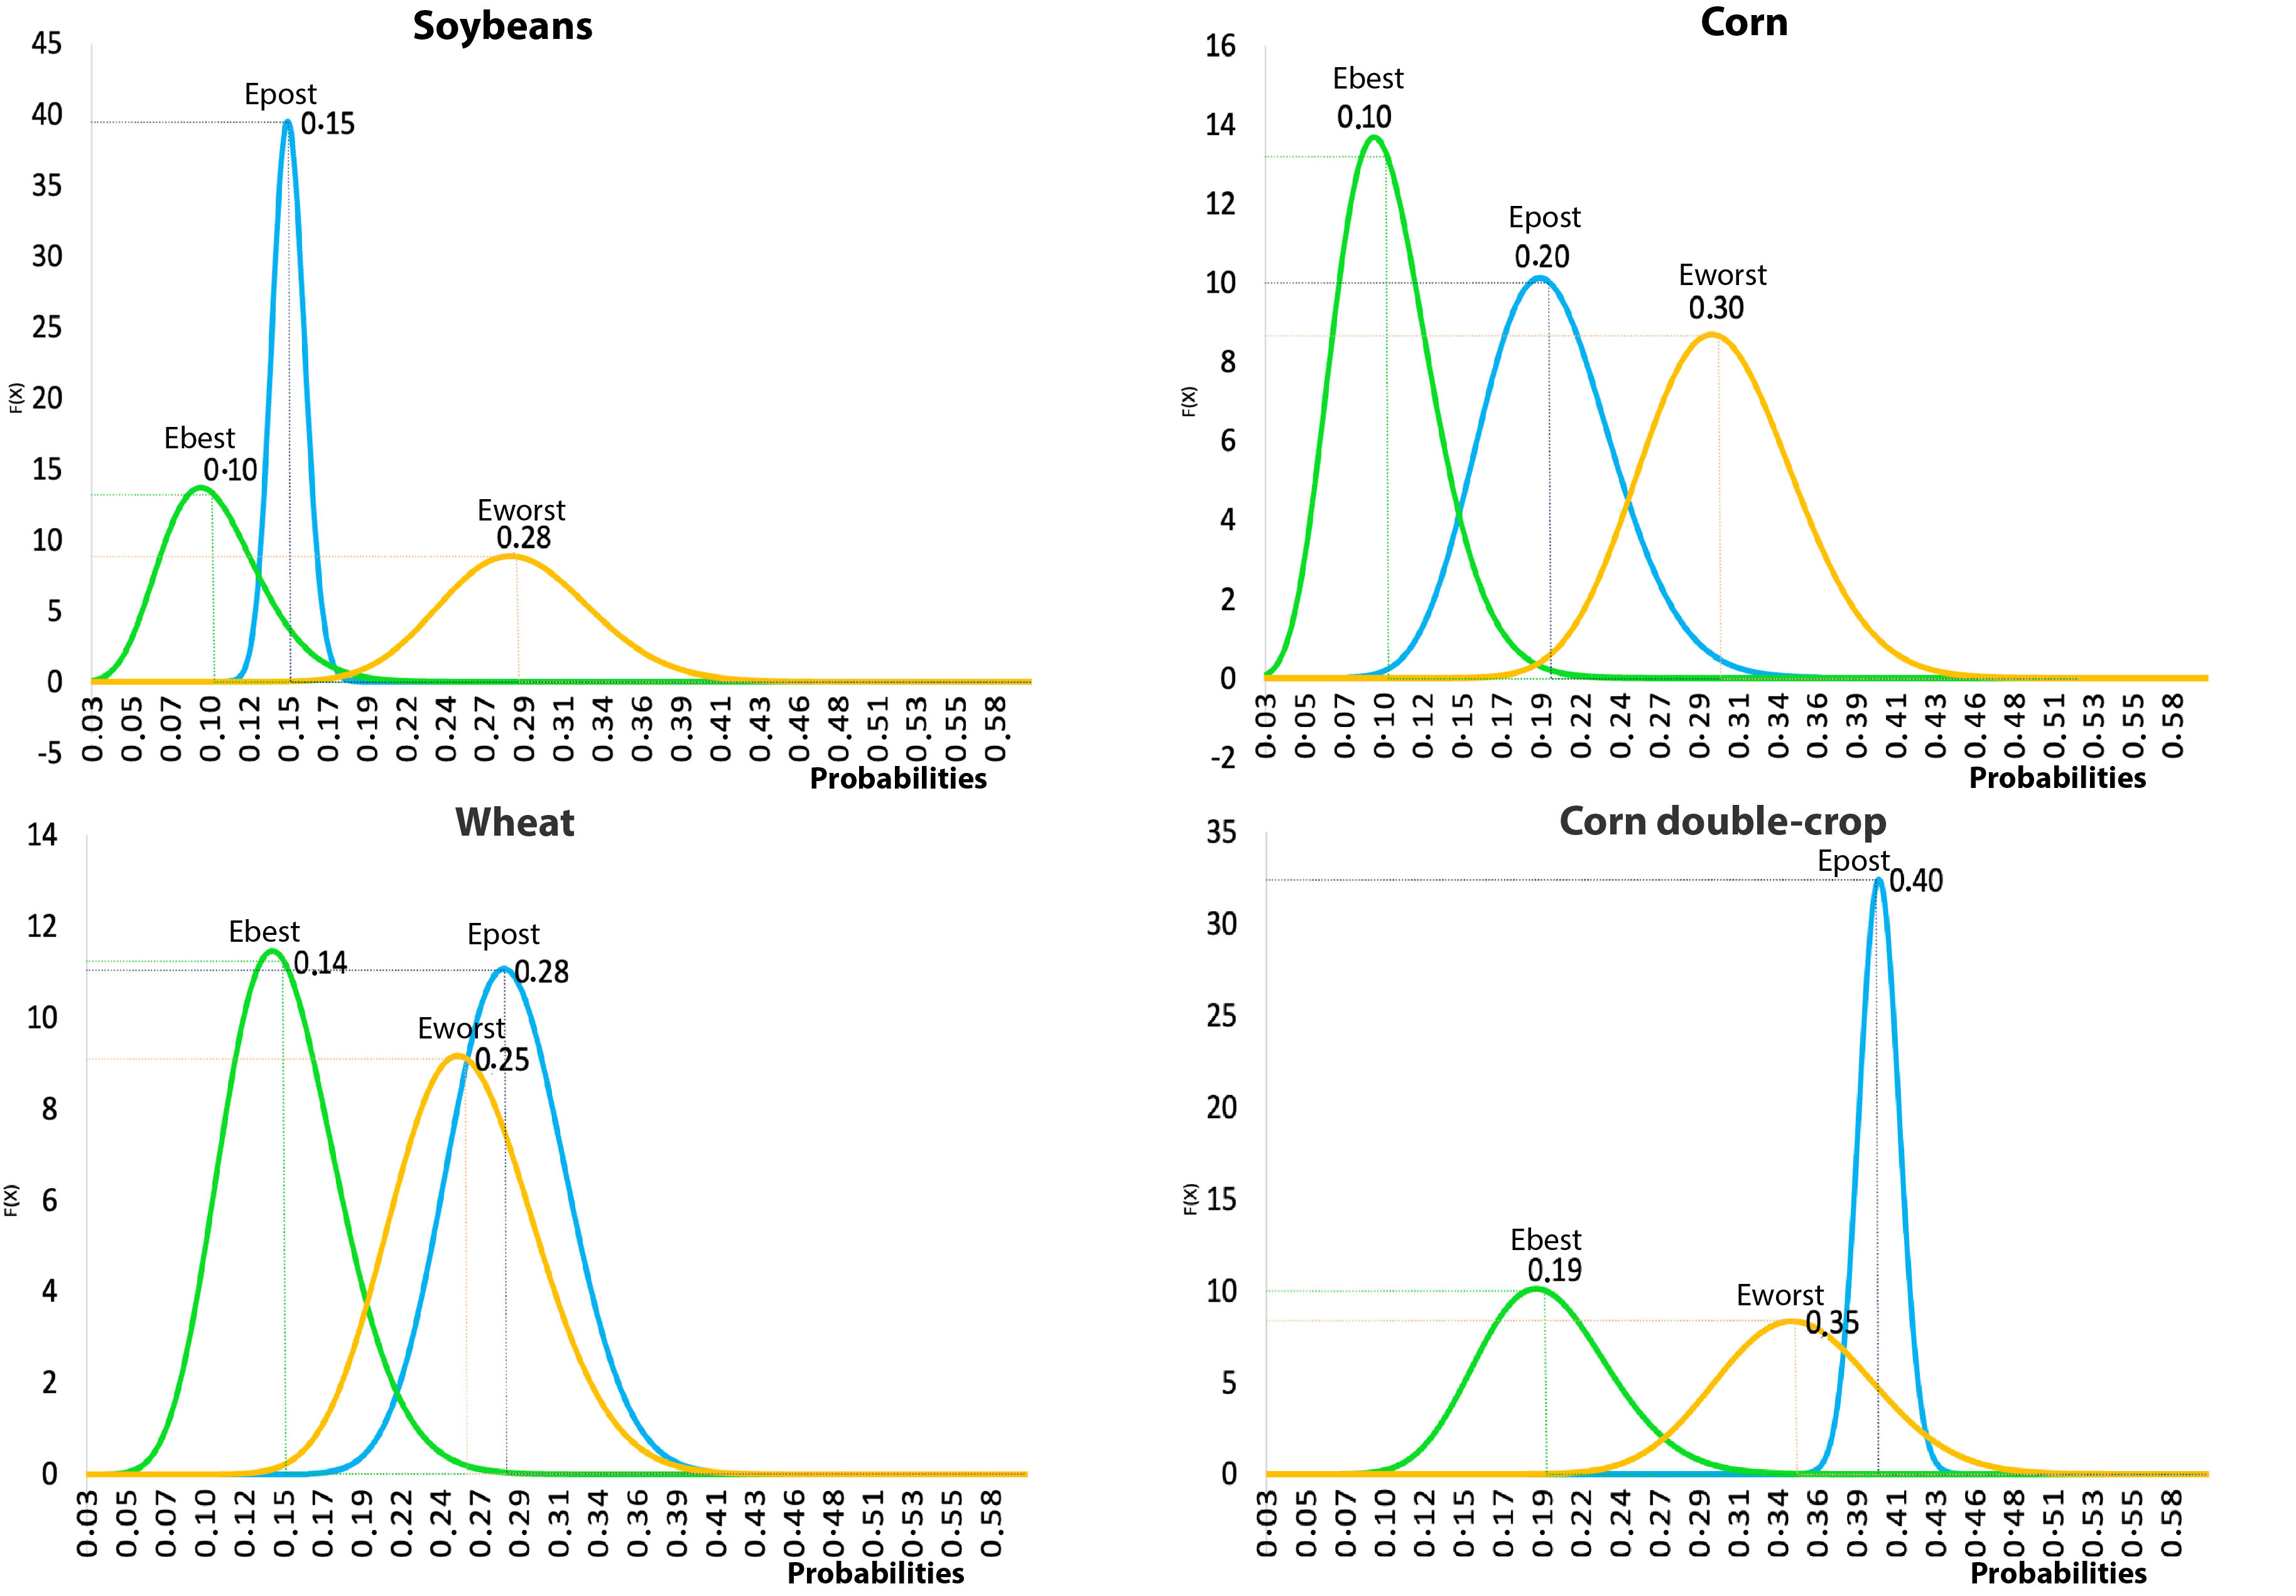
Figure 3 illustrates the posterior distributions of production losses for Maringá in the 2017/18 to 2021/22 period. Soybeans (15% expected losses), corn (20%), wheat (28%), and corn double-crop (40%) demonstrate varying risk levels. We can classify the distributions using the same classes from A to G described in Figure 1. For Maringá, soybeans are in category “C,” corn in “D,” while wheat and corn double-crop are in category “F.” Results confirm lower risk for summer crops than winter crops in Maringá.
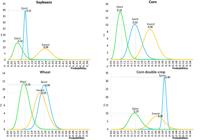
Risk comparison for Maringá using the posterior distribution versus the best-case scenario and worst-case scenario distributions for four crops between 2017/18 and 2021/22. Source: Prepared by the authors
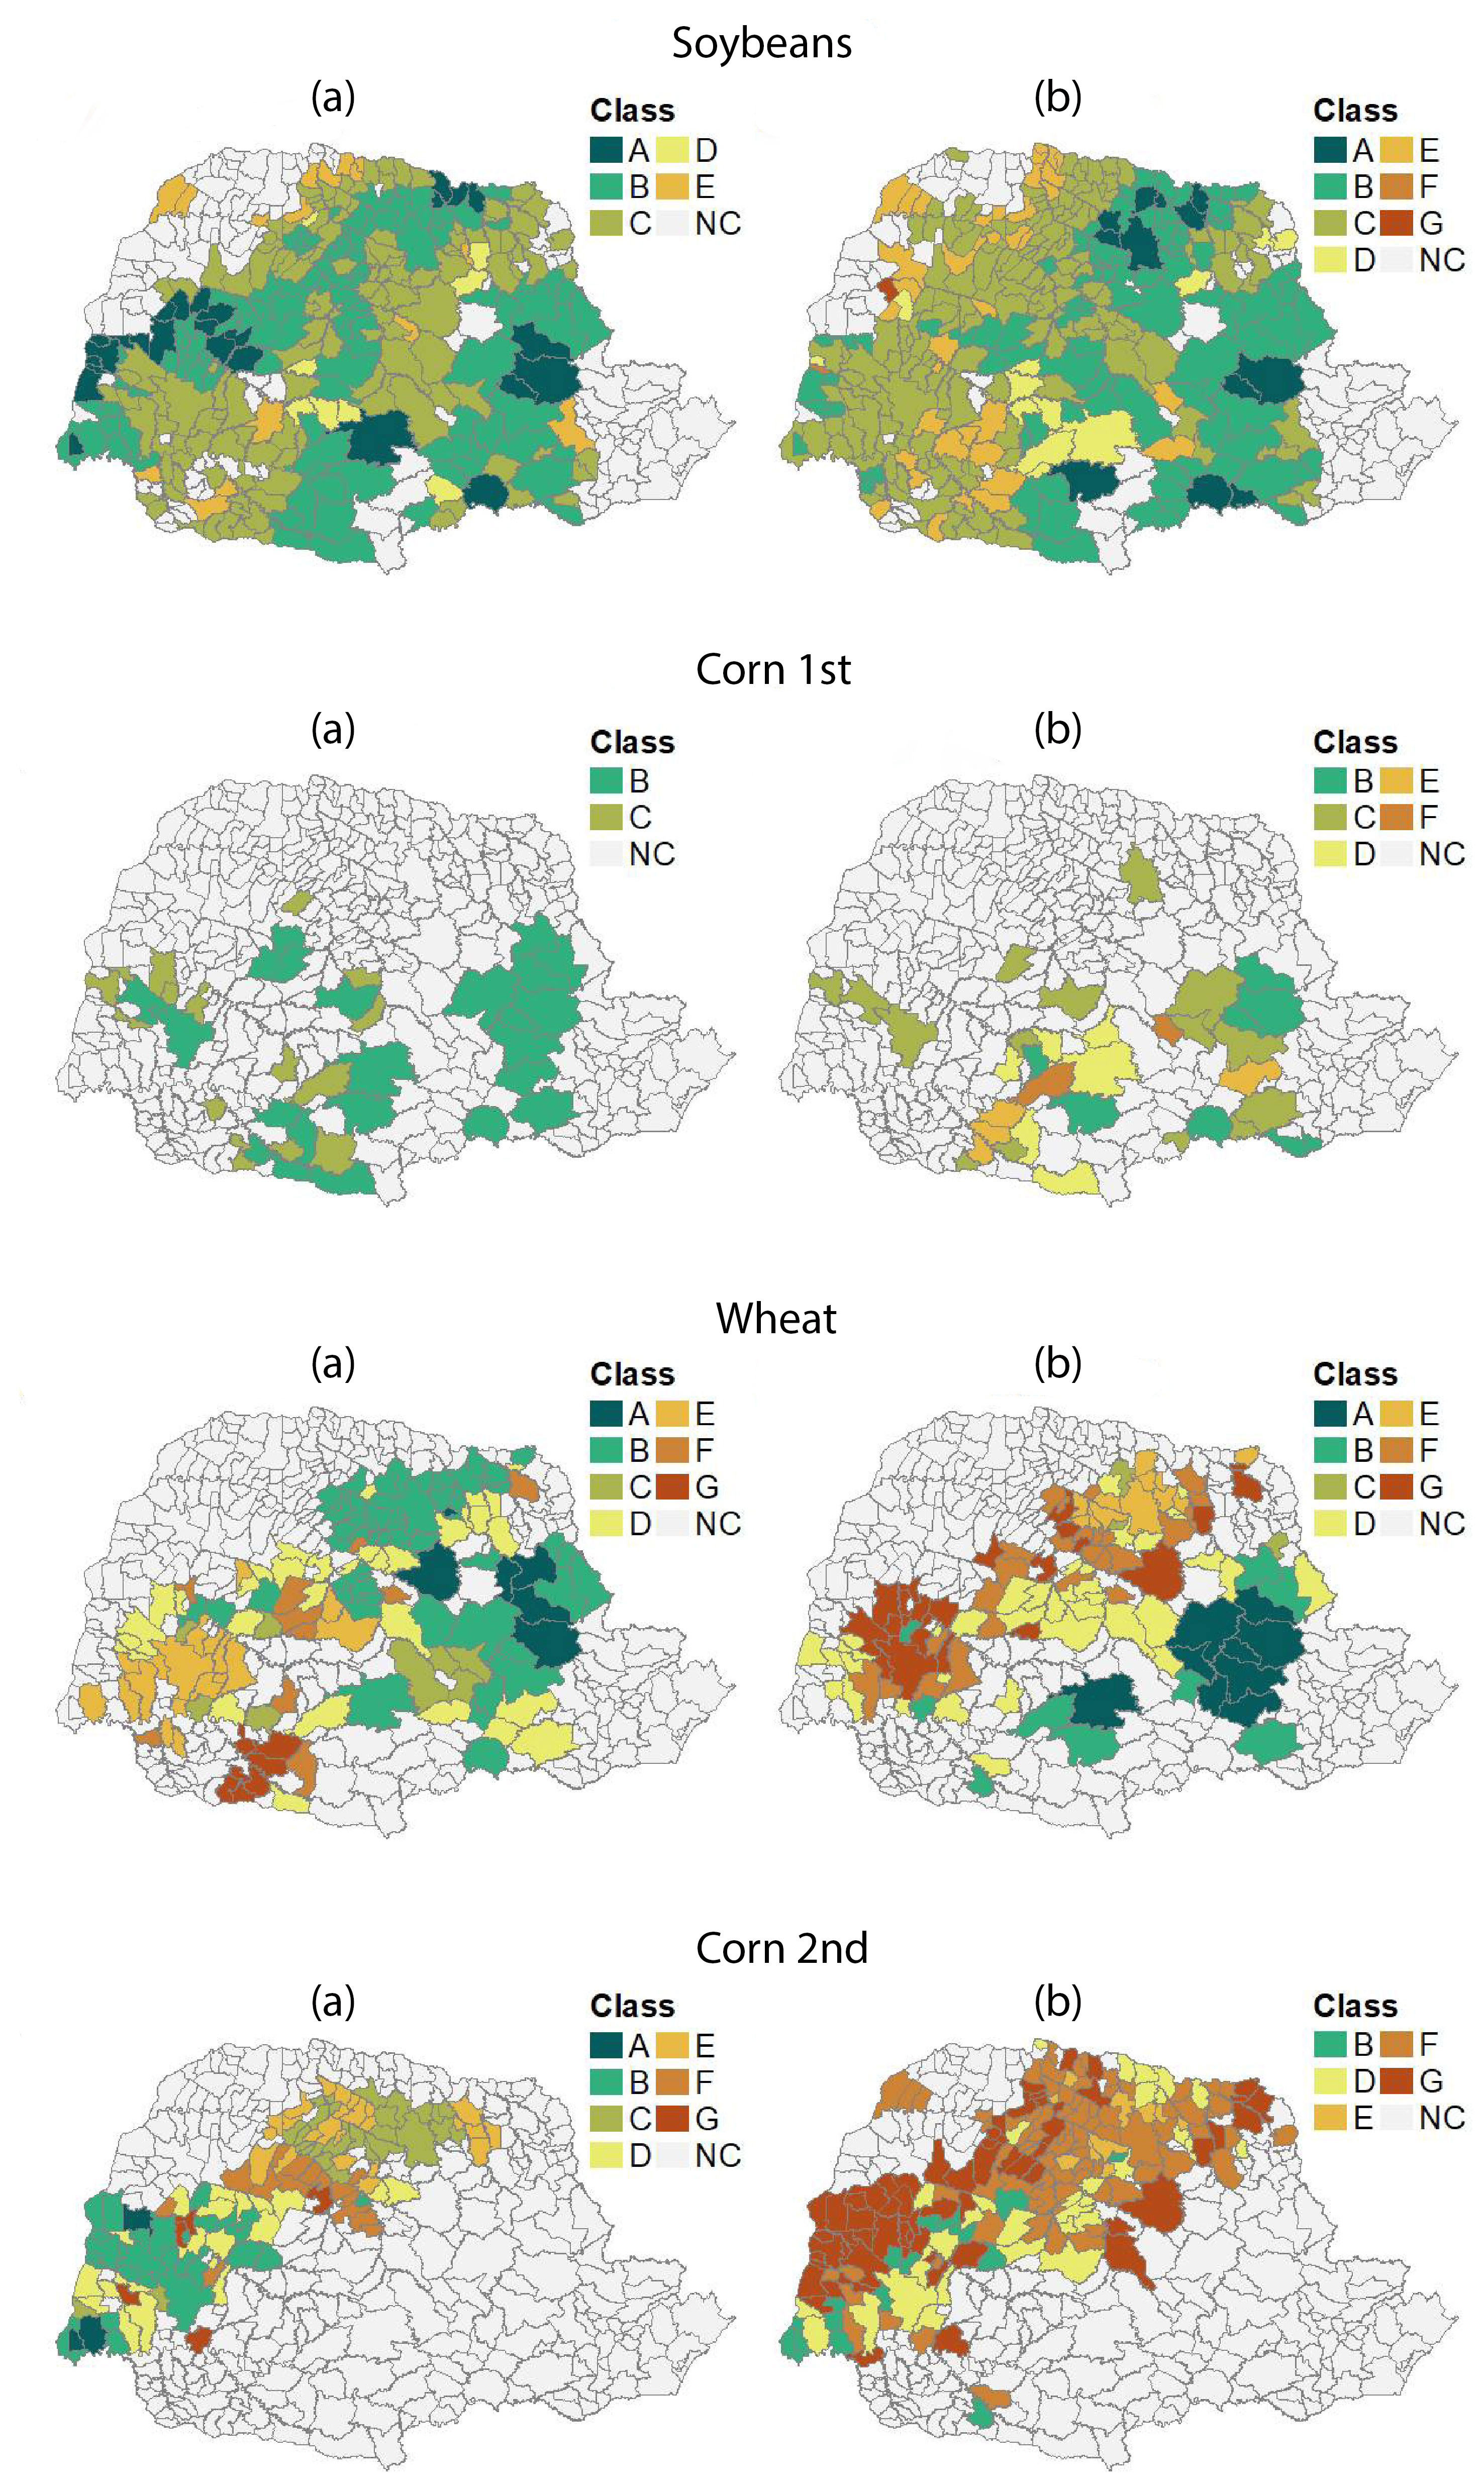
Figure 4 below plots a map of Paraná municipalities taking the computed risk categories in two 5-year periods. Municipalities are color-coded to represent the risk categories calculated for the first and last 5-year periods analyzed, from 2013/14 to 2017/18 and from 2017/18 to 2021/22, respectively. A visual evaluation allows one to notice changes in risk over time and regions. A significant increase in the production risk of soybeans takes place in the West side of the state from the first to the last 5-year period analyzed. Setting aside the argument regarding the predictability power of ZARC, our methodology assists practitioners in visually recognizing that Western municipalities are more prone to experience losses in soybean operations compared to Eastern municipalities when unfavorable weather occurs. Despite the dispersion of municipalities across risk categories, one may also note that a set of Central-East municipalities experience little to no change in wheat production risk. Corn double-crop is highly prone to experience production losses when weather conditions worsen, regardless of the location.
Figure 4: Color-coded municipalities according to risk categories (codes A to G, follow classification in Figure 1) in two 5-year periods (a = 2013/14 to 2017/18 and b = 2017/18 to 2018/2022). Source: Prepared by the authors
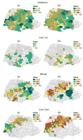
: Color-coded municipalities according to risk categories (codes A to G, follow classification in Figure 1) in two 5-year periods (a = 2013/14 to 2017/18 and b = 2017/18 to 2018/2022). Source: Prepared by the authors
5. Conclusions
Our study has demonstrated that climatic zoning data can be effectively integrated into an analytical framework along with insurance data to create a flexible risk assessment tool. This proof of concept has the potential to offer a powerful risk analysis tool for specific crops at both macro and micro levels, ranging from states, municipalities, and even individual operations. This framework is appealing because the data used is publicly available and updated annually. While the ZARC information has been successfully applied as an agricultural zoning reference, no additional tools have been developed in the literature for further risk assessment using the extensive set of information available. Our research addresses this gap and provides a feasible solution.
The proposed methodology builds on the research of Woodard & Verteramo-Chiu (2017), who found that soil information could be a valuable parameter for determining insurance rates in the United States. It is important to note that in the United States, the government determines crop insurance prices, whereas in Brazil, private companies playing in the insurance market set the rates. Soil type is a criterion for risk selection of insurers in Brazil, and some companies choose not to offer policies for crops grown in sandy soils. This article’s framework shows how insurers can better ascribe risk levels at the municipality level by considering soil type data coming from the agricultural zoning system, ZARC. When soil type is observed for a specific operation, insurers may employ a refined version of our framework to compare expected losses from the posterior distribution versus the municipality-level loss expectation for the soil type of interest.
Results show that the proposed analytical framework is better equipped to study expected losses of the insurance market in soybean and corn crops than the agricultural zoning system alone. In general terms, ZARC tends to overestimate the probabilities of production losses compared to our model for most locations. Production risk tends to be more dispersed for wheat and corn double-crop, leading analysts to recognize the importance of refining data granularity whenever possible. Municipality-level results overcome generalizations derived from the state-level analysis, which could lead to misinterpretations in risk assessment efforts and underwriting. Finally, our model captures the risk increase far better than ZARC does when unfavorable weather occurs. This was demonstrated by the right shift of expected losses for all crops analyzed in the last 5-year period, heavily marked by droughts caused by the La Niña phenomenon, compared to the other periods. This result complements the research efforts of Yi et al. (2020) and Tack & Ubilava (2015).
This article has yielded other important conclusions regarding research methods. Specifically, the combination of ZARC's recommended sowing windows with insurance data distributions proved to be effective in providing useful information. However, it is necessary to have a clear understanding of the methods' potential, considering the amount and quality of the information available.
Firstly, it should be noted that the Bayesian approach is often based on beliefs surrounding the probabilities of a certain phenomenon. Theoretically, these beliefs can be subjectively extracted from evaluations of experts, for example, as proposed by Shi & Irwin (2005). By choosing an appropriate model, these beliefs can be updated with new data to produce better estimates. Our application of the Bayesian approach is slightly different. We depart from a set of information from the agricultural zoning system ZARC, which cannot be considered a vague set of beliefs about the frequency of crop losses. As previously explained, this information is derived from a robust computational process that includes georeferenced soil data and long-term weather data. Therefore, ZARC’s information provides a robust starting point by itself, and not initial beliefs or empirical experience that necessarily require updates to generate informed estimates.
Secondly, it is important to properly interpret the meaning of data or belief updating. Farmers make the choice to purchase crop insurance based on their beliefs about their intrinsic risk. Insurance companies choose to sell policies based on their beliefs about the risk of loss in different marketplaces where they operate independently. Even if we assume that insurance companies perfectly assess risk and price policies (which is unlikely), other factors, such as the opportunistic behavior of agents or extreme weather oscillations, could cause discrepancies between expected and realized risks. This may represent a process of adverse selection, as explained by Akerlof (1970). In summary, the combination of insurance data with ZARC's recommendations can be considered a numeric expression of adverse selection in the insurance market if ZARC is assumed as a baseline.
We used the recommendations of sowing windows for soil types to identify risk boundaries for risk analysis in this study. The approach to simulate risk evaluations was based on theoretical assumptions regarding a weighted average distribution of best and worst scenarios. The resulting risk expectations from the scenarios were in line with field expectations for the types of crops and regions. Future studies or practical applications may consider specific soil data from individual policies, allowing for a more specific risk assessment.
The article highlights two important practical implications for policymaking that deserve final remarks. Firstly, winter crops are highly risky activities, as demonstrated by the results presented for wheat and corn double-crop. To mitigate this risk, analysts could consider being more rigorous in allowing for sowing windows or even ruling some municipalities out of zoning recommendations. Secondly, the historical analysis shows that the risk of crop insurance contracts can be significantly aggravated within a determined time horizon, as seen with soybeans and corn double-crop for the period between 2017/18 and 2021/22 compared to previous periods. In cases where losses are disproportionate, an extended protection level may be put in place to provide compensation and protect the crop insurance chain. The methodology presented in this article initiates a conversation to determine situations where losses much above expectations occur, which may lead to the creation of a crop disaster management program.
Currently, the Brazilian Agricultural Research Corporation (Embrapa) is in the process of validating new ZARC recommendation procedures based on the concept of “available water capacity”. This methodology involves prescribing sowing windows based on six water availability thresholds, which are determined by analyzing the soil of individual producers. If this approach is approved, it will be possible to calculate individual risk indexes using the analytical framework outlined in this paper. This would represent a significant advancement in understanding the complex relationships that exist at the farm level and how they respond to idiosyncratic shocks, as described by Miranda & Glauber (1997).
The methodology proposed in this paper could also be used as an alternative to risk pooling methodologies of municipalities using ZARC risk ascription, overcoming the problem of missing data explored in other papers. The methodology provides a powerful tool for insurers and reinsurers, particularly in a country like Brazil, where crop insurance is operated by private agents. The decision of which markets to focus on is crucial to distribute risks along the market. For reinsurers interested in knowing how insurers perform and if they are appropriately distributing adverse selection throughout the market, available data can be used to provide a detailed analysis of insurers according to their performance on the market. Future research could explore this application further.
-
1
Although small sample sizes could generate posterior distributions, the resulting distribution would be dominated by the information contained in the priors, adding little value to the comparative analysis. From a technical standpoint, nevertheless, the resulting distribution could still be used as a reference for risk assessment.
-
How to cite: Martins, G., & Signorini, G. (2025). Enhancing crop insurance analysis with agricultural zoning data. Revista de Economia e Sociologia Rural, 63, e284274. https://doi.org/10.1590/1806-9479.2025.284274
-
JEL Classification: G22.
6. References
-
Abbaspour, K. C. (1994). Bayesian risk methodology for crop insurance decisions. Agricultural and Forest Meteorology, 71(3–4), 297-314. http://dx.doi.org/10.1016/0168-1923(94)90017-5
» http://dx.doi.org/10.1016/0168-1923(94)90017-5 -
Akerlof, G. A. (1970). The Market for “Lemons”: Quality Uncertainty and the Market Mechanism. The Quarterly Journal of Economics, 84(3), 488-500. http://dx.doi.org/10.2307/1879431
» http://dx.doi.org/10.2307/1879431 -
Aparecido, L. E. O., Batista, R. M., Moraes, J. R. S. C., Costa, C. T. S., & Moraes-Oliveira, A. F. (2019). Agricultural zoning of climate risk for Physalis peruviana cultivation in Southeastern Brazil. Pesquisa Agropecuária Brasileira, 54 https://doi.org/10.1590/S1678-3921.pab2019.v54.00057
» https://doi.org/10.1590/S1678-3921.pab2019.v54.00057 -
Bonatto, M. I., Bosco, L. C., Pandolfo, C., Ricce, W. da S., Stanck, L. T., de Souza, A. G., Rossato, O. B., & Streck, N. A. (2021). Agricultural climate risk zoning for gladiolus in santa catarina. Revista Brasileira De Climatologia, 28, 619-633. Retrieved in 2024, March 7, from https://ojs.ufgd.edu.br/index.php/rbclima/article/view/14771
» https://ojs.ufgd.edu.br/index.php/rbclima/article/view/14771 -
Brisolara, C. S., & Ozaki, V. A. (2022). Uma proposição metodológica para a precificação de seguro de receita agrícola no Brasil. Revista de Economia e Sociologia Rural, 60(2), e235656. http://dx.doi.org/10.1590/1806-9479.2021.235656
» http://dx.doi.org/10.1590/1806-9479.2021.235656 -
Brito, J. E. D., Santos, M. A., Lyra, G. B., Ferreira Júnior, R. A., & Souza, J. L. (2022). Maize sowing dates in the hinterland region of Northeast Brazil. Agrometeoros, 30, e026954. http://dx.doi.org/10.31062/agrom.v30.e026954
» http://dx.doi.org/10.31062/agrom.v30.e026954 -
Caldana, N. F. S., Nitsche, P. R., Martelocio, A. C., Rudke, A. P., Zaro, G. C., Ferreira, L. G. B., Zaccheo, P. V. C., Carvalho, S. L. C., & Martins, J. A. (2019). Agroclimatic Risk Zoning of Avocado (Persea americana) in the Hydrographic Basin of Paraná River III, Brazil. Agriculture, 9(12), 263. http://dx.doi.org/10.3390/agriculture9120263
» http://dx.doi.org/10.3390/agriculture9120263 -
Campbell, C. A., Selles, F., Zentner, R. P., & McConkey, B. G. (1993). Available water and nitrogen effects on yield components and grain nitrogen of zero-till spring wheat. Agronomy Journal, 85(1), 114-120. http://dx.doi.org/10.2134/agronj1993.00021962008500010022x
» http://dx.doi.org/10.2134/agronj1993.00021962008500010022x - Casella, G., & Berger, R. L. (1990). Statistical inference (2nd ed.). Belmont: Duxbury Press.
-
Cox, M. S., Gerard, P. D., Wardlaw, M. C., & Abshire, M. J. (2003). Variability of selected soil properties and their relationships with soybean yield. Soil Science Society of America Journal, 67(4), 1296-1302. http://dx.doi.org/10.2136/sssaj2003.1296
» http://dx.doi.org/10.2136/sssaj2003.1296 - Cunha, G. R., Barni, N. A., Haas, J. C., Maluf, J. R. T., Matzenauer, R., Pasinato, A., Pimentel, M. B. M., & Pires, J. L. F. (2001a). Zoneamento agrícola e época de semeadura para soja no Rio Grande do Sul. Revista Brasileira de Agrometeorologia, 9, 446-459.
- Cunha, G. R., Haas, J. C., Maluf, J. R. T., Caramori, P. H., Assad, E. D., Braga, H. J., Zullo Junior, J., Lazzarotto, C., Gonçalves, S., Wrege, M., Druneta, D., Dotto, S. R., Pinto, H. S., Brunini, O., Thomé, V. M. R., Zampieri, S. L., Pasinato, A., Pimentel, M. B. M., & Pandolfo, C. (2001b). Zoneamento agrícola e época de semeadura para trigo no Brasil. Revista Brasileira de Agrometeorologia, 9, 400-414.
-
Dalhaus, T., Barnett, B. J., & Finger, R. (2020). Behavioral weather insurance: Applying cumulative prospect theory to agricultural insurance design under narrow framing. PLoS One, 15(5), e0232267. http://dx.doi.org/10.1371/journal.pone.0232267
» http://dx.doi.org/10.1371/journal.pone.0232267 -
Dominoni, A. P. F., Caldana, N. F. S., Rodrigues, L., Negrão, B. W., Favoretto, V. R., Bodnar, V. R., & Silva, M. A. A. (2021). Agricultural zoning and recommendations for the seeding of wheat (Triticum species) in the Central-Southern Mesoregion of Paraná State in Brazil. African Journal of Agricultural Research, 17(7), 979-990. http://dx.doi.org/10.5897/AJAR2020.15272
» http://dx.doi.org/10.5897/AJAR2020.15272 -
Food and Agriculture Organization of the United Nations – FAO. (2021). The impact of disasters and crises 2021 on agriculture and food security: 2021 Rome. Food and Agriculture Organization of the United Nations. http://doi.org/10.4060/cb3673en
» http://doi.org/10.4060/cb3673en -
Gonçalves, S. L., & Wrege, M. S. (2018). Considerações sobre metodologias para zoneamento agrícola em escala regionalizada. Agrometeoros, 26(2), 275-285. Retrieved in 2024, March 7, from https://seer.sct.embrapa.br/index.php/agrometeoros/article/view/26426/14567
» https://seer.sct.embrapa.br/index.php/agrometeoros/article/view/26426/14567 -
Grimm, A. M. (2004). How do La Niña events disturb the summer monsoon system in Brazil? Climate Dynamics, 22, 123-138. http://dx.doi.org/10.1007/s00382-003-0368-7
» http://dx.doi.org/10.1007/s00382-003-0368-7 -
Heinemann, A. B., Ramirez-Villegas, J., Stone, L. F., Silva, A. P. G. A., da Matta, D. H., & Diaz, M. E. P. (2021). The impact of El Niño Southern Oscillation on cropping season rainfall variability across Central Brazil. International Journal of Climatology, 41(Suppl.1), E283-E304. http://dx.doi.org/10.1002/joc.6684
» http://dx.doi.org/10.1002/joc.6684 - Hoff, P. D. (2009). A first course in Bayesian statistical methods. New York: Springer.
- Judge, G. G., Hill, R. C., Griffiths, W. E., Lütkepohl, H., & Lee, T. C. (1988). Introduction to the theory and practice of econometrics Hoboken, NJ: John Wiley & Sons.
-
Kravchenko, A. N., & Bullock, D. G. (2000). Correlation of corn and soybean grain yield with topography and soil properties. Agronomy Journal, 92(1), 75-83. http://dx.doi.org/10.2134/agronj2000.92175x
» http://dx.doi.org/10.2134/agronj2000.92175x -
Liu, Y., & Ker, A. P. (2020). Rating Crop Insurance Contracts with Nonparametric Bayesian Model Averaging. Journal of Agricultural and Resource Economics, 45(2), 244-264. Retrieved in 2024, March 7, from https://www.jstor.org/stable/27154064
» https://www.jstor.org/stable/27154064 -
Liu, Y., & Ramsey, A. F. (2023). Incorporating historical weather information in crop insurance rating. American Journal of Agricultural Economics, 105(2), 546-575. http://dx.doi.org/10.1111/ajae.12329
» http://dx.doi.org/10.1111/ajae.12329 -
Miranda, M. J., & Glauber, J. W. (1997). Systemic risk, reinsurance, and the failure of crop insurance markets. American Journal of Agricultural Economics, 79(1), 206-215. http://dx.doi.org/10.2307/1243954
» http://dx.doi.org/10.2307/1243954 -
National Oceanic and Atmospheric Administration – NOAA. (2023). El Niño Southern Oscillation (ENSO) diagnostic discussion Retrieved in 2024, March 7, from https://www.cpc.ncep.noaa.gov/products/expert_assessment/ENSO_DD_archive.php
» https://www.cpc.ncep.noaa.gov/products/expert_assessment/ENSO_DD_archive.php -
Nyiraneza, J., Cambouris, A. N., Ziadi, N., Tremblay, N., & Nolin, M. C. (2012). Spring wheat yield and quality related to soil texture and nitrogen fertilization. Agronomy Journal, 104(3), 589-599. http://dx.doi.org/10.2134/agronj2011.0342
» http://dx.doi.org/10.2134/agronj2011.0342 -
Ozaki, V. A. (2009). Pricing farm-level agricultural insurance: a Bayesian approach. Empirical Economics, 36, 231-242. http://dx.doi.org/10.1007/s00181-008-0193-2
» http://dx.doi.org/10.1007/s00181-008-0193-2 -
Ozaki, V. A., & Silva, R. S. (2009). Bayesian ratemaking procedure of crop insurance contracts with skewed distribution. Journal of Applied Statistics, 36(4), 443-452. http://dx.doi.org/10.1080/02664760802474256
» http://dx.doi.org/10.1080/02664760802474256 -
Ozaki, V. A., Goodwin, B. K., & Shirota, R. (2011). Parametric and nonparametric statistical modelling of crop yield: implications for pricing crop insurance contracts. Applied Economics, 40(9), 1151-1164. http://dx.doi.org/10.1080/00036840600749680
» http://dx.doi.org/10.1080/00036840600749680 -
Ozaki, V. A., Olinda, R., Faria, P. N., & Campos, R. C. (2014). Estimation of the agricultural probability of loss: evidence for soybean in Paraná state. Revista de Economia e Sociologia Rural, 52(1), 25-40. http://dx.doi.org/10.1590/S0103-20032014000100002
» http://dx.doi.org/10.1590/S0103-20032014000100002 -
Ozaki, V. A., Olinda, R., Faria, P. N., & Campos, R.C. (2014). Estimating the probability of loss in agricultural insurance: An application of extreme value theory. Revista de Economia e Sociologia Rural, 52(1), 83-98. http://dx.doi.org/10.1590/S0103-20032014000100002
» http://dx.doi.org/10.1590/S0103-20032014000100002 -
Pandolfo, C., Da Silva, B. E., & Werner, S. S. (2021). Publicações sobre o zoneamento agrícola em revistas científicas no Brasil de 1995 a 2018. Agrometeoros. Passo Fundo, 29(e026864), 1-10. http://dx.doi.org/10.31062/agrom.v29.e026864
» http://dx.doi.org/10.31062/agrom.v29.e026864 -
Park, E., Brorsen, B. W., & Harri, A. (2019). Using bayesian kriging for spatial smoothing in crop insurance rating. American Journal of Agricultural Economics, 101(2), 330-351. http://dx.doi.org/10.1093/ajae/aay045
» http://dx.doi.org/10.1093/ajae/aay045 -
Ray, D. K., Gerber, J. S., MacDonald, G. K., & West, P. C. (2015). Climate variation explains a third of global yield variability. Nature Communications, 6, 5989. http://dx.doi.org/10.1038/ncomms6989
» http://dx.doi.org/10.1038/ncomms6989 -
Rejesus, R. M., Coble, K. H., Miller, M. F., Boyles, R., Goodwin, B. K., & Knight, T. O. (2015). Accounting for weather probabilities in crop insurance rating. Journal of Agricultural and Resource Economics, 40(2), 306-324. Retrieved in 2024, March 7, from https://www.jstor.org/stable/44131863
» https://www.jstor.org/stable/44131863 -
Secretaria Estadual de Agricultura e Abastecimento – SEAB. (2022). Estimativa de Safra. Retrieved in 2024, March 7, from https://www.agricultura.pr.gov.br/deral/safras
» https://www.agricultura.pr.gov.br/deral/safras -
Sene, M., Vepraskas, M. J., Naderman, G. C., & Denton, H. P. (1985). Relationships of soil texture and structure to corn yield response to subsoiling. Soil Science Society of America Journal, 49(2), 422-427. http://dx.doi.org/10.2136/sssaj1985.03615995004900020030x
» http://dx.doi.org/10.2136/sssaj1985.03615995004900020030x -
Shi, W., & Irwin, S. H. (2005). Optimal hedging with a subjective view: An empirical Bayesian Approach. American Journal of Agricultural Economics, 87(4), 918-930. http://dx.doi.org/10.1111/j.1467-8276.2005.00778.x
» http://dx.doi.org/10.1111/j.1467-8276.2005.00778.x -
Tack, J. B., & Ubilava, D. (2015). Climate and agricultural risk: Measuring the effect of Enso on US crop insurance. Agricultural Economics, 46(2), 245-257. http://dx.doi.org/10.1111/agec.12154
» http://dx.doi.org/10.1111/agec.12154 -
Tsiboe, F., & Tack, J. (2021). Utilizing Topographic and Soil Features to Improve Rating for Farm-Level Insurance Products. American Journal of Agricultural Economics, 104(1), 52-69. http://dx.doi.org/10.1111/ajae.12218
» http://dx.doi.org/10.1111/ajae.12218 -
Uhlmann, L. O., Ramos, P. C. S., Cunha, G. R., Parfitt, J. M. B., Galvani, D. B., & Buriol, G. A. (2020). Climate risk zoning for gladiolus in the state of Rio Grande do Sul, Brazil. Pesquisa Agropecuária Brasileira, 55(e01094), http://dx.doi.org/10.1590/S1678-3921.pab2020.v55.01094
» http://dx.doi.org/10.1590/S1678-3921.pab2020.v55.01094 -
Wilson, A., Avila-Diaz, A., Oliveira, L. F., Zuluaga, C. F., & Mark, B. (2022). Climate extremes and their impacts on agriculture across the Eastern corn belt region of the U.S. Weather and Climate Extremes, 37, 100467. http://dx.doi.org/10.1016/j.wace.2022.100467
» http://dx.doi.org/10.1016/j.wace.2022.100467 -
Woodard, J. D., & Verteramo-Chiu, L. J. (2017). Efficiency impacts of utilizing soil data in the pricing of the federal crop insurance program. American Journal of Agricultural Economics, 99(3), 757-772. http://dx.doi.org/10.1093/ajae/aaw099
» http://dx.doi.org/10.1093/ajae/aaw099 -
Yamada, E. S. M., & Sentelhas, P. C. (2014). Agro-climatic zoning of Jatropha curcas as a subside for crop planning and implementation in Brazil. International Journal of Biometeorology, 58, 1995-2010. http://dx.doi.org/10.1007/s00484-014-0803-y
» http://dx.doi.org/10.1007/s00484-014-0803-y -
Yi, F., Zhou, M., & Zhang, Y. Y. (2020). Value of incorporating Enso forecast in crop insurance programs. American Journal of Agricultural Economics, 102(2), 439-457. http://dx.doi.org/10.1002/ajae.12034
» http://dx.doi.org/10.1002/ajae.12034 -
Zhu, W., Porth, L., & Tan, K. S. (2019). A credibility-based yield forecasting model for crop reinsurance pricing and weather risk management. Agricultural Finance Review, 79(1), 2-26. http://dx.doi.org/10.1108/AFR-08-2017-0064
» http://dx.doi.org/10.1108/AFR-08-2017-0064