
 Structural change and environmental degradation: Evidence on the determinants of CO2e emissions in Brazilian states (2003-2022)
ABSTRACT
This paper investigates the relationship between the Brazilian development model, characterized by the re-primarization and deindustrialization of its productive structure, and the increase in greenhouse gas emissions (GHG). For that, the study provides estimates using a panel data model for Brazilian states to investigate the relationship between carbon dioxide equivalent (CO2e) emissions and some key variables between 2003 and 2022. Our findings suggest that the composition of productive structure is crucial in determining the gas emissions in Brazil. Furthermore, our results also point out the importance of increasing sophistication and knowledge intensity of its produced goods as a strategy to reduce GHG emissions.
KEYWORDS:
Structural change; climate change; CO2e emissions
RESUMO
Este artigo investiga a relação entre o modelo de desenvolvimento brasileiro, caracterizado pela reprimarização e desindustrialização de sua estrutura produtiva, e o aumento das emissões de gases de efeito estufa (GEE). Para isso, o estudo apresenta estimativas utilizando um modelo de dados em painel para os estados brasileiros, a fim de analisar a relação entre as emissões de dióxido de carbono equivalente (CO2e) e variáveis-chave no período de 2003 a 2022. Os principais resultados sugerem que a composição da estrutura produtiva é crucial na determinação das emissões de gases no Brasil. Além disso, nossas descobertas também destacam a importância do aumento da sofisticação e da intensidade do conhecimento nos bens produzidos como uma estratégia para reduzir as emissões de GEE.
PALAVRAS-CHAVE:
Mudança estrutural; mudança climática; emissões de CO2e
1. INTRODUCTION
Literature states that the environmental crisis is a major global challenge in a manner that the coordinated reduction of greenhouse gas (GHG) 1 emissions is crucial to addressing this situation ( Steffen et al., 2015 ; Richardson et al., 2023 ; WWF, 2002 ). In response to this context, 195 countries, including Brazil, signed the Paris Agreement in 2015, committing to reduce GHG emissions through Nationally Determined Contributions (NDCs) aimed at limiting global temperature rise to 1.5ºC above pre-industrial levels ( IPCC, 2023 ).
Various countries have implemented measures, such as the Biden administration’s push for renewable energy in the U.S. and the European Green Deal, which aims for climate neutrality by 2050 ( European Council, 2024 ; Climate Action Tracker, 2024 ). China, as the largest emitter, invests heavily in clean energy to reach the carbon neutrality until 2060.
Brazil has committed to reducing emissions by 37% by 2025 and 43% by 2030, but these targets are unlikely to be accomplished. In 2024, this target was revised, and the country should pursue the reduction of emissions by 59%-67% by 2035, relative to 2005 levels, and the achievement of climate neutrality by 2050. Despite the revisions, emissions remained high, driven primarily by deforestation due the “Land Use and Forestry”, followed by agriculture, livestock and energy ( SEEG, 2023 ; Tsai et al., 2024 ).
The explanation may be linked to Brazil’s peripheral role in the world economy, as an agro-exporting economy, supplying agricultural, mineral, and energy products since the early 2000’s. In parallel, there was a relative decline in the share of the manufacturing in total GDP - less than 10% in 2023. This ongoing deindustrialization process has generated serious consequences for the economy, widely documented in the literature ( Iasco-Pereira and Morceiro, 2024 ; Bresser-Pereira, 2018 ; Bresser-Pereira, Marconi, and Oreiro, 2016 ; Nassif, Feijó, and Araujo, 2013 ). It is worth noting that the crisis and subsequent economic stagnation after the mid-2010s were among the factors that contributed to economic/social and political setbacks post-2016, including the dismantling of policies and institutions responsible for environmental protection ( Costa et al., 2023 ).
Considering this context, this article analyzes the relationships between Brazil’s productive structure and the CO2e emissions using a dynamic panel data model. The proposed approach relates CO2e emissions in Brazilian states to different variables representing the productive structure, as well as other socioeconomic, political, demographic, and environmental factors from 2003 to 2022. Our hypothesis is that Brazil’s re-primarization has unfolded in parallel with deindustrialization, defined as the declining share of industry in total output and the contraction of industrial employment within overall employment. Given their intrinsic characteristics, both processes are expected to be associated with environmental degradation, as they encompass two harmful dimensions: i) overexploitation of natural resources and; ii) reduction of opportunities for innovation and adoption of technologies that conserve ecosystem resources and reduce pollution.
The paper’s structure is as follows. Section 2 discusses theoretical aspects and empirical literature on structural change. Section 3 discusses elements of the Brazilian environmental context in recent decades, analyzing its key characteristics. Section 4 outlines the panel data analysis methodology, discusses the variables and the econometric model. Section 5 presents and discusses the results of the estimation. At last, our conclusions.
2. STRUCTURAL CHANGE AND THE ENVIRONMENTAL ISSUE: THEORETICAL ASPECTS AND EMPIRICAL LITERATURE
Economic growth and its consequent structural change have been a central target for policymakers in developing countries as it mitigates persistent structural problems such as poverty reduction, unemployment, external imbalances, financial instability, technological dependence, among others. Thus, growth has been considered a definitive solution for improving living standards, especially by poor countries ( Daly, 2019 ).
However, the recent climate crisis has revealed a paradox between economic growth and the planet’s ecological limits. Rooted in the intensive use of fossil fuels since the Industrial Revolution and the rapid expansion of human activity, this process has led to what scholars call the Anthropocene 2 - a new epoch marked by human-driven planetary transformations. This shift from an “empty world” to a “full world” underscores the need for a new development model oriented toward sustainability ( Constanza, 2020 ).
Considering the growth-environment nexus, since the development of the Environmental Kuznets Curve (EKC) 3 in the 1990s, numerous studies have investigated the relationship between economic growth and environmental degradation by testing the inverted U-shaped hypothesis, which suggests that in the early stages of development, countries tend to increase environmental degradation, but reduce it as per capita income rises ( Mardani et al., 2018 ).
The idea is that, as economic development takes place, it induces changes in individuals’ preferences toward greater environmental conservation, shifts in the composition of production and consumption, the emergence of more democratic political systems, the implementation of stricter environmental policies and regulations, and also the adoption of improved technologies that reduce environmental degradation. In contrast, some studies also emphasize that technological progress, by itself, does not guarantee the restoration of ecosystems. Instead, it is necessary to pursue effective sustainable development, which entails changes in modes of production and consumption, takes into account the reduction of social and economic inequalities, and relies on public policies aligned with environmental conservation and the recognition of planetary boundaries ( Romeiro, 2012 ; Richardson, K. et al., 2023 ).
In this sense, recent literature has highlighted the association between economic development and economic complexity. Originating from the work of Hidalgo and Hausmann (2009 ), this approach analyzes a country’s productive structure through the diversity and sophistication of its exports. It has analyzed that higher economic complexity is associated with greater development, reflected in higher income, education, longevity, lower inequality, among others.
Consistent with environmental concerns, studies also indicate that higher economic complexity can mitigate the environmental impacts of development, though the relationship is nonlinear - pollution typically rises in early stages and declines as complexity increases. Sustainability additionally relies on institutional quality, renewable energy, green finance, and effective governance. Simões and Andrade (2022 ), in this regard, analyzed 115 countries between 1995 and 2015 and found that in more complex economies, environmental impact decoupling occurs faster, while in less complex ones, resource use remains more intense. These results emphasize the need to consider intersectoral heterogeneity for both cleaner agricultural practices and more innovative and less carbon-intensive industrial activities.
In summary, the literature on the relationship between productive structure and environmental degradation explain that structural change is crucial to foster development aligned with the transition to a low-carbon economy, enabling economies to acquire knowledge and competencies, conduct research, and make technological advancements to develop and use technologies compatible with environmental preservation. Conversely, economies with productive structures based on primary goods production/export face greater difficulties in generating knowledge and making more efficient use of natural resources, further hindering their achievement of economic development and environmental sustainability.
Next section discusses some stylized facts of the Brazilian economy.
3. DEVELOPMENT AND ENVIRONMENT: NOTES ON THE BRAZILIAN SCENARIO
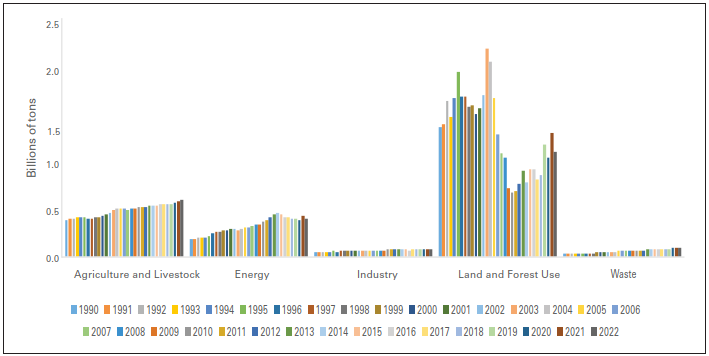
Brazil is the seventh largest 4 global emitter of GHG, reaching 2.319 billion tons of CO2e in 2022. As illustrated in Figure 1 , the primary source of emissions is “Land-use and forest change”, resulting from the conversion of forested areas into agricultural land and biomass burning, representing 48.28% of total emissions. “Agriculture and livestock” ranks as the second-largest source of GHG emissions (26.61%), followed by the energy (17.78%) and, finally, waste and industrial processes, accounting for 3.93% and 3.36%, respectively.

Besides that, total emissions increased between 1990 and 2022, from 2.04 billion to 2.31 billion tons of CO2e (a 13.23% increase). Figure 1 is presented below.
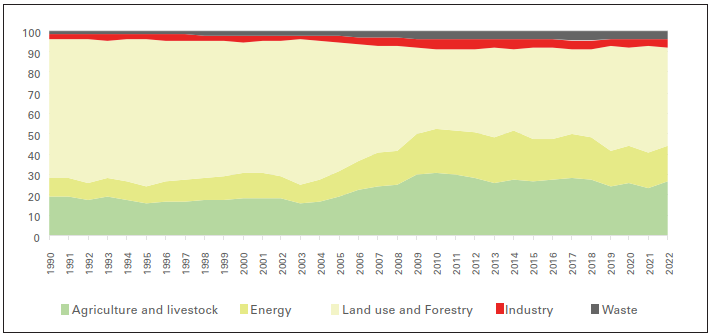
Bellow, Figure 2 shows that between 1990 and 2022 “Land-use and forestry change” was the only category to reduce emissions (-19.16%) but remained Brazil’s largest source of emissions. Policies such as Action Plan for the Prevention and Control of Deforestation in the Legal Amazon - PPCDAm (2003), Real-Time Deforestation Detection System - DETER (2004), the Amazon Fund, the revised Forest Code (2012), and private initiatives like the Soy (2006) and Cattle (2009) Moratoria initially helped curb deforestation. However, after 2012, the weakening of these measures led to renewed deforestation and rising emissions.

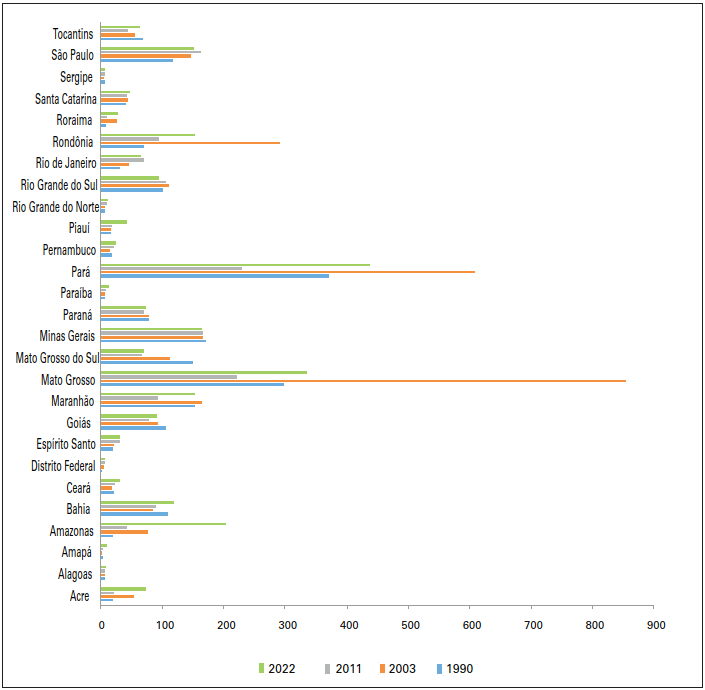
Next, Figure 3 shows that Brazilian emissions rose across agriculture (+57.8%), energy (+115.2%), industry (+56.8%), and waste (+204.4%) between 1990 and 2022. Top emitters in 2022 were Mato Grosso, Pará, Rondônia, and Minas Gerais, with São Paulo fifth. Emissions declined in seven states but increased in fifteen, especially in the Legal Amazon, notably Amazonas, Acre, and Amapá.

Figure 4 provides an overview of CO2e emissions by category across Brazilian states from 1990 to 2022. The top emitters in 2022 - Mato Grosso, Pará, and Rondônia - are located in the Legal Amazon, where “Land-use and forestry change” is the main source, driven primarily by rising deforestation. Key contributing factors include illegal land grabbing and unauthorized gold mining ( RAD, 2023 ). Similar emission patterns are observed in Maranhão, Tocantins, Roraima, Amazonas, Bahia, Piauí, and Acre.

According to Figure 4 , in Minas Gerais, Goiás, Mato Grosso do Sul, Paraná, Rio Grande do Sul, and Ceará, agriculture, particularly livestock, is the main source of CO2e emissions, with soil management also contributing. Mato Grosso, with the largest cattle herd (32.4 million in 2022), leads in both land-use and agricultural emissions. In São Paulo, Rio de Janeiro, Bahia, Minas Gerais, Paraná, and Rio Grande do Sul, the energy sector is a relevant emissions contributor due to high transport and electricity demand.
Also, it should be noted that, between 2003 and 2022, Brazilian states exhibited distinct patterns in the relationship between GDP per capita growth and CO2e emissions. The largest increases in emissions occurred in Amapá (+264%), Amazonas (+166%), and Piauí (+157%). In the first two, GDP per capita remained stagnant, suggesting that deforestation was the main driver of emissions, while in Piauí, economic growth was accompanied by strong environmental pressure. In Ceará, Paraíba, Pernambuco, Rio Grande do Norte, Alagoas, Bahia, Rio de Janeiro, and the Federal District, moderate to high growth in GDP per capita occurred in parallel with increases in emissions (between 30% and 75%).
Mato Grosso, Mato Grosso do Sul, Pará, and Rondônia recorded more robust GDP per capita growth alongside declines in emissions (between -28% and -61%), likely reflecting reduced deforestation and productivity gains in agribusiness. Paraná, Maranhão, Minas Gerais, and Rio Grande do Sul also registered growth but with moderate reductions in emissions (-6% to -14%), indicating a slight “decoupling” between economic growth and emissions. Finally, São Paulo, Roraima, Santa Catarina, Tocantins, and Sergipe experienced low to medium GDP per capita growth, with stable or slightly positive emissions, suggesting considerable heterogeneity among states as well as different determinants of their individual trajectories.
In summary, it is evident that emissions did not decline sufficiently, highlighting missed opportunities for a low-carbon transition. The increase in deforestation and continued fossil fuel use represent a setback in climate action; consequently, the 2011-2020 period can be considered a “lost decade”, during which total emissions rose by 40%. Net emissions, which result from gross emissions minus carbon removals by protected areas, land use changes, and secondary vegetation, increased 55%. The probable explanation is that the persistent challenges in controlling deforestation across Brazilian territory compromised the ability of the forests to serve as a carbon sink, consequently reducing net emissions in this period ( SEEG, 2023 ).
4. EMPIRICAL ANALYSIS
Methodology
To examine the relationship between CO2 e emissions and the productive structure in the Brazilian states from 2003 to 2022, this study applies dynamic panel data model. As Greene (2008 ) notes, panel data combines time-series and cross-sectional dimensions so that enhances estimation efficiency by increasing observations, improving estimator properties, expanding degrees of freedom, reducing multicollinearity and controlling for data heterogeneity.
The general form of a panel data model can be expressed as:
where y it is the outcome for entity i at time t, X it is a vector of explanatory variables, ηi represents entity-specific fixed effects, λt represents time-specific fixed effects, and ∈it is the error term.
Panel data models can be estimated using fixed effects (FE) or random effects (RE) methods, with FE preferred when individual effects correlate with explanatory variables. Dynamic panel models, which include lagged dependent variables, are particularly useful for capturing persistence and dynamic relationships over time.
The general form of a dynamic data model, as follows:
where y i, t-1 the lagged dependent variable, γ captures the persistence of the outcome, and the other terms are as defined previously.
Including lagged dependent variables introduces endogeneity, requiring advanced estimation methods such as the Generalized Method of Moments (GMM). Dynamic panel models address this by extending standard panel frameworks to incorporate past values of the dependent variable. The endogeneity occurs because y i, t-1 correlated with the entity-specific fixed effect ηi . This correlation arises since y i, t-1 a function of ηi , leading to biased and inconsistent estimates if not properly addressed. Endogeneity in dynamic panel data models arises from the correlation between the lagged dependent variable and the entity-specific fixed effects. This correlation violates the exogeneity assumption, causing traditional methods like OLS and FE to yield biased estimates.
To address endogeneity, instrumental variables (IV) and Generalized Method of Moments (GMM) estimators are applied. GMM uses internal instruments, lagged levels and differences of variables, to obtain consistent and efficient estimates in dynamic panel models.
There are two main types of GMM estimators for dynamic panel data models: the Difference GMM and the System GMM. The Difference GMM, proposed by Arellano and Bond (1991 ), transforms the model to eliminate the entity-specific fixed effects by taking first differences.
The transformed model is:
where ∆ denotes the first difference operator. The lagged levels of the dependent variable ( yi , t -2, yi , t -3, ...) are used as instruments for the lagged first differences (Δ y i, t-1 ).
The System GMM ( Blundell and Bond, 1998 ) combines level and differenced equations, using lagged values as instruments to improve efficiency, particularly when the dependent variable is highly persistent.
The GMM estimators rely on the following conditions:
It is important to note that the validity of GMM estimators is assessed using diagnostic tests, including the Arellano-Bond test for autocorrelation and the Difference-in-Hansen test for instrument validity, ensuring robust and reliable results.
Data, Variables and Estimated Model
The selected variables follow the empirical literature and include those related to the productive structure, energy consumption, policies and institutions. Data are annual and the 2003-2022 period was defined based on data availability.
The selection is theoretically and empirically grounded as follows: the agricultural expansion, represented by planted area (plant), is a key driver of deforestation and emissions, particularly in the Legal Amazon ( Kuschnig et al., 2021 ; Arraes et al., 2012 ); livestock (bov) strongly contributes to methane (CH4) emissions and deforestation associated with pasture formation ( SEEG, 2023 ; WWF, 2022 ); energy consumption (energy) represents a direct source of emissions, related to economic growth and industrialization ( Dogan et al., 2020 ; Shahzad et al., 2021 ); GDP (gdp) modelling how economic activity level affects emissions according to the EKC, and the inclusion of a quadratic term aims to capture non-linear relationships ( Mardani et al., 2019 ); exports (exp) capture effects related to productive specialization and external environmental pressures, potentially intensifying natural resource exploitation ( Bresser-Pereira, 2018 ); participation of the manufacturing in GDP (part) measures the degree of industrialization, with impacts on emissions and structural change, based on the Kaldorian and structuralist literature ( Dasgupta and Singh, 2006 ; Nassif et al., 2015 ); productive complexity 5 (cei) influences emissions intensity, with effects depending on the types of activities comprising the productive structure ( Hidalgo and Hausmann, 2009 ; Romero and Gramkow, 2021 ; Silveira et al. (2025 ); environmental expenditure (env) captures institutional efforts to mitigate emissions through public policies ( Ibrahim et al., 2022 ); total population (pop) represents demographic pressures as determinant of total emissions and; the binary variable (amazon) representing states from Legal Amazon for these represent important agricultural frontiers in Brazil and sources of deforestation and livestock exploitation SEEG (2023 ).
Table 1 describes the variables, its units and sources.
For the empirical analysis, two theoretical models were estimated. The general specification is as follow:
Due to the presence of the lagged dependent variable and the potential endogeneity of some covariates, we estimate the parameters using the Generalized Method of Moments (GMM) for dynamic panel data models. Both the Difference GMM estimator ( Arellano and Bond, 1991 ) and the System GMM estimator ( Blundell and Bond, 1998 ) are applied. In the difference specification, the endogenous variables were instrumented by their lagged levels starting from. In the System GMM, we combined the differenced equation with the level equation, using lagged differences as instruments for the level equation.
The estimations use variables in logarithmic form to directly obtain the respective elasticities.
5. FINDINGS
To analyze the impact of re-primarization on the evolution of CO2e emissions in Brazilian states, we first examine planted area (ln_plant) and cattle herd (ln_bov), taken as proxies for re-primarization. For the planted area, the coefficients were negative, although significant only for the Model II specifications. In this case, the inclusion of the squared form (ln_plant2) resulted in a positive relationship with CO2e emissions, suggesting that this effect is not linear and that, as the planted area expands, emissions begin to rise again.
This result, though initially unexpected, is supported by SEEG (2023 ), which highlights the positive impact of disseminating Low Carbon Agriculture (LCA) technologies with the implementation of techniques such as no-till systems, well-managed pastures, planted forests, and crop-livestock-forest integration systems. These practices have been promoted in Brazil over the past few decades resulted in a net removal of 229 million tons of CO2e from the soil in 2021, demonstrating the potential of agriculture to mitigate environmental degradation.
Regarding the cattle herd (ln_bov), the coefficients were positive and significant in all functional forms, indicating that the increase in livestock production was associated with higher CO2e emissions. States like Mato Grosso, Minas Gerais and Goiás, where livestock farming is a central economic activity, recorded high levels of emissions, largely due to the inherent characteristics of the activity and inadequate soil management, such as degraded pasture areas ( SEEG, 2023 ). Kuschnig (2021 ) and Arraes, Mariano and Simonassi (2012 ) also highlight the relationship between deforestation and the expansion of agriculture and livestock, especially in the Legal Amazon.
The energy consumption (ln_energy) shows significant and positive coefficients only for Model II, which is understandable given that only two states - São Paulo and Rio de Janeiro - have the energy sector as the main source of emissions. Despite the growth in energy demand and the increased use of fossil fuels in the Brazilian states in last years, Brazil’s energy matrix remains relatively clean, with a predominance of renewable sources such as biofuels, hydropower, wind and, more recently, solar energy.
The coefficients for ln_gdp and ln_gdp2, both statistically significant at the 1% level in Model II, indicate a U-shaped relationship between GDP and industrial emissions, contrary to the theoretical relationship suggested by the EKC. This counterintuitive result suggests that, in the Brazilian context, early stages of development are associated with reductions in CO2e emissions, whereas more advanced stages of economic maturity correlate with increased emissions. One possible explanation for this phenomenon lies in the peculiar trajectory of structural change in the economy, characterized by early deindustrialization, Dutch Disease and re-primarization.
This finding should be interpreted alongside the relationship observed in the coefficients of ln_plant and ln_plant2, which show that agricultural expansion (planted/harvested area) exhibits a U-shaped non-linear relationship with CO2e emissions. That is, after an initial stage of potential gains, agricultural expansion becomes an upward pressure on emissions through increased demand for industrial inputs and the growth of processing industries. Thus, the economic dynamism of agricultural activity is intrinsically linked to the expansion of natural resource processing industries and the demand for emission-intensive inputs, such as fertilizers and machinery, causing scale effects to outweigh any technical efficiency gains. Furthermore, within this framework, livestock shows a linear and positive relationship with emissions, reinforcing these arguments.
Additionally, it is argued that the Brazilian economy may be subject to a technological dependency trap associated with middle-income status. Initial efficiency gains, captured by the negative early GDP coefficients, are exhausted as economic growth becomes increasingly dependent on natural-resource-intensive sectors. The transition to higher income levels, without a concomitant technological leap toward higher value-added, low-carbon activities, leads to a scenario of recoupling, in which growth once again exerts positive pressure on emissions. In this sense, the U-shaped pattern does not reflect a model failure, but rather empirically captures a specific development dynamic, in which the productive structure, not merely the income level is a fundamental determinant of the emissions profile.
Regarding the industry, the increase in the share of the manufacturing in total GDP (ln_part) produced positive and statistically significant coefficients across all estimated models. This indicates that the expansion of the manufacturing is associated with higher emissions in Brazilian states. In fact, the coefficients were greater than one in Model II, suggesting that emissions respond elastically and underscoring the sector’s energy and carbon-intensive profile.
However, this direct relationship is moderated by the sophistication of industrial activity, represented in this paper by economic complexity. The variable (ln_cei) effectively reduces emissions, showing negative and statistically significant coefficients, with elasticities larger in magnitude than those associated with industrialization. This crucial finding is consistent with the literature that moves beyond analyzing the size of the industrial sector alone and instead emphasizes its structure and sophistication.
These results corroborate the theoretical framework proposed by Romero et al. (2024 ), who argue that regions achieve resilience and sustainable growth not by simply expanding their industrial base, but by diversifying into more complex, knowledge-intensive activities. Such activities are typically characterized by higher technological content, greater resource-use efficiency and the integration of services into manufacturing, which together contribute to lower emission intensity.
Furthermore, these findings align with Silveira et al. (2025 ). Those authors contend that economic complexity is a key factor in reducing environmental degradation in the Brazilian Amazon. A more complex economy provides alternatives to land-intensive frontier expansion; our results extend this argument by showing that it also enables the decoupling of industrial production from carbon emissions. The negative coefficient for ln_cei thus suggests that states fostering more sophisticated productive structures, capable of generating and applying advanced knowledge, are better positioned to mitigate the environmental impact. The significant negative interaction term (ln_part×ln_cei) further reinforces this, showing that the emissions-increasing effect of a larger industrial share is substantially attenuated in states with higher economic complexity.
The interesting point to highlight is regarding the interaction between industrialization and economic complexity index (ln_part×ln_cei) which was estimated to understand how emissions behave when both industry and economic complexity are considered together. The coefficients were negative and significant for all estimated models, suggesting that industrialization based on a more complex industry is a desirable policy from an emissions standpoint, as increasing economic complexity leads to greater technological capacity and resources to invest in clean energy alternatives, promoting a transition to less carbon-intensive production.
This result is consistent with several studies ( Can and Gozgor, 2017 ; Dogan et al., 2020 ; Alvarado et al., 2021 ; Swart and Brinkman, 2020 )) which highlight economic complexity as a relevant factor in mitigating environmental impacts. The finding also emphasizes an important issue regarding Brazilian industrial policy, particularly the New Industry Brazil (NIB), which needs to consider not only the process of (re)industrialization in Brazil, but also ensure that this process involves a modern industry that takes environmental concerns into account.
Regarding the variable for environmental expenditures (ln_env), it presented a negative coefficient, but significant only in one functional form, indicating the weak capacity of these expenditures in reducing CO2e emissions in Brazilian states. One of the possible explanations is that environmental expenditures are accounted for together with agricultural activity expenditures under the budget line “Expenditure in environmental management, agriculture, and agrarian organization”, that means, these resources possibly do not play an important role in environmental issues. This finding supports even more the importance of environmental protection policies and institutions ( Can and Gozgor, 2017 ; Ahmad et al., 2021 )). Environmental expenditures are also a signal and a commitment to environmental issues, formalized through spending and the inclusion of this element in public policy priorities.
However, after 2014 in Brazil the combination of economic, regulatory, and political factors, including the weakening of the legal and institutional framework for environmental protection, as well as the reduced presence and enforcement capacity of agencies responsible for monitoring, inspection, and sanctioning of environmental violations led to a resurgence of deforestation, which advanced significantly across Brazil’s main biomes, particularly the Amazon and the Cerrado ( RAD, 2023 ; Borges, 2022 ). The underfunding of environmental agencies in Brazil, particularly during the 2019-2022 period, coincided with an increase in emissions, with several environmental indicators showing setbacks.
It is also noteworthy that the expansion of agricultural and livestock activities in the Northern arc of Brazil has led to deforestation, irregular land occupation, higher emission levels, and consequently worse environmental indicators. In this sense, the binary variable for the Amazon region included in the estimated functional forms (amazon) shows changes in intercepts when considering the states of the Legal Amazon (Acre, Amapá, Amazonas, Pará, Rondônia, Roraima, Tocantins, Mato Grosso, and Maranhão). The results were quite robust, showing positive and statistically significant results for all estimated models, reinforcing the association of these states with the increase in CO2e emissions during the analyzed period.
Other variables, in their linear and squared forms, were included as controls (ln_gdp and ln_pop) exhibited negative coefficients in most specifications but later became positive. That is, initially, they contributed to reducing emissions, but over time, the expansion of these variables once again increases environmental deterioration. This is consistent with the revised literature that highlights that the planet’s biophysical limits need to be considered.
To sum up, these findings showed that the key elements of the models discussed above remained in the different functional forms and were considered robust with flexible adjustments.
6. CONCLUDING REMARKS
The environmental crisis, particularly climate change, presents significant challenges for developing countries like Brazil, where structural inequalities, resource scarcity, and environmental degradation are worsening. Brazil’s primary source of GHG emissions comes from “Land-use and forestry change”, which includes deforestation and biomass burning, contributing to about half of the country’s total emissions. This reflects a broader neglect of environmental preservation in a country with vast biomes, including the Amazon, and has hindered Brazil’s ability to meet climate goals under the Paris Agreement. This study investigates how changes in Brazil’s productive structure impact CO2e emissions.
Using dynamic panel data models for the period 2003-2022, our study examined the relationship between emissions and variables representing the productive structure of the economy, under the hypothesis that the processes of re-primarization and deindustrialization of the Brazilian economy, occurring simultaneously, have negative environmental effects.
Our findings suggested that both livestock and manufacturing significantly contribute to CO2e emissions, while improvements in economic complexity help reduce emissions. The study emphasizes the importance of advancing industrial sophistication to lower environmental impacts. Additionally, sustainable practices in agriculture and livestock are also needed, supported by effective public policies. A key finding is that belonging to the Amazon Biome increases CO2e emissions in states within the Legal Amazon, highlighting the need for stronger legal frameworks and effective measures to combat deforestation.
In conclusion, the socio-environmental crisis demands the adoption of a new sustainable development model, both globally and in Brazil. Such a model must promote structural change, moving beyond climate change denial and the neoliberal policies that have dominated the Brazilian landscape in recent decades. This paradigm shift is essential to fostering long-term economic, social, and environmental sustainability.
Data Availability Statement
Access to the research data is available upon request.
REFERENCES
-
Ahmad, M.; Ahmed, Z.; Majeed, A.; Huang, B. (2021). An environmental impact assessment of economic complexity and energy consumption: Does institutional quality make a difference? Environmental Impact Assessment Review, v. 89. Doi 10.1016/j.eiar.2021.106603
» https://doi.org/10.1016/j.eiar.2021.106603 -
Alvarado, R., Tillaguango, B., Dagar, V., Ahmad, M., Işık, C., Méndez, P., & Toledo, E. (2021). Ecological footprint, economic complexity and natural resources rents in Latin America: empirical evidence using quantile regressions. Journal of Cleaner Production, 318, 128585. https://doi.org/10.1016/j.jclepro.2021.128585
» https://doi.org/10.1016/j.jclepro.2021.128585 - Arellano, M.; Bond, S. (1991). Some tests of specification for panel data: Monte Carlo evidence and an application to employment equations. The Review of Economic Studies, v. 58, n. 2, p. 277-297.
- Arraes, R. A.; Mariano, F. Z.; Simonassi, A. G. (2012). Causa do desmatamento no Brasil e seu ordenamento no contexto mundial. RESR, 50(1), 119-140.
- Blundell, R.; Bond, S. (1998). Initial conditions and moment restrictions in dynamic panel data models. Journal of Econometrics, v. 87, n. 1, p. 115-143.
-
Borges, B. (2022). Custos globais do desmatamento da Amazônia. FGV-IBRE. https://blogdoibre.fgv.br/posts/custos-globais-do-desmatamento-da-amazonia
» https://blogdoibre.fgv.br/posts/custos-globais-do-desmatamento-da-amazonia -
Brasil. Ministério do Meio Ambiente (MMA). Sumário Executivo - Documento-base para subsidiar os diálogos estruturados sobre a elaboração de uma estratégia de implementação e financiamento da Contribuição Nacionalmente Determinada do Brasil ao acordo de Paris. Available at: Available at: https://antigo.mma.gov.br/images/arquivo/80051/NDC/sumario_executivo_2017.pdf . Accessed oct. 2023.
» https://antigo.mma.gov.br/images/arquivo/80051/NDC/sumario_executivo_2017.pdf -
Bresser-Pereira, L. C. Neutralizing the Dutch disease. (2018). Working Paper EESP/FGV 476, May 2018. Available at: Available at: https://www.bresserpereira.org.br/papers/2018/296-Neutralizing-the-Dutch-disease-TD476.pdf . Accessed: oct. 2024.
» https://www.bresserpereira.org.br/papers/2018/296-Neutralizing-the-Dutch-disease-TD476.pdf - Bresser-Pereira, L. C.; Oreiro, J. L. & Marconi, N. (2016). Macroeconomia desenvolvimentista. Rio de Janeiro: Elsevier.
-
Can, M. & Gozgor, G. (2017). The impact of economic complexity on carbon emissions: evidence from France. Environ Sci Pollut Res Int. Jul; 24(19): 16364-16370. doi: 10.1007/s11356-017- 9219-7.
» https://doi.org/10.1007/s11356-017- 9219-7 - Chiliatto-Leite, M. V. (org.). (2019). Alternativas para o desenvolvimento brasileiro: novos horizontes para a mudança estrutural com igualdade. Santiago: Comissão Econômica para a América Latina e o Caribe (CEPAL).
-
Climate Action Tracker. (2024). Available: Available: https://climateactiontracker.org/countries/china/ Accessed oct. 2024.
» https://climateactiontracker.org/countries/china/ -
Constanza, R. (2020). Ecological economics in 2049: Getting beyond the argument culture to the world we all want. Ecological Economics. 168. https://doi.org/10.1016/j.ecolecon.2019.106484
» https://doi.org/10.1016/j.ecolecon.2019.106484 - Costa, F. A., Pochmann, M. & Amorim, R. L. C. (2023). Transição ecológica e social no Brasil: uma introdução. São Paulo: Fundação Perseu Abramo; Hucitec.
- Daly, H. E. (2019). Growthism: its Ecological, Economic and Ethical Limits. Resilience.
- Dasgupta S. & Singh A. (2006). Manufacturing, Services and Premature Deindustrialization in Developing Countries: A Kaldorian Analysis. Research Paper 2006/049. Helsinki: UNU-WIDER
-
Dataviva. (2024). Índice de Complexidade Econômica dos Estados brasileiros (Salários e Emprego - RAIS). 2003-2022. https://www.dataviva.info/pt/data/
» https://www.dataviva.info/pt/data/ -
Dogan B.; Balsalobre-Lorente D.; & Nasir, M. A. (2020). European commitment to COP21 and the role of energy consumption, FDI, trade and economic complexity in sustaining economic growth. J Environ Manage. Nov 1; 273: 111146. doi: 10.1016/j.jenvman.2020.111146.
» https://doi.org/10.1016/j.jenvman.2020.111146 -
European Council. Climate change: what the EU is doing. Available at: Available at: https://www.consilium.europa.eu/en/policies/climate-change/ . Accessed oct. 2024.
» https://www.consilium.europa.eu/en/policies/climate-change/ - Freitas, E.; Romero, J. P.; Britto, G.; Stein, A.; Torres, R. (2023). DataViva: espaço de atividades e indicadores regionais de complexidade econômica. Cedeplar Working Paper, n. 657.
- Freitas, E.; Britto, G.; Amaral, P. V. M. (2024). Related industries, economic complexity, and regional diversification: An application for Brazilian microregions. Papers in Regional Science, p. 100011-23.
- Greene, W.H. (2008). Econometric Analysis. 6 ed. New Jersey: Prentice Hall.
-
Hartmann, D.; Guevara, M. R.; Jara-Figueroa, C.; Aristarán, M.; Cesar Hidalgo. (2017). Linking Economic Complexity, Institutions, and Income Inequality. World Development, 93, (C), 75-93. http://dx.doi.org/10.1016/j.worlddev.2016.12.020 .
» http://dx.doi.org/10.1016/j.worlddev.2016.12.020 - Hausmann, R.; Hidalgo, C. A. (2010). Country diversification, product ubiquity, and economic divergence. Working Papers Center for International Development at Harvard University, CID Working Paper no 201.
- Hidalgo, C.; Hausmann, R. (2009). The building blocks of economic complexity. Proceedings of the National Academy of Sciences of the United States of America, 106(26), 10570-10575.
- Iasco-Pereira, H. C., & Morceiro, P. C. (2024). Industrialization and deindustrialization: an empirical analysis of some drivers of structural change in Brazil, 1947-2021. Brazilian Journal of Political Economy, 44.
-
Ibrahim, R. L.; Al-Mulali, U.; Ozturk, I.; Bello, A. K.; Raimi, L. (2022) On the criticality of renewable energy to sustainable development: Do green financial development, technological innovation, and economic complexity matter for China? Renewable Energy, vol. 199, p. 262-277, https://doi.org/10.1016/j.renene.2022.08.101 .
» https://doi.org/10.1016/j.renene.2022.08.101 -
Ikram, M.; Xia, W.; Fareed, Z.; Umer, S.; Rafique, M. Z. (2021). Exploring the nexus between economic complexity, economic growth and ecological footprint: Contextual evidences from Japan. Sustainable Energy Technologies and Assessments. 47 (13). 101460. 10.1016/j.seta.2021.101460.
» https://doi.org/10.1016/j.seta.2021.101460 -
Intergovernmental Panel on Climate Change (IPCC). Climate Change 2023: Synthesis Report. IPCC, Geneva, Switzerland, pp. 35-115, doi: 10.59327/IPCC/AR6-9789291691647
» https://doi.org/10.59327/IPCC/AR6-9789291691647 -
Ipeadata. Available at: Available at: http://www.ipeadata.gov.br/Default.aspx . Accessed oct. 2024.
» http://www.ipeadata.gov.br/Default.aspx -
Ipeadata. Disponível em: Disponível em: http://www.ipeadata.gov.br/Default.aspx . Accessed sept. 2024.
» http://www.ipeadata.gov.br/Default.aspx -
Kuschnig, N.; Cuaresma, J. C.; Krisztin, T. & Giljum, S. (2021). Spacial spillover effects from agriculture drive deforestation in Mato Grosso, Brazil. Nature Scientific Reports. 11: 21804. doi.org/10.1038/s41598-021-00861-y.
» https://doi.org/10.1038/s41598-021-00861-y -
MapBiomas. Estatísticas do Monitor do Fogo. Disponível em: Disponível em: https://brasil.mapbiomas.org/ . Accessed sept. 2024.
» https://brasil.mapbiomas.org/ -
Mardani, A.; Streimikiene, D.; Cavallaro, F.; Loganathan, N.; Khoshnoudi, M. (2019). Carbon dioxide (CO2) emissions and economic growth: a systematic review of two decades of research from 1995 to 2017. Sci. Total Environ., 649, 31-49. doi.org/10.1016/j.scitotenv.2018.08.229
» https://doi.org/10.1016/j.scitotenv.2018.08.229 - Nassif, A.; Feijó, C. & Araújo, A. (2015). Cambridge Structural change and economic development: is Brazil catching up or falling behind? Cambridge Journal of Economics. Vol. 39, Nº. 5, 1307-1332.
-
Prebisch, R. The Economic Development of Latin America and its principal problems. (1949). United Nations Publications, p. 1-49, Available at: < https://repositorio.cepal.org/bitstream/handle/11362/30088/S4900192_en.pdf >.
» https://repositorio.cepal.org/bitstream/handle/11362/30088/S4900192_en.pdf -
RAD. (2023). Relatório Anual de Desmatamento. Disponível em: https://alerta.mapbiomas.org/wp-content/uploads/sites/17/2024/10/RAD2023_COMPLETO_15-10-24_PORTUGUES.pdf
» https://alerta.mapbiomas.org/wp-content/uploads/sites/17/2024/10/RAD2023_COMPLETO_15-10-24_PORTUGUES.pdf -
Ribeiro, V. L. (2024). América Latina: desenvolvimento, dependência e o papel do capital chinês. Economia e Sociedade, 33(3), e282023. https://doi.org/10.1590/1982-3533.2024v33n3.282023
» https://doi.org/10.1590/1982-3533.2024v33n3.282023 -
Richardson, K. et al. (2023). Earth beyond six of nine planetary boundaries. Science Advances, 9, eadh2458. https://doi.org.10.1126/sciadv.adh2458
» https://doi.org.10.1126/sciadv.adh2458 -
Ritchie, H. (2020). Sector by sector: where do global greenhouse gas emissions come from? Available at: Available at: https://ourworldindata.org/ghg-emissions-by-sector . Accessed oct. 2024.
» https://ourworldindata.org/ghg-emissions-by-sector -
Romeiro, A. R. (2012). Desenvolvimento sustentável: uma perspectiva econômico-ecológica. Estudos Avançados, 26(74), 65-92. https://doi.org/10.1590/S0103-40142012000100006
» https://doi.org/10.1590/S0103-40142012000100006 -
Romero, J. P.; Gramkow, C. Economic complexity and greenhouse gas emissions. (2021). World Development, vol. 139. https://doi.org/10.1016/j.worlddev.2020.105317
» https://doi.org/10.1016/j.worlddev.2020.105317 - Romero, J. P.; Freitas, E.; Silveira, F.; Britto, G.; Cimini, F.; Jayme Jr, F. G. (2024). Complexity-based diversification strategies: a new method for ranking promising activities for regional diversification. Spatial Economic Analysis, p. 1-24.
-
SEEG. Análise das Emissões Gases de Efeito Estufa e suas implicações para as metas climáticas no Brasil (1970-2021). (2023). Observatório do Clima. Available at: Available at: https://seeg.eco.br/dados/ . Accessed oct. 2024.
» https://seeg.eco.br/dados/ -
SEEG. Sistema de Estimativa de Gases de Emissões e Remoções de Gases de Efeito Estufa. Available act: Available act: https://seeg.eco.br/dados/ . Accessed oct. 2024.
» https://seeg.eco.br/dados/ -
Shahzad, U., Fareed, Z., Shahzad, F., Shahzad, K., (2021). Investigating the nexus between economic complexity, energy consumption and ecological footprint for the United States: new insights from quantile methods. J. Clean. Prod. 279, 123806. https://doi.org/10.1016/j.jclepro.2020.123806 .
» https://doi.org/10.1016/j.jclepro.2020.123806 - Silveira, F.; Romero, J. P.; Queiroz, A. R.; Freitas, E.; Stein, A. (2025). Economic complexity and deforestation in the Brazilian Amazon. World Development, v. 185, p. 106804.
-
Simões, M. S.; Andrade, D. C. (2022). Complexidade econômica melhora a performance ambiental? Uma análise empírica usando o conceito de decoupling e suas diferenciações. Anais do 50º Encontro Nacional de Economia (Anpec/2022). Available at: Available at: https://en.anpec.org.br/previous-editions.php?r=encontro-2022 . Accessed oct. 2024.
» https://en.anpec.org.br/previous-editions.php?r=encontro-2022 -
Steffen, W., Crutzen, P. J., & McNeill, J. R. (2007). The Anthropocene: Are Humans Now Overwhelming the Great Forces of Nature? Ambio, 36(8), 614-621. http://www.jstor.org/stable/25547826
» http://www.jstor.org/stable/25547826 -
Steffen, W., Broadgate, W., Deutsch, L., Gaffney, O., & Ludwig, C. (2015). The trajectory of the Anthropocene: The Great Acceleration. The Anthropocene Review, 2(1), 81-98. https://doi.org/10.1177/2053019614564785
» https://doi.org/10.1177/2053019614564785 -
Swart, J., Brinkmann, L. (2020). Economic Complexity and the Environment: Evidence from Brazil. In: Leal Filho, W., Tortato, U., Frankenberger, F. (eds) Universities and Sustainable Communities: Meeting the Goals of the Agenda 2030. World Sustainability Series. Springer, Cham. https://doi.org/10.1007/978-3-030-30306-8_1
» https://doi.org/10.1007/978-3-030-30306-8_1 -
Tsai, D., Potenza, R., Quintana, G., Cardoso, A. M., Alves, P., Barcellos e Silva, F., Graces, I., Sousa, H., Coluna, I., Oliveira, J. (ICLEI), Zimbres, B., Shimbo, J., Silva, C., Silva-Junior, C., Silva, W., Alencar, A. (Ipam), & Angelo, C. (OC). (2024). Análise das emissões de gases de efeito estufa e suas implicações para as metas climáticas do Brasil: 1970-2023. SEEG. https://seeg.eco.br/wp-content/uploads/2024/11/SEEG-RELATORIO-ANALITICO-12.pdf
» https://seeg.eco.br/wp-content/uploads/2024/11/SEEG-RELATORIO-ANALITICO-12.pdf -
World Bank (2024). Indicators: Economy & Growth. Available at: Available at: https://data.worldbank.org/indicator . Accessed ago. 2024.
» https://data.worldbank.org/indicator - WWF World Wide Fund for Nature. (2022). Living Planet Report 2022 - Building a nature-positive society. Almond, R.E.A., Grooten, M., Juffe Bignoli, D. & Petersen, T. (Eds). WWF, Gland, Switzerland.
-
Zhen, N. and Freire, C. (2023). The Interlinks Between the Economic Complexity and Carbon Footprint, UNCTAD Background Paper, United Nations Conference on Trade and Development, Geneva. Available at: Available at: https://unctad.org/system/files/non-official-document/tir2023_background4_en.pdf . Accessed oct. 2024.
» https://unctad.org/system/files/non-official-document/tir2023_background4_en.pdf
-
1
Greenhouse gases (GHGs) trap heat in the atmosphere, helping maintain Earth’s temperature, but their rising concentration from human activities has intensified global warming. The main GHGs are carbon dioxide (CO2), produced by fossil fuel combustion and cement production, methane (CH4) (from agriculture and industry), and nitrous oxide (N2O) (from biomass burning, industry, and livestock) ( Ritchie, 2020 ).
-
2
The term Anthropocene, although increasingly used, has not yet been officially adopted by the International Union of Geological Sciences. Originally formulated by Paul Crutzen and Eugene Stoermer in the early 2000s, it is based on the recognition that humanity is the determining agent in changes to natural systems ( Steffen et al., 2007 ).
-
3
The original CKA refers to the works of Kuznets (1955, 1966), who suggested the hypothesis of the existence of an inverted “U” shaped relationship between inequality and the level of per capita income.
-
4
The world’s largest emitters in 2022 were: China (25.88%), the United States (11.13%), India (6.67%), the European Union countries (6.22%), Russia (3.79%), Indonesia (3.11%), Brazil (3.09%), and Japan (2.24%). Together, these countries account for approximately 56% of global emissions ( Climate Watch, 2024 ).
-
5
Further details on the methodology and the calculation of the complexity indexes for Brazilian states can be found in Freitas et al. (2023 ).
-
JEL Classification:
F6; L16; Q54.

 Source: Author’s own elaboration based on SEEG data (
  Source: Author’s own elaboration based on SEEG data (
  Source: Author’s own elaboration based on SEEG data (
  Source: Author’s own elaboration based on SEEG data (