
 Personal insurance and open supplementary pension in Brazil: A study on mortality differentials by education level
ABSTRACT
This study aims to verify whether the inequalities by education level found in the population as a whole are also confirmed among those who subscribed to personal insurance and/or open private pension plans in Brazil between 2012 and 2017. This study is a trailblazer in estimating mortality differentials by education level in populations with personal insurance and open private pensions in Brazil. The research contributes to the understanding of socioeconomic factors related to living conditions and, consequently, mortality. The results show that, even in a population that records lower mortality rates and higher life expectancies when compared to the Brazilian population as a whole, education level plays a major role as a protective factor. Population and death data were provided by 23 insurance groups. Through an agreement with the Ministry of Labor and Social Security, the Applied Mathematics Laboratory of the Federal University of Rio de Janeiro (LabMA/UFRJ) provided the list of insured people to this ministry, data was cross-referenced with government information and returned to the LabMA/UFRJ with identification of education level, when available, as well as indication of deceased, completing company records. Mortality tables were then drawn up for the insured population by education level. To obtain smoothed tables, Heligman and Pollard’s law was applied using a Bayesian approach, via Markov Chain Monte Carlo (MCMC) simulation. In the period from 2012 to 2017, among Brazilians who took advantage of personal insurance and open supplementary pensions, men with a high education level had, at the age of 60, a life expectancy of 5.6 and 6.6 years greater than those with a lower education level, in mortality and survival coverage, respectively. In the case of women, the comparison between the most educated and the least educated shows a difference of 2.7 years in mortality coverage and 5.4 years in survival coverage.
Keywords:
life tables; insurance market; mortality; education level
RESUMO
O objetivo deste estudo é verificar se as desigualdades por nível educacional encontradas na população em geral também se confirmam entre aqueles que aderiram aos seguros de pessoas e/ou previdência privada aberta no Brasil entre 2012 e 2017. Este estudo é precursor na estimativa dos diferenciais de mortalidade por nível educacional em populações com seguros de pessoas e previdência privada aberta no Brasil. A pesquisa contribui com a compreensão dos fatores socioeconômicos relacionados às condições de vida e, consequentemente, à mortalidade. Os resultados mostram que, mesmo em uma população que registra taxas de mortalidade mais baixas e expectativas de vida mais elevadas em comparação à população brasileira em geral, o nível educacional tem um papel relevante como fator protetivo. Os dados de população e de óbitos foram fornecidos por 23 grupos seguradores. Por meio de um acordo com o Ministério do Trabalho e Previdência Social, o Laboratório de Matemática Aplicada da Universidade Federal do Rio de Janeiro (LabMA/UFRJ) forneceu a lista dos segurados a esse ministério, os dados foram cruzados com informações governamentais e devolvidos ao LabMA/UFRJ com a identificação de escolaridade, quando disponível, bem como a indicação dos falecidos, completando os registros das empresas. Em seguida, foram elaboradas tábuas de mortalidade da população segurada por nível educacional. Para obtenção de tábuas suavizadas, foi aplicada a lei de Heligman e Pollard com abordagem bayesiana, via simulação de Markov Chain Monte Carlo (MCMC). No período de 2012 a 2017, dentre os brasileiros que usufruíam dos seguros de pessoas e de previdência complementar aberta, os homens com alta escolaridade tinham, aos 60 anos, uma expectativa de vida de 5,6 e 6,6 anos maior em comparação àqueles menos escolarizados, nas coberturas de mortalidade e sobrevivência, respectivamente. No caso das mulheres, a comparação entre as mais escolarizadas e as menos escolarizadas mostra uma diferença de 2,7 anos na cobertura de mortalidade e 5,4 anos na cobertura de sobrevivência.
Palavras-chave:
tábuas de vida; mercado segurador; mortalidade; escolaridade
1. INTRODUCTION
The insurance market in Brazil has been experiencing great progress in terms of the variety of products offered. Among the most sought after in recent years are personal insurance plans and open private pension plans, which include various coverage types, among them survival and death (Superintendência de Seguros Privados [SUSEP], 2022a, 2022b, 2023).
In the case of survival coverage, in personal insurance, the payment of the insured capital occurs when the insured person survives the contracted deferral period; in death coverage, a beneficiary is appointed to receive the insured capital upon their death. As an example of an insurance plan for people with survival coverage, we may mention the Vida Gerador de Benefício Livre (VGBL); and with death coverage, life insurance. Open supplementary pensions follow the same logic, it is possible to guarantee the payment of a benefit to the plan participant themselves (survival coverage) or to their beneficiaries (death coverage) (SUSEP, 2022a; 2023).
To establish how much the insured must pay so that they or their beneficiaries can receive these amounts (in the form of a single payment or income), actuarial calculations are carried out based on mortality tables, an instrument that allows measuring the probability of death and survival of a population by age and sex. Brazil has tables prepared by the Brazilian Institute of Geography and Statistics (IBGE), however, the insured population has very specific characteristics, which generally result in considerably higher life expectancies than the population as a whole (Foz, 2021).
According to estimates from the Instituto Brasileiro de Geografia e Estatística (IBGE, 2022), in 2021, men in Brazil had a life expectancy at birth of 73.6 years and women of 80.5 years. In the case of the Brazilian Insurance Market Life Tables (BR-EMS), a life expectancy at birth of 81.1 years for men and 86.5 years for women was observed when the insured took advantage of survival products; and 78.3 years for men and 83.2 years for women, when considering only policyholders who subscribed to products with mortality coverage (SUSEP, 2021).
According to Oliveira et al. (2016), the mortality experience of the insured population in Brazil is similar to that in developed countries, such as the United States of America (USA) and the United Kingdom. But even in populations with better living conditions, there is a vast literature that points out major differences in mortality by education level. This is the case in countries such as Germany (Luy et al., 2015), Norway (Steingrímsdóttir et al., 2012), Australia (Welsh et al., 2021), and the USA (Hendi, 2015), where studies reveal that people with higher education have lower mortality rates and, consequently, higher life expectancy at birth.
Therefore, even though they already have a higher life expectancy than the population as a whole, such evidence leads us to ask whether there are also differences in mortality by education level in the insured population in Brazil, i.e. among those who subscribe to personal insurance and/or open private pension. It is already known that Silva et al. (2016) found a significant mortality differential by level of education for the Brazilian population, but it is worth mentioning that Brazil is considered one of the most unequal countries in the world (Campello et al., 2018). Considering that the insured population in Brazil is a group with better living conditions, this study aims to verify whether the inequalities by education level found in the general opulationn are also confirmed among those who subscribe to personal insurance and/or open private pension plans in Brazil between 2012 and 2017.
2. INEQUALITIES IN MORTALITY BY EDUCATION LEVEL
The reduction in mortality levels is a phenomenon that began at the end of the 18th century, first in the most economically developed countries and, over time, reached other locations. According to the literature, there are two main explanations for this decline: one emphasizes the contribution of medical innovations and the implementation of public health programs, while the other points out the contributions of economic development and improved living conditions with regard to the population’s health (Alves, 2002).
According to Alves (2002), these contributions are not exclusive and recent studies (Kaplan et al., 2014; Woolf et al., 2007) have shown how relevant social changes have been in this process. Kaplan et al. (2014), for instance, report that in the USA, medical care explains about 10% of the variation in health outcomes, while social factors explain almost 50%. An example can be seen in the study by Chetty et al. (2016), who analyzed the association between income and life expectancy in the USA. The authors showed that, at 40 years of age, the difference in life expectancy between individuals in the top and bottom 1% of the income distribution in the USA is up to 15 years for men and 10 years for women. Such evidence makes clear why mortality differentials related to socioeconomic status are at the center of the US public health agenda (Montez et al., 2012).
Regarding this issue, Montez et al. (2012) reveal that, among the available options, education level is the main socioeconomic indicator to analyze differences in mortality and health in the adult population. According to the authors, this occurs for a number of reasons, including the fact that education level usually precedes occupation, income, and wealth accumulation, both in the life course and causal sense. Furthermore, people tend to complete their studies at the beginning of adulthood, a situation that remains constant until the end of life, quite different from occupation, income, and wealth accumulation, which can vary considerably during a person’s lifetime.
Another issue raised by Montez et al. (2012) is related to quality of information, as people tend to report their education level more frequently and accurately than other socioeconomic indicators. Even so, Guedes et al. (2011) mention that it is common to find a high proportion of undeclared information about people’s education in administrative databases, which requires the adoption of techniques capable of overcoming the problem and generating good estimates.
This is the case of the study produced by Grigoriev et al. (2019), who analyzed socioeconomic differences in mortality in Germany using data from a Pension Fund. According to the authors, there were around 40% missing values for the education variable, mainly because people who were unemployed (or out of the job market for other reasons) did not have an employer to report educational information, which led the authors to apply an imputation method so that the analysis could be carried out without compromising the results.
Contributing to studies on inequality in mortality, Currie and Schwandt (2016) add that life expectancy and mortality by age (or age group) are measures that can be used to capture this difference. Furthermore, as there are differences in mortality levels and trends between men and women, the ideal is to analyze the estimates separated by sex.
However, what exactly is the role that education plays in reducing mortality? According to Kingston et al. (2003), the schooling process contributes to the cognitive development of human beings, leading them to read, write, and communicate, in addition to thinking logically, critically analyzing data, solving problems, and implementing plans. Although a high education level does not automatically confer better health, Montez and Friedman (2015) state that education can influence a population’s health in many ways.
Woolf et al. (2007), for instance, mention that the population with a higher education level is more able to grasp health information and, consequently, make choices related to self-care more efficiently, such as having better eating habits, grasping the importance of practicing physical activity, knowledge about the harms of smoking, among others. In addition to behavioral issues, Woolf et al. (2007) claim that people with a higher education level generally have jobs with higher wages and, therefore, are more able to purchase health insurance, pay for medical expenses, and even live in locations that have fewer health risks (with access to basic sanitation, for instance).
As a result, the topic has been widely explored in the international literature and a series of studies indicate an inverse association between education level and death risk, with evidence found for countries on many continents and at different development levels. Furthermore, the extent to which this association is expressed in survival gains has been discussed (V. Raghupathi & W. Raghupathi, 2020; Sudharsanan et al., 2020; Yang et al., 2019).
In high-income countries, such as Germany, Luy et al. (2015) identified that life expectancy at age 40 for the highly educated group was 6.3 years higher for men and 2.3 years higher for women, compared to that of people with low education. In Norway, the difference found by Steingrímsdóttir et al. (2012) was also significant: life expectancy at age 35 for people with tertiary education (Higher Education) was higher by 6.1 years for men and 3.2 years for women, compared to that of people who only had Primary Education. In the USA, the results of Hendi (2015) showed that life expectancy at age 25 for those who attended college was 10.2 years higher for men and 9.7 years higher for women, compared to those who had not completed High School.
In Australia, the study by Welsh et al. (2021) detected differences in life expectancy at age 25 between those with the highest and lowest education level of 9.1 years for men and 5.5 years for women. To better assess this difference, the authors mention that the reported life expectancy at age 25 for men with the lowest education level in 2016 is equivalent to that of all men at age 25 in 1998 (52.4 years), while for women the equivalent year is 2001 (58.3 years), i.e. those with the lowest education level have a life expectancy equivalent to the national average of 15 or 20 years ago.
Seeking to discover whether there are similar gradients in mortality in middle-income countries, where education and health quality tend to be lower, Sudharsanan et al. (2020) carried out the analysis for six countries: China, Costa Rica, Indonesia, Mexico, South Africa, and South Korea. In summary, the authors found that, although mortality and risk factor gradients show a different pattern to those in high-income countries, adults with Higher Education have a consistent mortality advantage when compared to those with no school education.
Also in the context of developing countries, Sandoval et al. (2022), when examining the association between education and mortality in Chile, concluded that people with High School education and Higher Education have risk rates 34% and 41% lower when compared to those with incomplete Primary Education. In Brazil, this inequality is repeated: Silva et al. (2016) found an increased life expectancy for people with Higher Education equivalent to 6.27 years for men and 2.25 years for women when compared to those who had less than complete Primary Education.
This is an especially important topic for Brazil, due to the profound educational transition that has been taking place in the country in recent decades (Turra et al., 2016). According to data from the Organization for Economic Cooperation and Development (OECD, 2021), there was a drop in illiteracy rates and an increase in enrollment rates at all education levels, especially in Higher Education, which, between 2010 and 2020, had 35.5% growth in the number of enrollments across the country (Instituto Nacional de Estudos e Pesquisas Educacionais Anísio Teixeira [INEP], 2022). These variations translate into differences in life expectancy. Such evidence is pointed out by Turra et al. (2016), who discovered that changes in the educational profile of the female population in Brazil over the last five decades have increased life expectancy at age 30 by around 38%.
In addition to this study for the female population (Turra et al., 2016), other studies for specific groups were carried out to estimate mortality differentials by education level in Brazil, addressing the death causes (Barreto et al., 2021) and various geographic areas (Ribeiro et al., 2021; Silva et al, 2016), given that increases in life expectancy show significant disparities between population groups (Hummer & Hernandez, 2013).
In this context, there is a gap in scientific production on differences in mortality by education level in the insured Brazilian population. According to Kwon and Jonesy (2006), information regarding mortality is essential for actuarial work related to life insurance and pensions. These authors, who carried out a study for Canada, mention that taking into account the difference in mortality or longevity risk among policyholders may contribute to more efficient risk management, calculation of more appropriate provisions, in addition to offering more equitable premiums for policyholders in various risk classes.
An example is the case of Sweden, where, although socioeconomic inequalities in health and mortality are among the lowest in Europe, up to ¼ of inequality in lifetime pensions is attributable to the greater longevity of socially advantaged groups (Shi & Kolk, 2022), corroborating the importance of factors like education and income in studies on mortality differentials.
3. MATERIALS AND METHODS
3.1 Data Sources and Variables Used
This study is based on data referring to the population covered by private insurance (personal insurance and/or open supplementary pension) in Brazil within the period from 2012 to 2017, obtained through a confidentiality agreement between the Applied Mathematics Laboratory of the Federal University of Rio de Janeiro (Laboratório de Matemática Aplicada da Universidade Federal do Rio de Janeiro [LabMA/UFRJ]) and 23 insurance groups associated with the National Federation of Private Pensions and Life (Federação Nacional de Previdência Privada e Vida [FenaPrevi]). This data contains some information about the insured individuals (CPF, sex, and date of birth), as well as information that allows the identification of the insurance contracts signed between them and the insurers, such as entry and end date of the contract, as well as coverage type (mortality or survival products). When the contract is terminated, the reason for termination is informed, which makes it possible to identify deaths.
However, it is worth noticing that not all deaths are reported to insurance companies. To address this issue, the LabMA/UFRJ maintains a cooperation agreement with the Ministry of Labor and Social Security (Ministério do Trabalho e Previdência Social, currently named Ministry of Labor and Employment [Ministério do Trabalho e Emprego]), which makes it possible to verify death data in rather complete government databases. For this purpose, the LabMA sends the list of the insured’s CPFs to the ministry and the federal agency carries out a consultation of government databases, indicating the date of death of the deceased, as well as their education level, when available.
Data relating to exposure and deaths were organized taking into account 3 variables, namely, coverage type (mortality or survival), the insured’s sex (male or female), and education level, which was aggregated into 3 categories:
-
Level 1: Up to incomplete High School;
-
Level 2: Complete High School or incomplete Higher Education; and
-
Level 3: Complete Higher Education or Graduate Studies.
Furthermore, due to the scarcity of data on some of the combinations of these variables, policyholders were grouped into five-year age groups. Considering that it is not possible to construct life tables by education level for children and teenagers, as they are still of school age, and that, according to data from the Censo da Educação Superior 2017 (INEP, 2019), the average age of graduates of undergraduate courses in Brazil is 28 years in face-to-face learning and 35 years in distance learning, with the minimum age group being defined as 40-44 years in this study, as it is rare for a person to change education level after this age. Regarding the upper threshold, the age group 75-79 years was defined, as data above this age are very scarce, making it impossible to provide reliable estimates for mortality levels for each of the education levels, sexes, and product types.
3.2 Treatment of Missing Data
Checking data from insurance companies with government databases made it possible to obtain information on the education level of policyholders for 62.2% of the exposed population (denominator of mortality rates) and 79.2% of deaths (numerator of mortality rates). Information on education level from government databases is associated with people who are registered in these databases and have already received federal benefits. Figure 1 shows the distribution of no information on deaths and exposed population by age groups and sex. The exposure of the population without information on education follows a distribution close to that observed among those with information on education. In relation to deaths, the proportion of non-information is higher among people of advanced ages, from 70 years old onwards.

Distribution of data with and without education information by age group according to sex and coverage type.
Given the high percentage of non-information, it was necessary to make the imputation using the distributions of education levels in a segment of the insured population with a high level of information to infer the missing data.
There are three main types of missing data and it is important to understand the reasons for the existence of this data so that proper treatment can be applied. These types are: Missing completely at random (MCAR), Missing at random (MAR), and Missing not at random (MNAR) (Little & Rubin, 2019). If the missing data is of the MCAR type, we can conclude that data existing in the sample is representative of the population and, therefore, the missing data does not need to be treated. This assumption is usually unrealistic in practical problems. The MAR case considers samples whose lack of data is not random, however, there are other variables whose information can be used to complete the data in order to make the analysis unbiased. Finally, the MNAR occurs when there is a reason for missing data that is related to the variable of interest, resulting in analyses that may be biased. According to Little and Rubin (2019), there are three main methods for handling missing data: imputation, omission, and analysis. In the case of mortality by education level, it is assumed that the missing data is of the MAR type. However, a partial sample of subpopulations for which almost all data was observed was considered and, therefore, the analysis of frequencies at each education level can be considered unbiased. After estimating the probabilities of belonging to each education class, the missing data was completed according to the relative frequencies observed in the auxiliary sample considered complete. The MNAR assumption could be considered, however, it is difficult to verify and extreme scenarios, for instance, that considered all missing data as coming from the lowest education level would lead to an unrealistic insured population, since this is a generally more privileged one. At another extreme, if it is considered that all the missing data come from higher education levels, we would have numbers of Brazilians with Higher Education that do not match the national reality. Thus, it is believed that the MAR assumption encompasses a rather realistic scenario that distributes missing data proportionally using subpopulations with more complete data as a basis.
The information used in the article refers to 511 subpopulations consisting of the company-year-coverage combination. It was possible to obtain education data for all subpopulations, 411 of which (80%) were partially used to construct the estimates used to impute the missing data. It is worth emphasizing that for no subpopulation it was possible to obtain complete data on education level. In this way, the imputation of missing information was made considering only education data with a satisfactory quality in the combination of age group and sex, which implies the partial contribution of each subpopulation, guaranteeing consistency in the estimation and proportions of interest.
To carry out the imputation, acceptable limits of non-information were defined, and for exposure data, a minimum threshold of 82% of information available for survival products and 85% for mortality products was established. In the case of deaths, the minimum threshold was 90% of information available, both for survival and mortality products.
After identifying the distributions of expected education levels for groups with a high information level, the data that originally did not have educational information in the database were imputed and could, therefore, be incorporated into this study. Since the imputation was built through the combination of the best data from each subpopulation, it is believed that biases are minimized.
3.3 Methodological Procedures Applied to the Preparation of Tables by Education Level
After imputing the missing information, a descriptive analysis of the data used was carried out, with the aim of seeing how these observations are distributed. Mortality and survival tables were then prepared, with the purpose of estimating death probabilities (qx) and life expectancies (ex) of those who subscribed to personal insurance and/or private pensions open in Brazil between 2012 and 2017, by education level.
Not infrequently, building mortality tables requires the use of principles and methods so that the data can progress smoothly from age to age and, at the same time, accurately reflect the underlying mortality pattern (Lobo et al., 2022). This procedure is known in the actuarial literature as graduation and can be carried out using parametric and non-parametric methods (Bravo, 2007).
In this research, to obtain smoothed tables, the graduation of the mortality pattern by age was carried out using a parametric model proposed by Heligman and Pollard (1980), which has been widely used in research on mortality. This model, which has been adopted to prepare insurance market tables, was considered the most appropriate by Oliveira et al. (2012) among other options, based on the criteria of parsimony, intelligibility, replicability, stability of the methodology, transparency, self-sufficiency and compatibility between static and dynamic tables. The choice of model was maintained for the insurance market tables by education level.
Structurally, the Heligman and Pollard model is divided into 3 distinct terms, each one highlighting a component of mortality, in which, together, encompass 8 parameters:

-
Infant mortality: the parameter A represents the mortality level, B represents the age shift for a child’s mortality (age 1), and C is related to decline in the mortality rate throughout childhood;
-
Mortality of young adults: the parameters D, E, and F represent, respectively, the severity, extension, and location of the accident curve;
-
Mortality of adults in advanced age: the parameter G is the basic level of senescent mortality and H is the increase rate of this mortality.
As this study only covers the population over 40 years of age, this mathematical expression (also known as mortality law) was applied only to adult ages, i.e. without the first term of the curve (infant mortality). Lobo et al. (2022) mention that, in this case, the size of parameters is reduced, and this increases the acceptance rate and causes the algorithm to converge faster. Furthermore, as the parameters A, B, and C in the first term are not significant (since these ages are not part of the study), the fitted curve is not affected.
To deploy the model, the statistical software R, version 4.1.2, was used, which, through the BayesMortalityPlus package, is capable of modeling Heligman and Pollard’s law considering the Bayesian approach, via Markov Chain Monte Carlo (MCMC) simulation. The first step in this direction was to estimate the model parameters using the hp( ) function, by means of information regarding the insured’s age, exposure, and deaths. It is worth highlighting that deaths were considered random variables with binomial distribution that, according to Oliveira et al. (2012), is one of the most used for modeling that involves deaths or survival in life tables. With regard to age, as the data were organized by age group (40-44, 45-49, ..., 75-79), the midpoint of each one (42, 47,..., 77) was used in the role to represent the group as a whole. However, as the model allows estimating the mortality curve for any age x between 40 years and the end of the table, it is possible to obtain the output of the death probabilities for any simple age.
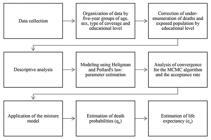
After estimating the parameters, verifying convergence for the MCMC algorithm and the acceptance rate, death probabilities were estimated. Due to the scarcity of information disaggregated by age, sex, coverage type, and education at older ages, it was necessary to apply a mixture model (Frühwirth-Schnatter, 2006), i.e. to use a function that combines these death probabilities adjusted by the HP model for ages 40 to 64 with the BR-EMS death probabilities for closing the table, from age 65 onwards. Next, death probabilities (qx) and life expectancies (ex) were obtained by the insured’s education level. A summary of the entire process can be seen in Figure 2. The results are shown below.
4. RESULTS
Figure 3 shows that the insured population in Brazil has a lower death probability than the population as a whole, especially among those who have plans with survival coverage. In comparison with the mortality tables of beneficiaries from the National Social Security Institute (Instituto Nacional do Seguro Social [INSS]), for 2015, built by using Topals regression (Gonzaga et al., 2022), it is possible to observe that the male tables in the insurance market show lower death probabilities in both survival and mortality coverage up to age 90. In the case of women, the INSS mortality table shows a probability very close to that observed in death coverage; however, considering survival coverage, death probabilities in the insurance market are below those observed in the INSS until over 90 years of age. Since the IBGE life tables are calculated only up to the age group 80 years and over, for comparison purposes, this study used the extrapolated 2013 mortality tables, prepared by Castro (2018). The result found indicates that, in general, the insured population had a lower death probability in relation to Brazilians, as a whole, and in relation to INSS beneficiaries.

IBGE mortality tables for the Brazilian population, mortality tables for INSS beneficiaries (2015) from 65 years of age onwards and Mortality and survival tables for the insured population (BR-EMS 2021) from 40 years of age onwards, according to sex.
The distinction between the tables reveals that there are significant differences between population groups and, by adding other analysis variables, such as education, even more precise estimates of mortality in this segment can be obtained. In total, this study included more than 15 million records from participants in the Brazilian insurance market, referring to people who subscribed to a product with death (77.6%) or survival (22.4%) coverage between 2012 and 2017. The majority consists of males, whose sex ratio is equivalent to 116.4 in the exposed population (i.e. there are 116.4 men for every group of 100 women), while among deaths this number rises to 176. The age group with the highest concentration of insured people is 40-44 years old and as age increases, the total number of insured people also decreases. In relation to deaths, this data is reversed and the group aged 40-44 years old starts to show the lowest number of deaths and the highest number is among the elderly aged 60-64 years old (Table 1).
The analysis of the composition of the insured population aged 40 to 79 years by education level reveals that, regardless of gender and coverage type, the largest part refers to people with up to incomplete High School (level 1), mainly in death coverage. The only exception is women with survival products, many of whom have complete Higher Education (level 3) (Figure 4).

Composition of the exposed population aged 40 to 79 years, according to sex, coverage, and education level, 2012-2017
As for the occurrence of death, Figure 5 shows that there is an inverse relationship between mortality and education, considering that mortality decreases with an increased education level. Another key observation is that the mortality rate of those who subscribed to death coverage is higher when compared to that of insured people who subscribed to survival coverage (at the same education level).
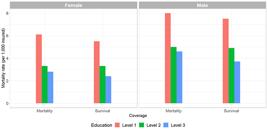
Mortality rate per 1,000 insured people aged 40 to 79 years, according to sex, coverage, and education level, 2012-2017
Based on this observation, it is interesting to highlight that education has a greater impact on reducing mortality than coverage type. The BR-EMS tables are divided into ‘mortality’ and ‘survival’ precisely because there is a difference in mortality levels between participants in these coverage types. However, as it can be seen, the difference between the least educated men in mortality coverage (8.0 per 1,000/insured) and survival (7.5 per 1,000/insured) males, for instance, is only 0.5 between rates. In the case of education, the difference is much greater, reaching 3.4 between the least educated (8.0 per 1,000/insured) and the most educated (4.6 per 1,000/insured) males with mortality coverage. Hypothesis tests were carried out and there is sufficient evidence at the 5% significance level to conclude that there is a difference between mortality rates.
Considering age, the main risk factor in the pricing of life and pension insurance, it is possible to verify this distribution more clearly. Figure 6 shows that, for young adults, mortality has significant differences between those with more and less education, a difference that tends to decrease with advancing age. This pattern exists for both male and female policyholders, whether they are participants in insurance with death or survival coverage.
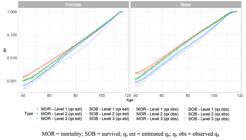
Death probabilities by age of insured people aged 40 and over, according to sex, coverage type, and education level, 2012-2017
It is also possible to observe such discrepancies through the analysis of life expectancy. Using the age of 60 years as a reference, it is observed that men with high education (level 3) have 5.6 years more life expectancy in mortality coverage and 6.6 years more in survival coverage, when compared to that of individuals with low education (level 1). The same occurs with women, who achieve gains of 2.7 years and 5.4 years for mortality and survival coverage, respectively (Table 2).
Although women have, at all education levels, higher life expectancy than men, mortality differentials show that the greatest survival gains were among men, in both coverage types, further highlighting the key role that Higher Education has a role in reducing mortality levels.
5. DISCUSSION
This study assesses whether there are differences in mortality by education level among those who subscribed to personal insurance and/or open private pension plans in Brazil between 2012 and 2017. The results provide a first estimate for this population segment, thus filling a major knowledge gap and contributing to advances in the area, considering that there is still a lack of research that relates the mortality of insured people to socioeconomic and behavioral risk factors.
Until recently, Brazilian insurance companies used tables based on the life expectancy of US residents to price life insurance and pension plans, because they were closer to their clients’ mortality standards than the tables calculated by the IBGE for the population as a whole (Foz, 2021). After creating the tables for the insurance market, Oliveira et al. (2016) and Oliveira et al. (2016, 2023) proved that they have much lower mortality levels when compared to those in the table for the population as a whole.
Therefore, the analysis of the specific segment, in this case of policyholders, already substantially changes the risk involved in actuarial calculations. So, the preparation of BR-EMS was a milestone for the insurance market, as the level and structure of mortality vary from population to population, this means that pension institutions and insurance companies now have a more reliable portrait of the profile of the insured population in Brazil (Oliveira et al., 2012). Although the pension mentioned herein is private, it is worth mentioning that Gonzaga et al. (2022) also found higher life expectancy for beneficiaries of the General Social Security Regime (Regime Geral de Previdência Social [RGPS]), which corroborates the importance of analyzing mortality in these population subgroups, aiming at the financial and actuarial balance of institutions.
However, traditionally, only information by age and sex appears in the table, which leads authors such as Brown and McDaid (2003) to question how many more refinements would be necessary and what would be appropriate to include. Several risk factors have been explored and identified in previous research (Montez et al., 2012), with education level considered the main socioeconomic indicator to analyze differences in mortality and health in the adult population.
In highly developed countries, such as Norway, for instance, Steingrímsdóttir et al. (2012) show that there is a major difference in the risk of dying between those with more and less education, especially men. In other words, even in populations with better living conditions, education represents a differential in health-related issues. A similar situation occurs with the insured population in Brazil, which, despite having a higher life expectancy than the population as a whole, as demonstrated in this study, shows discrepancies between death probabilities.
As this association is already widely disseminated in the literature, both nationally and internationally, it is convenient to include this risk factor in the analyses. As the results show, the life expectancy of insured people is always higher for those with complete Higher Education. When the analysis is carried out by sex, it appears that mortality differentials are greater among men than among women, even though they have a higher life expectancy. For the population as whole in Brazil, there is already evidence provided by Silva et al. (2016) of mortality differentials by education level. However, the authors work with life expectancy at 15 years of age, which makes comparison with the results presented herein, estimated for 60 years of age, unfeasible.
In addition to this analysis involving the Brazilian population, there is evidence that even in groups with better socioeconomic conditions, education still represents a major difference in death risk. This is the case introduced by Beltrão and Sugahara (2017), who analyzed the mortality of civil servants in the Executive Power and discovered that death probabilities for servants with Higher Education were lower than those for servants with High School education.
Hence, there is major variability in death risk, which must be taken into account. As mentioned, the building of a specific table for the insurance market was a major advance for the area, but there are still differences in mortality within this population: when comparing the estimates shown herein with the BR-EMS data, it is observed that people with complete Higher Education have a higher life expectancy than that contained in the table and the opposite is also true, i.e. less educated people have a lower life expectancy than that contained in BR-EMS.
For insurers, adequate measurement of mortality is of paramount importance, as it is one of the pieces of information used to calculate how much an insured person should pay for insurance or private pension. According to Westenberger and Gonçalves (1995), proper sizing of the premium allows the activity to be viable, guaranteeing not only profitability, but especially the formation of technical reserves. If people with Higher Education have a higher life expectancy than that displayed by the table, there may be a reserve formation below what is needed, considering that these people live longer and, in the case of subscribing to survival coverage with a lifetime income, for instance, they would receive the benefit for longer than planned by the insurer.
This is a kind of situation that can be detrimental to the actuarial and financial balance of operations, and can lead to insolvency in extreme cases. So, estimating mortality taking into account several factors, including education level, helps insurers to get even closer to the true risk and to keep business sustainability and fulfill its obligations.
6. FINAL REMARKS
During this research, common challenges emerged in several mortality studies that aim to disaggregate the populations studied by social and/or economic levels, such as the scarcity of more detailed and quality data. Although information on insured people’s education was not originally made available by insurance companies, it was obtained from government databases, which guaranteed a relatively high percentage of information on insured people’s education: 62.2% of the exposed population and 79.2% of deaths. In order to avoid the exclusion of missing data, it was decided to impute the education level, maintaining the proportions of existing information for both exposures and deaths.
The results showed consistency with national and international literature on t’e topic, with an increase in life expectancy and a drop in mortality as the education level increases, for both men and women. The biggest difference was observed among men who took advantage of mortality products: 6.6 years of extra life expectancy at age 60 for those who had Higher Education compared to those who had incomplete High School education.
This study fills a gap in terms of understanding a Brazilian population subgroup that enjoys better living conditions when compared to the population as a whole. However, the importance of formal education for reducing mortality is revealed, even among insured people. The results shown reveal that inequalities between education levels are greater than those observed between mortality and survival products. Thus, even though there are numerous challenges in collecting and making more detailed information available regarding the socioeconomic profile of insured people, and the percentage of non-information makes it mandatory to use resources for imputation and improving the quality of data, the potential of studies like this, which allow us to estimate with greater accuracy the differences in death risk of various population groups.
REFERENCES
-
Alves, J. E. D. (2002). A polêmica Malthus versus Condorcet reavaliada à luz da transição demográfica (Textos para Discussão n. 4). IBGE. https://biblioteca.ibge.gov.br/visualizacao/livros/liv1642.pdf
» https://biblioteca.ibge.gov.br/visualizacao/livros/liv1642.pdf -
Barreto, J., Silva, J. C. Q., Sposito, A. C., & Carvalho, L. S. (2021). O impacto da educação na mortalidade por todas as causas após infarto do miocárdio com supradesnivelamento do segmento ST (IAMCSST): Resultados do Brasília Heart Study. Arquivos Brasileiros de Cardiologia, 117(1), 5-12. https://doi.org/10.36660/abc.20190854
» https://doi.org/10.36660/abc.20190854 -
Beltrão, K. I., & Sugahara, S. (2017). Mortalidade dos funcionários públicos civis do Executivo por sexo e escolaridade ‒ 1993/2014. Revista Contabilidade & Finanças, 28(75), 445-464. https://doi.org/10.1590/1808-057x201704320
» https://doi.org/10.1590/1808-057x201704320 -
Bravo, J. M. V. (2007). Tábuas de mortalidade contemporâneas e prospectivas: Modelos estocásticos, aplicações actuariais e cobertura do risco de longevidade (Tese de Doutorado). Universidade de Évora. http://dspace.uevora.pt/rdpc/handle/10174/11148
» http://dspace.uevora.pt/rdpc/handle/10174/11148 -
Brown, R. L., & McDaid, J. (2003). Factors affecting retirement mortality. North American Actuarial Journal, 7(2), 24-43. https://doi.org/10.1080/10920277.2003.10596083
» https://doi.org/10.1080/10920277.2003.10596083 -
Campello, T., Gentilli, P., Rodrigues, M., & Hoewell, G. R. (2018). Faces da desigualdade no Brasil: um olhar sobre os que ficam para trás. Saúde em debate, 42(Esp 3), 54-66. https://doi.org/10.1590/0103-11042018S305
» https://doi.org/10.1590/0103-11042018S305 -
Castro, L. G. (2018). “Nota técnica sobre a metodologia adotada pelo Ministério da Previdência Social na extrapolação das Tábuas de Mortalidade IBGE para as idades acima de 80 anos, de autoria do atuário Luciano Gonçalves de Castro, MIBA nº 1.116, doutorando em demografia, mestre em estudos populacionais e pesquisas sociais, pesquisador - demógrafo da COPIS/DPE/IBGE”. http://sa.previdencia.gov.br/site/2015/06/NOTA-TECNICA-ATUARIAL-EXTRAPOLACAO-DA-TABUA-IBGE-MPS.pdf
» http://sa.previdencia.gov.br/site/2015/06/NOTA-TECNICA-ATUARIAL-EXTRAPOLACAO-DA-TABUA-IBGE-MPS.pdf -
Chetty, R., Stepner, M., Abraham, S., Lin, S., Scuderi, B., Turner, N., Bergeron, A., & Cutler, D. (2016). The association between income and life expectancy in the United States, 2001-2014. JAMA, 315(16), 1750-1766. https://doi.org/10.1001/jama.2016.4226
» https://doi.org/10.1001/jama.2016.4226 -
Currie, J., & Schwandt, H. (2016). Mortality inequality: The good news from a county-level approach. Journal of Economic Perspectives, 30(2), 29-52. https://doi.org/10.1257/jep.30.2.29
» https://doi.org/10.1257/jep.30.2.29 -
Foz, G. (2021). Métodos demográficos: Uma visão desde os países de língua portuguesa. Blucher. https://openaccess.blucher.com.br/article-list/9786555500837-504/list#undefined
» https://openaccess.blucher.com.br/article-list/9786555500837-504/list#undefined - Frühwirth-Schnatter, S. (2006). Finite mixture and Markov switching models. Springer.
-
Gonzaga, M. R., Lima, E. E. C., Queiroz, B. L., Ansiliero, G., & Freire, F. H. M. A. (2022). Diferenciais de mortalidade, beneficiários do Instituto Nacional do Seguro Social do Brasil em 2015. Revista Contabilidade & Finanças, 33(90). https://doi.org/10.1590/1808-057x20221556.pt
» https://doi.org/10.1590/1808-057x20221556.pt -
Grigoriev, P., Scholz, R. & Shkolnikov, V. M. (2019). Socioeconomic differences in mortality among 27 million economically active Germans: A cross-sectional analysis of the German Pension Fund data. BMJ Open, 9, e028001. http://dx.doi.org/10.1136/bmjopen-2018-028001
» http://dx.doi.org/10.1136/bmjopen-2018-028001 - Guedes, G. R., Siviero, P. C. L., Queiroz, B. L., & Machado, C. J. (2011). Approximating the educational differences in mortality: Demographic indirect techniques. Cadernos Saúde Coletiva, 19(2), 240-243.
-
Heligman, L., & Pollard, J. H. (1980). The age pattern of mortality. Journal of the Institute of Actuaries, 107(1), 49-80. https://www.cambridge.org/core/journals/journal-of-the-institute-of-actuaries/article/abs/age-pattern-of-mortality/080CA48AF00A73CE4D2888A6E1AA7385
» https://www.cambridge.org/core/journals/journal-of-the-institute-of-actuaries/article/abs/age-pattern-of-mortality/080CA48AF00A73CE4D2888A6E1AA7385 -
Hendi, A. S. (2015). Trends in U.S. life expectancy gradients: The role of changing educational composition. International Journal of Epidemiology, 44(3), 946-955. https://doi.org/10.1093/ije/dyv062
» https://doi.org/10.1093/ije/dyv062 -
Hummer, R. A., & Hernandez, E. M. (2013). The effect of educational attainment on adult mortality in the United States. Population Bulletin, 68(1), 1-16. https://www.ncbi.nlm.nih.gov/pmc/articles/PMC4435622/
» https://www.ncbi.nlm.nih.gov/pmc/articles/PMC4435622/ -
Instituto Brasileiro de Geografia e Estatística. (2022). Tábuas completas de mortalidade 2021. https://www.ibge.gov.br/estatisticas/sociais/populacao/9126-tabuas-completas-de-mortalidade.html?edicao=35598&t=resultados
» https://www.ibge.gov.br/estatisticas/sociais/populacao/9126-tabuas-completas-de-mortalidade.html?edicao=35598&t=resultados -
Instituto Nacional de Estudos e Pesquisas Educacionais Anísio Teixeira. (2019). Resumo técnico do Censo da Educação Superior 2017. INEP. https://download.inep.gov.br/educacao_superior/censo_superior/resumo_tecnico/resumo_tecnico_censo_da_educacao_superior_2017.pdf
» https://download.inep.gov.br/educacao_superior/censo_superior/resumo_tecnico/resumo_tecnico_censo_da_educacao_superior_2017.pdf -
Instituto Nacional de Estudos e Pesquisas Educacionais Anísio Teixeira. (2022). Censo da Educação Superior 2020: notas estatísticas. INEP. https://download.inep.gov.br/publicacoes/institucionais/estatisticas_e_indicadores/notas_estatisticas_censo_da_educacao_superior_2020.pdf
» https://download.inep.gov.br/publicacoes/institucionais/estatisticas_e_indicadores/notas_estatisticas_censo_da_educacao_superior_2020.pdf -
Kaplan, R. M., Spittel, M. L., & Zeno, T. L. (2014). Educational attainment and life expectancy. Policy Insights from the Behavioral and Brain Sciences, 1(1), 189-194. https://doi.org/10.1177/2372732214549754
» https://doi.org/10.1177/2372732214549754 -
Kingston, P. W., Hubbard, R., Lapp, B., Schroeder, P., & Wilson, J. (2003). Why education matters. Sociology of Education, 76(1), 53-50. https://doi.org/10.2307/3090261
» https://doi.org/10.2307/3090261 -
Kwon, H. S., & Jones, B. L. (2006). The impact of the determinants of mortality on life insurance and annuities. Insurance: Mathematics and Economics, 38(2), 271-288. https://doi.org/10.1016/j.insmatheco.2005.08.007
» https://doi.org/10.1016/j.insmatheco.2005.08.007 - Little, R., & Rubin, D. (2019). Statistical analysis with missing data (3rd edition). Wiley.
-
Lobo, V. G. R., Fonseca, T. C. O., Alves, M. B., Silva, L. M. F., & Figueiredo, L. F. V. (2022). Bayes Mortality: A package in R for Bayesian Graduation of Mortality Rates. https://www.premiosusep.susep.gov.br/
» https://www.premiosusep.susep.gov.br/ -
Luy, M., Wegner-Siegmundt, C., Wiedemann, A., & Spijker, J. (2015). Life expectancy by education, income and occupation in Germany: Estimations using the longitudinal survival method. Comparative Population Studies, 40(4), 399-436. https://doi.org/10.12765/CPoS-2015-16
» https://doi.org/10.12765/CPoS-2015-16 -
Montez, J. K., & Friedman, E. M. (2015). Educational attainment and adult health: Under what conditions is the association causal? Social Science & Medicine, 127, 1-7. https://doi.org/10.1016/j.socscimed.2014.12.029
» https://doi.org/10.1016/j.socscimed.2014.12.029 -
Montez, J. K., Hummer, R. A., & Hayward, M. D. (2012). Educational attainment and adult mortality in the United States: A systematic analysis of functional form. Demography, 49(1), 315-336. https://doi.org/10.1007/s13524-011-0082-8
» https://doi.org/10.1007/s13524-011-0082-8 -
Oliveira, M., Frischtak, R., Ramirez, M., Beltrão, K., & Pinheiro, S. (2012). Tábuas biométricas de mortalidade e sobrevivência: Experiência do mercado segurador brasileiro. FUNENSEG. https://labma.ufrj.br/site/static/arquivos/Livro_Tabuas_Portugues.pdf
» https://labma.ufrj.br/site/static/arquivos/Livro_Tabuas_Portugues.pdf -
Oliveira, M., Ramirez, M. R., Frischtak, R. M., Borges, R. B. R., Costa, B., & Pedroso, R. C. (2016). Mortality tables for the Brazilian insured population. Revista Brasileira de Estudos de População, 33(3), 653-677. https://doi.org/10.20947/S0102-30982016c0010
» https://doi.org/10.20947/S0102-30982016c0010 -
Oliveira, M., Bertho, A. C. S., Costa, B., Sommerlatte Silva, F., Alves, M. B., Ramos Ramirez, M., Borges, R. B. R., Marques, R., Rosa, R. M. S., Peregrino, R. L., Lobo, V. G. R., & Fonseca, T. C. O. (2023). Tábuas de mortalidade BR-EMS 2021 do mercado segurador brasileiro. Revista Brasileira de Estudos de População, 40, 1-24. https://doi.org/10.20947/S0102-3098a0252
» https://doi.org/10.20947/S0102-3098a0252 -
Organization for Economic Cooperation and Development. (2021). Education in Brazil: An international perspective. OECD Publishing. https://doi.org/10.1787/60a667f7-en
» https://doi.org/10.1787/60a667f7-en -
Raghupathi, V., & Raghupathi, W. (2020). The influence of education on health: An empirical assessment of OECD countries for the period 1995-2015. Archives of Public Health, 78(20). https://doi.org/10.1186/s13690-020-00402-5
» https://doi.org/10.1186/s13690-020-00402-5 -
Ribeiro, M. M., Turra, C. M., & Pinto, C. C. X. (2021). Mortalidade adulta por nível de escolaridade em São Paulo: Análise comparativa a partir de diferentes estratégias metodológicas. Revista Brasileira de Estudos de População, 38, 1-28. https://doi.org/10.20947/S0102-3098a0139
» https://doi.org/10.20947/S0102-3098a0139 -
Sandoval, M. H., Turra, C. M., & Luz, L. (2022). The importance of education for middle-and old-age mortality in Chile: Estimates from panel data linked to death records. Journal of Aging and Health, 34(1), 71-77. https://doi.org/10.1177/08982643211027404
» https://doi.org/10.1177/08982643211027404 -
Shi, J., & Kolk, M. (2022). How does mortality contribute to lifetime pension inequality? Evidence from five decades of Swedish taxation data. Demography, 59(5), 1843-1871. https://doi.org/10.1215/00703370-10218779
» https://doi.org/10.1215/00703370-10218779 -
Silva, L. M., Freire, F. H. M. A., & Pereira, R. H. M. (2016). Diferenciais de mortalidade por escolaridade da população adulta brasileira, em 2010. Cadernos de Saúde Pública, 32(4), e00019815. https://doi.org/10.1590/0102-311X00019815
» https://doi.org/10.1590/0102-311X00019815 -
Steingrímsdóttir, Ó. A., Næss, Ø., Moe, J. O., Grøholt, E. K., Thelle, D. S., Strand, B. H., & Bævre, K. (2012). Trends in life expectancy by education in Norway 1961-2009. European Journal of Epidemiology, 27, 163-171. https://doi.org/10.1007/s10654-012-9663-0
» https://doi.org/10.1007/s10654-012-9663-0 -
Sudharsanan, N., Zhang, Y., Payne, C. F., Dow, W., & Crimmins, E. (2020). Education and adult mortality in middle-income countries: Surprising gradients in six nationally-representative longitudinal surveys. Population Health, 12. https://doi.org/10.1016/j.ssmph.2020.100649
» https://doi.org/10.1016/j.ssmph.2020.100649 -
Superintendência de Seguros Privados (2021). Tábuas Biométricas BR-EMS. https://www.gov.br/susep/pt-br/assuntos/informacoes-ao-mercado/informacoes-tecnicas-e-planos-padroes/tabuas-biometricas-br-ems
» https://www.gov.br/susep/pt-br/assuntos/informacoes-ao-mercado/informacoes-tecnicas-e-planos-padroes/tabuas-biometricas-br-ems -
Superintendência de Seguros Privados (2022a). Previdência complementar aberta. https://www.gov.br/susep/pt-br/planos-e-produtos/previdencia-complementar-aberta
» https://www.gov.br/susep/pt-br/planos-e-produtos/previdencia-complementar-aberta -
Superintendência de Seguros Privados (2022b). Relatório de análise e acompanhamento dos mercados supervisionados. http://www.susep.gov.br/menuestatistica/SES/relat-acomp-mercado-2022.pdf
» http://www.susep.gov.br/menuestatistica/SES/relat-acomp-mercado-2022.pdf -
Superintendência de Seguros Privados (2023). Seguro de pessoas. https://www.gov.br/susep/pt-br/planos-e-produtos/seguros/seguro-de-pessoas
» https://www.gov.br/susep/pt-br/planos-e-produtos/seguros/seguro-de-pessoas -
Turra, C. M., Renteria, E., & Guimarães, R. (2016). The effect of changes in educational composition on adult female mortality in Brazil. Research on Aging, 38(3), 283-298. https://doi.org/10.1177/0164027515620245
» https://doi.org/10.1177/0164027515620245 -
Welsh, J., Bishop, K., Booth, H., Butler, D., Gourley, M., Law, H. D, Banks, E., Canudas-Romo, V., & Korda, R. J. (2021). Inequalities in life expectancy in Australia according to education level: a whole-of-population record linkage study. International Journal for Equity in Health, 20(178), 1-7. https://doi.org/10.1186/s12939-021-01513-3
» https://doi.org/10.1186/s12939-021-01513-3 -
Westenberger, R., & Gonçalves, L. R. M. (1995). O nível de solvência das seguradoras brasileiras (Relatórios UFRJ/COPPEAD n. 301). https://pantheon.ufrj.br/handle/11422/10536
» https://pantheon.ufrj.br/handle/11422/10536 -
Woolf, S. H., Johnson, R. E., Phillips, R. L., & Philipsen, M. (2007). Giving everyone the health of the educated: An examination of whether social change would save more lives than medical advances. American Journal of Public Health, 97(4), 679-683. https://doi.org/10.2105/AJPH.2005.084848
» https://doi.org/10.2105/AJPH.2005.084848 -
Yang, K., Zhang, Y., Saito, E., Rahman, M. S., Gupta, P. C., Sawada, N., Tamakoshi, A., Gao, Y.-T., Koh, W.-P., Shu, X.-O., Tsuji, I., Sadakane, A., Nagata, C., You, S.-L., Yuan, J.-M., Shin, M.-H., Chen, Y., Pan, W.-H., Pednekar, M. S., Nan, H. (2019). Association between educational level and total and cause-specific mortality: A pooled analysis of over 694.000 individuals in the Asia Cohort Consortium. BMJ Open, 9, e026225. http://dx.doi.org/10.1136/bmjopen-2018-026225
» http://dx.doi.org/10.1136/bmjopen-2018-026225
-
FUNDING
This research was supported by the National Federation of Private Pensions and Life (Federação Nacional de Previdência Privada e Vida [FenaPrevi]) and the Rio de Janeiro State Research Support Foundation (Fundação de Amparo à Pesquisa do Estado do Rio de Janeiro [FAPERJ]).
-
3
This is a bilingual text. This article was originally written in Portuguese and published under the DOI 10.1590/1808-057x20241961.pt

 Source: Prepared by the authors.
 Source: Prepared by the authors.
 Source: Prepared by the authors based on
  Source: Prepared by the authors.
 Source: Prepared by the authors.
 Source: Prepared by the authors.