 Colorimetric analysis of phosphorus concentration in animal feeds using images from smartphone or scanner – a proof-of-concept study
ABSTRACT
This study aimed to evaluate the potential of using images taken with a smartphone or scanner as alternatives to conventional spectrophotometry for phosphorus (P) analysis of feedstuff. Twenty-four samples of feed ingredients and commercial concentrates were evaluated. After acid digestion and dilution, the solutions were analyzed using the P-molybdate colorimetric reaction. Standards ranged from 0 to 1.4 mg L−1 at intervals of 0.2 mg L−1 of P in the reading solution. Standards and reading solutions were analyzed in ELISA microplates. The absorbance values of each cuvette were obtained using a spectrophotometer, and smartphone and scanner images were obtained sequentially. The images were segmented, and a circle was sampled in each cuvette to obtain the mean values of the red, green, and blue (RGB) channels. The P concentration was determined using linear regression of absorbance or the mean values obtained in the RGB channels as a function of P concentration. The repeatability (REP), limits of detection (LOD), and limits of quantification (LOQ) were calculated. Except for the scanner’s blue channel (P<0.10), image-based colorimetric methods provided similar P concentrations similar to those obtained by spectrophotometry (P>0.10). Using absorbance, the REP, LOD, and LOQ were 0.96%, 0.013, and 0.039 mg L−1, respectively. The best-performing image-based predictors were red and green channels of the smartphone, with REP, LOD, and LOQ values of 1.80%, 0.050, 0.150 mg L−1 and 2.11%, 0.074 and 0.223 mg L−1, respectively. The smartphone red channel spectrophotometric absorbance provided equivalent P concentrations at a 99% confidence interval. Smartphone images performed better than scanner images. The use of the mean red channel from smartphone images proved promising for determining P concentration in feeds.
Keywords:
absorbance; feed analysis; molybdenum blue; RGB
1. Introduction
Phosphorus (P) is an essential mineral involved in various physiological and biochemical functions in animal metabolism. It is essential for body structure and function, such the regulation of osmotic and acid-base balance by phosphate, energy use, and membrane, DNA, and RNA structures (Suttle, 2010). Phosphorus also plays a significant role in the global use of agricultural inputs and is closely related to several major economic and environmental concerns in animal production (Thomas Sims et al., 2005). Therefore, the proper quantification of P concentration in animal feeds is a key point for diet formulation, with attention to animal performance, health, environmental impact, and economic profitability.
Standard methods for quantifying P in animal feeds are mostly based on previous mineralization by dry or wet acid digestion, with subsequent quantification of P in the resulting mineral solutions using highly instrumented or colorimetric methods. More sophisticated instruments, such as inductively coupled plasma (ICP) with optical emission spectrometry (ICP-OES) or atomic emission spectrometry (ICP-AES), are highly sensitive and precise; however, they have high acquisition and operational costs, making them inaccessible to several feed analysis laboratories. Techniques with lower costs derived from colorimetric quantification of phosphate using the molybdenum blue complex are widely used for feeds (Fiske and Subbarow, 1925; Pulliainen and Wallin, 1996; Detmann et al., 2025). Although relatively more accessible, the molybdenum blue method still requires a spectrophotometer to measure absorbance. The use of a spectrophotometer requires trained personnel, standardized electrical installations, and adequate facilities dedicated to the equipment. In addition, advances in lower-cost and portable instruments for colorimetric analysis may support the development of future rapid analytical methods.
Studies evaluating and demonstrating the potential replacement of conventional colorimetry and spectrophotometry with image analysis using smartphones or scanners have been conducted for ammonia, sulfide, eugenol, nitrite, and ethanol analysis in different sample matrices such as water and drinks (Colzani et al., 2017; Curbani et al., 2020; Filgueiras et al., 2022; Santos et al., 2023; Vargas-Muñoz et al., 2023). The quantification of P by combining colorimetry and image analysis using the molybdenum blue complex has been reported for water and soil analysis (Yang et al., 2007; Moonrungsee et al., 2015; de Souza et al., 2023). However, the application of this technology in animal feed, associated with different image acquisition methods, has not yet been demonstrated.
Thus, this study aimed to evaluate the feasibility of quantifying P in animal feeds using images obtained with accessible devices, such as smartphones or scanners, compared with traditional spectrophotometry using the molybdenum blue colorimetric method.
2. Material and methods
2.1. Samples
A total of 24 animal feed samples were evaluated, including cereal grains and by-products such as ground maize, whole-plant corn, corn bran, corn gluten (Zea mays), wheat flour, wheat gluten (Triticum aestivum L.), oat flour (Avena sativa), potato starch (Solanum tuberosum), and tapioca granules (Manihot esculenta). The protein and oilseed sources comprised soybean meal (Glycine max L., two samples), linseed flour and linseed seeds (Linum usitatissimum), coconut flour (Cocos nucifera), and brewery wet residue (Hordeum vulgare). Other plant-derived ingredients included beet pulp (Beta vulgaris L.), eggplant flour (Solanum melongena), and cassava flour (Manihot esculenta; two samples). Additionally, commercial products were analyzed, namely rice flour (Prozyn, Butantã, SP), horse feed (Guabi Equitage, Além Paraíba, MG), cattle feed and calf feed (Ideal Rações, Rio Pomba, MG), and swine feed (Granfino, Nova Iguaçu, RJ). This diverse sampling provided a broad representation of the typical components used in animal diets, ensuring a robust evaluation across different feed matrices.
2.2. Preparation of mineral solutions
In all procedures, a single batch of distilled water from a 10 L Pilsen distiller (Marte Científica, Santa Rita do Sapucaí, Brazil) was used.
Mineral solutions were prepared by acid digestion, as described by Palma et al. (2015). Briefly, the mineral solutions were digested with 5 mL of nitric acid (65% P.A., CAS 7697-37-2, Neon Química, Suzano, Brazil) and perchloric (70% CAS 7601-090-3, Sigma-Aldrich, Burlington, USA) in a 4:1 v v-1 ratio, at 200 °C the solution became translucent and no brown vapors were produced. After digestion, the residues were filtered using quantitative filter paper (MN 640, Macherey-Nagel, Düren, Germany) and diluted in 50 mL volumetric flasks, which were completed with distilled water. The mineral solution was stored in polyethylene flasks and kept refrigerated (2-4 °C) until analysis.
2.3. Colorimetric reaction
The quantification of P was based on the phosphorus-molybdate colorimetric reaction (Fiske and Subbarow, 1925), as described by Detmann et al. (2025). The acid solution of molybdate was composed of 20 g L-1 of ammonium molybdate (P.A., CAS 12054-85-2, Dinâmica Química, Indaiatuba, Brazil), 1 g L-1 of bismuth carbonate (P.A., CAS 5892-10-4, Dinâmica Química, Indaiatuba, Brazil), and 253.9 g L-1 of sulfuric acid (P.A., CAS 7664-93-4, Dinâmica Química, Indaiatuba, Brazil). For each analytical round, a 40 g L-1 solution of ascorbic acid (P.A., CAS 50-81-7, Dinâmica Química, Indaiatuba, Brazil) was prepared and used within 60 minutes after preparation. A stock solution of 4.39 g L-1 of monobasic potassium phosphate (P.A., CAS 7778-77-0, Dinâmica Química, Indaiatuba, Brazil) was diluted at 1:100 v v-1 to prepare the standard solution.
The reading solutions were prepared in 50 mL flasks, to which 5 mL of molybdate acid solution and 2 mL of ascorbic acid solution (40 g L-1) were previously added, and the volume was completed to approximately 50% with distilled water. Standards with 0; 0.2; 0.4; 0.6; 0.8; 1.0; 1.2; and 1.4 mg of P L-1, were prepared. For each sample, 2.5 mL of the mineral solution was pipetted. After completing the flask volume and after approximately 5 min of reaction, 0.3 mL of the reading solution was transferred to ELISA microplates with 96 flat-bottomed wells. After the preparation of each plate, colorimetric readings were performed within 30 minutes.
The above-described steps were performed for two consecutive days, in direct sequence, using the same operators and apparatuses. Thus, a total of ten batches, each consisting of one plate, were prepared. Per batch, standards were distributed across columns and rows, and samples were randomly distributed among the plates, in triplicate per plate (Supplementary material S1).
2.4. Readings
After preparation, the absorbance was measured, and images were obtained (Figure 1).

Representative scheme of the reading steps to get absorbance in a spectrophotometer and red, green and blue (RGB) data from images obtained by smartphone or scanner, for each microplate (pictures of microplates are real examples from this study of scanner and smartphone images).
2.4.1. Absorbance
Absorbance at 725 nm (Multiskan Go, Thermo Scientific, Waltham, USA) was used as the standard method for quantifying P in the reading solutions.
2.4.2. Images
2.4.2.1. Smartphone
To standardize the images and minimize the interference of external light, a cardboard dark box (Christodouleas et al., 2015) was made with a height of 42 cm, a depth of 35 cm, and a width of 39 cm. A 2 × 2 cm hole was made in the upper center to attach the smartphone camera. The light source used was a 24 W and 6500 K white LED luminaire measuring 30 × 30 cm and 3 cm in height (Avant, São Paulo, Brazil), centered at the bottom of the dark box. The plates were placed at the center of the light source, and images were obtained using a Galaxy A54 smartphone (Samsung Electronics, Seoul, South Korea) with automatic default image settings. Autofocus was used at the center of the plate to obtain each image. The distance between the camera lens and the top of the light source was 40 cm. The images were saved in JPEG format and with a resolution of 4032 × 3024 pixels.
2.4.2.2. Scanner
The plate was placed in the scanner such that the beam of light moved parallel to the longer side of the plate. A scanner CanoScan LiDE 300 (Canon Inc., Tokyo, Japan) was used. Corrections for brightness, contrast, etc., were not applied, and the standard settings of the equipment were adopted. The images were taken at 600 dpi and saved in JPEG format with dimensions of 3498 × 4962 pixels.
2.5. Data extraction and processing
All subsequent processing was performed using the ImageJ software (version 1.54f; Schneider et al., 2012). From the images obtained, all the plates were manually segmented into dimensions of 515 × 553 pixels. After segmentation, a circle of 10 pixels in diameter was selected in each microplate well, and the mean of the three RGB channels was obtained (Figure 1).
2.6. Calculations and statistical analysis
2.6.1. Quantification of P in reading solutions
For each plate, calibration curve parameters were estimated using PROC REG of SAS 9.4 (SAS Institute Inc., 2015), according to the following equation:
in which Y is the analytical signal, P is the concentration of phosphorus, β0 is the intercept, and β1 is the slope of the calibration curve.
The P concentration in each reading solution was determined using the following equation:
in which is the P concentration for the reading solution of the i-th sample, Li is the reading obtained for the i-th sample, and and are parameters estimated for using the standards described in Equation [1].
2.6.2. Repeatability and detection limit
For each predictor, a random model was used with the P concentration values obtained from the samples:
in which [P]ij is the P content in replicate j of sample i, μ is the general constant, Ai is the random effect of the i-th sample, and εij is the random error between replicates. Sample and residual variances were estimated by restricted maximum likelihood.
The standardized repeatability as a function of the average P was calculated as follows:
in which is the residual variance obtained in Equation [3], and P̅ is the mean P concentration in the reading solution for each sample and quantification method.
The limit of detection (LOD) was calculated using the following equation:
in which sP0 is the standard deviation in the white aliquots and is the regressor of the calibration curve, obtained using Equation [1].
The limit of quantification (LOQ) was calculated as:
in which sP0 is the standard deviation in the white aliquots and is the regressor of the calibration curve, obtained in Equation [1].
2.6.3. Comparison of methods
To compare the average P determined in reading solutions by the image acquisition method, repeated measures ANOVA was performed using the PROC GLIMMIX procedure in SAS 9.4 (SAS Institute Inc., 2015). The statistical model was:
in which [P]ijkl is the P concentration in the reading solution, μ is the overall mean, Mi is the fixed effect of the method (repeated measure), βj is the random intercept associated with plate (subject), δij is the random effect of image within plate (subject) assuming unstructured covariance matrix (UN), γk is the random effect of the sample, and εijkl is the residual error.
The model was fitted using the P concentration in the reading solution, determined by the mean values of each channel. As absorbance was assumed to be the gold standard, the least-squares mean of the scanner and smartphone images was compared using a paired t-test relative to absorbance. To minimize type II error, differences were tested considering alpha equal to 0.10.
Based on the higher slope in Equation 1 (sensitivity) and lower REP, LOD, and LOQ values, the best-performing image type and channel was selected. A linear regression between the average P concentration in each sample using the absorbance results and the best-performing alternative method was estimated. The null hypothesis of intercept equal to zero and slope equal to one were tested considering alpha equal to 0.01.
3. Results
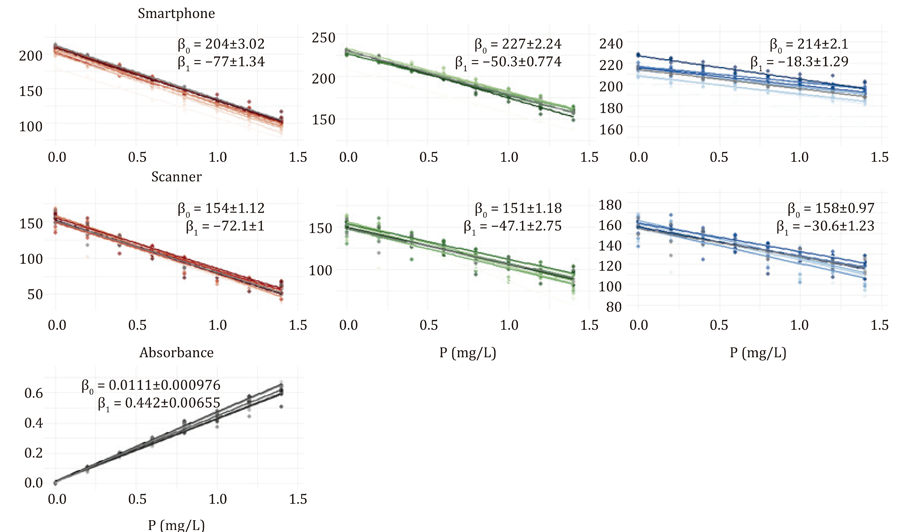
An inverse relationship between color values and P concentration was observed for all channels and devices, whereas the absorbance was positively correlated with P (Figure 2).

Scatterplots with mean intercept (β0) and slope (β1) of each RGB predictor or absorbance as a function of standard solutions from 0 to 1.4 mg L−1 of P in images obtained by smartphone or scanner (each line refers to plates).
Lower repeatability values, LOD, and LOQ of 0.96%, 0.013, and 0.039 mg L-1, respectively, were observed using absorbance as a predictor (Table 1). Lower repeatability values, LOD, and LOQ were observed for smartphone images, with minimum repeatability values using red as a predictor of 1.80%, 0.050, and 0.150 mg L-1, respectively. From all evaluated channels and devices, only the blue channel using scanner images provided a P concentration different from that obtained by the absorbance method (P<0.10).
As the red channel in smartphone images had a higher slope in Equation [1] (Figure 2) and the lowest REP, LOD, and LOQ (Table 1), the P concentration for each sample was regressed against P determined by absorbance (Figure 3). The intercept and slope did not differ from zero (P = 0.128) and one (P = 0.369), respectively.

Phosphorus (P) concentration (as received) determined by absorbance at 725 nm in spectrophotometer as a linear function of P determined by mean red channel in smartphone images (β0 and β1 are intercept and slope, respectively; n = 24).
4. Discussion
Except for the blue channel of the scanner images, all evaluated colorimetric methods provided mean P concentration values that were not different from those obtained by absorbance. The differences between the remaining methods and absorbance mainly relied on repeatability, LOD, and LOQ, which were lower for red, followed by green in the smartphone images. Additionally, the higher slope for the red channel in the smartphone indicates higher sensitivity and highlights it as the best channel and image type. Considering the comparison of P determination by the red channel in smartphone images and absorbance, the desired intercept not different from zero and slope not different from one were observed (Cantwell, 2025). Together, these results suggest a potential similarity between absorbance and the red channel of smartphone-based imaging, which may be useful for developing alternative analytical methods. However, this was an intra-laboratory analysis and should be interpreted as a proof-of-concept study with limited scope.
It is important to mention the upper limit of intra-laboratory repeatability of 12%, calculated by the Horwitz equation using the average 0.429 mg L-1 of P (Horwitz and Albert, 2006). Considering other studies using the molybdenum blue method for P analysis in feeds or foods, a safe threshold of 2.5% can be considered for this study (Pulliainen and Wallin, 1996; McKie and McCleary, 2016; Gliszczyńska-Świgło and Rybicka, 2021). The repeatability value of 0.96% observed for absorbance was close to the lower value of 1.1% reported in the reference study of Pulliainen and Wallin (1996). This indicates that random factors were properly controlled in the spectrophotometer analysis of the present study, and that it is suitable to be interpreted as the gold standard. Satisfactory repeatability was observed for the red and green channels of the smartphone images, with values of 1.80 and 2.11%, respectively. These repeatability values are promising and support future collaborative studies to evaluate reproducibility.
The red channel of smartphone images had LOD and LOQ of 0.050 and 0.150 mg L-1, respectively, which are lower than 0.37 and 1.13 reported by Gliszczyńska-Świgło and Rybicka (2021), who used absorbance in a microplate spectrophotometer to analyze P in dairy products. Although using conventional glass cuvettes and other specificities the apparatus (i.e., dark box and light source), LOD and LOQ of 1.60 and 2.30 mg L-1 with repeatability of 2% were reported using smartphone images to measure P in water, soil, and biofertilizers (de Souza et al., 2023). This demonstrates that the results are within acceptable standards of LOD and LOQ for image-based methods proposed for P analysis in other types of sample matrices.
Studies evaluating and using image analysis and colorimetric methods have utilized scanners as the main device, mainly based on the ReadPlate plug-in for ImageJ (Angelani et al., 2018; Filgueiras et al., 2022). Owing to the scanner’s intrinsic standardization of the light source, image resolution, and lower external light interference during image acquisition, better or similar performance compared with smartphones was expected. However, smartphone images provided lower repeatability, LOD, and LOQ than scanner images. The use of smartphones may be preferable to scanners because it opens the possibility of analysis using portable and popular devices that are widely available. Although more susceptible to factors such as ambient light, sample position, and focus distance, which affect the accuracy of image-based colorimetric analysis (Vargas-Muñoz et al., 2023), these were minimally standardized in this study using a low-cost dark box and light source. Solutions, such as the microplate reader proposed by Bergua et al. (2022), can be used as an example of the development of a specific and simple apparatus for colorimetric analysis using smartphones. Although differences among smartphone models are not expected, studies comparing inter-device reliability and reproducibility are still needed. Several potential improvements to the apparatus, mainly in defining optimal distances for imaging, as well as the color temperature and power of the light source coupled to the ELISA plate, can be made.
In addition to aspects related to imaging devices and apparatus, key chemical aspects related to analytical procedures may interact with image data and can be optimized in future studies. When the molybdenum blue method was proposed by Fiske and Subbarow (1925), the authors highlighted various substances and analytical approaches that may affect color development. Different digestion methods, variations in reducing agents and catalysts, proportions of mineral solutions, and integration with pre-concentration and separation processes are relevant issues to be evaluated and can interact with colorimetric analysis (Divrikli et al., 2009; Mogashane et al., 2025). For instance, the concentrations of sulfuric acid, ammonium molybdate, ascorbic acid, and potassium antimonyl tartrate solutions affected the RGB values of a polymer developed for phosphate analysis in water (Wongniramaikul and Choodum, 2017). Another example of variations in the method is the study by Moonrungsee et al. (2015), who proposed an image-based colorimetric method for P in soil solutions using potassium antimonyl tartrate as a catalyst, which was omitted in our study. Thus, advances in analytical procedures for image colorimetry in P analysis in animal feeds depend on factorial studies evaluating these interactions from sample preparation to colorimetric analysis.
5. Conclusions
The concept of using RGB data from digital images captured using low-cost and easily accessible devices and microplates proved to be feasible for determining P concentration in animal feeds using the molybdenum blue colorimetric method. Images from the smartphone showed greater potential than those from the scanner, and when using data from the red channel, they showed significant predictive potential, with low repeatability and detection and quantification limits. The results open perspectives for future studies aimed at enhancing the technology readiness level, considering that smartphones are accessible and popular instruments.
Supplementary material
Supplementary material S1
References
-
Angelani, C. R.; Carabias, P.; Cruz, K. M.; Delfino, J. M.; Sautu, M.; Espelt, M. V.; Ferreira-Gomes, M. S.; Gómez, G. E.; Mangialavori, I. C.; Manzi, M.; Pignataro, M. F.; Saffioti, N. A.; Salvatierra Fréchou, D. M.; Santos, J. and Schwarzbaum, P. J. 2018. A metabolic control analysis approach to introduce the study of systems in biochemistry: the glycolytic pathway in the red blood cell. Biochemistry and Molecular Biology Education 46:502-515. https://doi.org/10.1002/bmb.21139
» https://doi.org/10.1002/bmb.21139 -
Bergua, J. F.; Álvarez-Diduk, R.; Idili, A.; Parolo, C.; Maymó, M.; Hu, L. and Merkoçi, A. 2022. Low-cost, user-friendly, all-integrated smartphone-based microplate reader for optical-based biological and chemical analyses. Analytical Chemistry 94:1271-1285. https://doi.org/10.1021/acs.analchem.1c04491
» https://doi.org/10.1021/acs.analchem.1c04491 -
Cantwell, H. 2025. Eurachem guide: The fitness for purpose of analytical methods – A laboratory guide to method validation and related topics. 3rd ed. Available at: <http://www.eurachem.org>. Accessed on: June 02,2025.
» http://www.eurachem.org -
Christodouleas, D. C.; Nemiroski, A.; Kumar, A. A. and Whitesides, G. M. 2015. Broadly available imaging devices enable high-quality low-cost photometry. Analytical Chemistry 87:9170-9178. https://doi.org/10.1021/acs.analchem.5b01612
» https://doi.org/10.1021/acs.analchem.5b01612 -
Colzani, H.; Rodrigues, Q. E. A. G.; Fogaça, C.; Gelinski, J. M. L. N.; Pereira-Filho, E. R. and Borges, E. M. 2017. Determinação de fosfato em refrigerantes utilizando um scanner de mesa e análise automatizada de dados: um exemplo didático para ensino de química. Química Nova 40:833-839. https://doi.org/10.21577/0100-4042.20170035
» https://doi.org/10.21577/0100-4042.20170035 -
Curbani, L.; Gelinski, J. M. L. N. and Borges, E. M. 2020. Determination of ethanol in beers using a flatbed scanner and automated digital image analysis. Food Analytical Methods 13:249-259. https://doi.org/10.1007/S12161-019-01611-7
» https://doi.org/10.1007/S12161-019-01611-7 -
de Souza, V. S.; Silva, S. M. S.; Maia, L. C.; Monteiro, D. S. and Souza, A. L. V. 2023. Development of a methodology for phosphorus determination in soils, water, and biofertilizer using digital image analysis - DIA. Chemometrics and Intelligent Laboratory Systems 240:104929. https://doi.org/10.1016/j.chemolab.2023.104929
» https://doi.org/10.1016/j.chemolab.2023.104929 - Detmann, E.; Rodrigues, J. P. P.; Silva, T. E.; Brito Neto, A. S. and Franco, M. O. 2025. Methods for feed analysis. 3rd ed. INCT - Animal Science. Suprema, Visconde do Rio Branco.
-
Divrikli, U.; Akdogan, A.; Soylak, M. and Elci, L. 2009. Factorial design for multivariate optimization of preconcentration system for spectrophotometric phosphorus determination. Talanta 79:1287-1291. https://doi.org/10.1016/j.talanta.2009.05.046
» https://doi.org/10.1016/j.talanta.2009.05.046 -
Filgueiras, M. F.; Lima, B. O. and Borges, E. M. 2022. A high-throughput, cheap, and green method for determination of ethanol in cachaça and vodka using 96-well-plate images. Talanta 241:123229. https://doi.org/10.1016/j.talanta.2022.123229
» https://doi.org/10.1016/j.talanta.2022.123229 - Fiske, C. H. and Subbarow, Y. 1925. The colorimetric determination of phosphorus. Journal of Biological Chemistry 66:375-400.
-
Gliszczynska-Swiglo, A. and Rybicka, I. 2021. Fast and sensitive method for phosphorus determination in dairy products. Journal of Consumer Protection and Food Safety 16:213-218. https://doi.org/10.1007/s00003-021-01329-x
» https://doi.org/10.1007/s00003-021-01329-x -
Horwitz, W. and Albert, R. 2006. The Horwitz ratio (HorRat): A useful index of method performance with respect to precision. Journal of AOAC International 89:1095-1109. https://doi.org/10.1093/jaoac/89.4.1095
» https://doi.org/10.1093/jaoac/89.4.1095 -
McKie, V. A. and McCleary, B. V. 2016. A novel and rapid colorimetric method for measuring total phosphorus and phytic acid in foods and animal feeds. Journal of AOAC International 99:738-743. https://doi.org/10.5740/jaoacint.16-0029
» https://doi.org/10.5740/jaoacint.16-0029 -
Mogashane, T. M.; Mapazi, O.; Motlatle, M. A.; Mokoena, L. and Tshilongo, J. 2025. A Review of recent developments in analytical methods for determination of phosphorus from environmental samples. Molecules 30:1001. https://doi.org/10.3390/molecules30051001
» https://doi.org/10.3390/molecules30051001 -
Moonrungsee, N.; Pencharee, S. and Jakmunee, J. 2015. Colorimetric analyzer based on mobile phone camera for determination of available phosphorus in soil. Talanta 136:204-209. https://doi.org/10.1016/j.talanta.2015.01.024
» https://doi.org/10.1016/j.talanta.2015.01.024 -
Palma, M. N. N.; Rocha, G. C.; Valadares Filho, S. C. and Detmann, E. 2015. Evaluation of acid digestion procedures to estimate mineral contents in materials from animal trials. Asian-Australasian Journal of Animal Sciences 28:1624-1628. https://doi.org/10.5713/ajas.15.0068
» https://doi.org/10.5713/ajas.15.0068 -
Pulliainen, T. K. and Wallin, H. C. 1996. Determination of total phosphorus in foods by colorimetry: Summary of NMKL Collaborative study. Journal of AOAC International 79:1408-1410. https://doi.org/10.1093/jaoac/79.6.1408
» https://doi.org/10.1093/jaoac/79.6.1408 -
Santos, I. C.; Schlesner, S. K.; Moraes, D. P.; Fereira, D. F.; Voss, M.; Giacomelli, S. R. and Barin, J. S. 2023. Smartphone-based rapid and low-cost method for the determination of eugenol content of clove essential oil. Ciência Rural 53:e20220498. https://doi.org/10.1590/0103-8478cr20220498
» https://doi.org/10.1590/0103-8478cr20220498 -
Schneider, C. A.; Rasband, W. S. and Eliceiri, K. W. 2012. NIH Image to ImageJ: 25 years of image analysis. Nature Methods 9:671-675. https://doi.org/10.1038/nmeth.2089
» https://doi.org/10.1038/nmeth.2089 - Suttle, F. S. 2010. The mineral nutrition of livestock. 4th ed. CABI, Penicuik, UK.
-
Thomas Sims, J. and Sharpley, A. N. (eds.). 2005. Phosphorus: agriculture and the environment. American Society of Agronomy, Crop Science Society of America, Soil Science Society of America, Madison, WI. https://doi.org/10.2134/agronmonogr46
» https://doi.org/10.2134/agronmonogr46 -
Vargas-Muñoz, M. A.; Morales, J.; Cerdà, V.; Ferrer, L. and Palacio, E. 2023. Paper sensor-based method using a portable 3D-printed platform and smartphone-assisted colorimetric detection for ammonia and sulfide monitoring in anaerobic digesters and wastewater. Microchemical Journal 188:108469. https://doi.org/10.1016/j.microc.2023.108469
» https://doi.org/10.1016/j.microc.2023.108469 - Wongniramaikul, W. and Choodum, A. 2017. Synthesis of polymer sensor for detection of phosphate in water. International Journal of Chemical Engineering and Applications 8:221-225.
-
Yang, C.-X.; Sun, X.-Y.; Liu, B. and Lian, H.-T. 2007. Determination of total phosphorus in water sample by digital imaging colorimetry. Chinese Journal of Analytical Chemistry 35:850-853. https://doi.org/10.1016/S1872-2040(07)60059-0
» https://doi.org/10.1016/S1872-2040(07)60059-0
-
Data availability:
The dataset supporting the results of this study is available upon request.
-
Supplementary material
The supplementary material of this article can be found online at: https://www.rbz.org.br/wp-content/uploads/articles_xml/1806-9290-rbz-55-e20250130/1806-9290-rbz-55-e20250130-suppl01.xlsx
-
Financial support:
This research received financial support from PROPPG/UFRRJ (23083.046986/2023-91), Conselho Nacional de Desenvolvimento Científico e Tecnológico (CNPq; 312920/2023-7), and Fundação Carlos Chagas Filho de Amparo à Pesquisa do Estado do Rio de Janeiro (FAPERJ; 200.124/2023). Scholarships from Coordenação de Aperfeiçoamento de Pessoal de Nível Superior (CAPES) and PROPPG/UFRRJ were awarded to Lima, L. B. and Silva, C. G., respectively.
Edited by
-
Editors:
Anderson Antonio Carvalho AlvesLuan Sousa dos Santos
The dataset supporting the results of this study is available upon request.