 Effect of chlorophyll concentration on the spectral signature of the microalgae Chlorella vulgaris and Raphidocelis subcapitata
ABSTRACT
Water is the most important substance in nature and all known life forms on the planet depend on it. Among aquatic species, microalgae and cyanobacteria stand out as indicators of their quality, as their increase can be harmful for human consumption, and their concentrations should be monitored. This research aimed to identify reflectance patterns of the microalgae Chlorella vulgaris and Raphidocelis subcapitata that allow, through the creation of an algorithm, the estimation of their chl-a concentrations. The R software found that cell density and growth were higher in C. vulgaris Pearson correlation of 0.96 (p-value 0.000041) and Chl-a content was higher in R. Subcapitata Pearson correlation of 0.81 (p-value 0.013778). An algorithm made it possible to edit the dependent variable based on statistical models. The best readings for the microalgae used were in the spectral range of 524.84 nm in R. subcapitata and 671.13 nm in C. vulgaris. The use of the spectroradiometer for such an analysis, previously unprecedented, was due to the best cost-benefit for measuring the reflectance of Chl-a. It is expected that these two equations will be used in satellites to remotely check water quality through the incidence of these microalgae.
Keywords:
Water; Chlorophyll; Microalgae; Spectroradiometer; Technology
RESUMO
A água é a substância mais importante da natureza e todas as formas de vida conhecidas no planeta dependem dela. Dentre as espécies aquáticas, destacam-se as microalgas e cianobactérias como indicadoras de sua qualidade, pois seu aumento pode ser prejudicial ao consumo humano, devendo haver um nonitoramento de suas concentrações. Esta pesquisa teve como objetivo identificar padrões de reflectância das microalgas Chlorella vulgaris e Raphidocelis subcapitata que permitam, por meio da criação de um algoritmo, estimar suas concentrações de chl-a. O software R verificou que a densidade e o crescimento celular foram maiores em C. vulgaris com correlação de Pearson de 0,96 (p-valor 0,000041) e o teor de Chl-a foi maior em R. subcapitata com correlação de Pearson de 0,81 (p-valor 0,013778). Um algoritmo possibilitou a edição da variável dependente com base em modelos estatísticos. As melhores leituras para as microalgas utilizadas foram na faixa espectral de 524,84 nm em R. subcapitata e 671,13 nm em C. vulgaris. O uso do espectrorradiômetro para tal análise, até então inédito, deveu-se ao melhor custo-benefício para medição da reflectância de Chl-a. Espera-se que essas duas equações sejam utilizadas em satélites para verificação remota da qualidade da água por meio da incidência dessas microalgas.
Palavras-chave:
Água; Clorofila; Microalgas; Espectrorradiômetro; Tecnologia
INTRODUCTION
Water is the most important substance in nature, as all known forms of life on the planet depend on it, and it is also the subject of several studies in Brazil and around the world (Dawson et al., 2015; Chrispim & Nolasco, 2017; Zhang et al., 2017 ; Bianchi et al., 2019; Torremorell et al., 2021 ). As the global demand for water grows, the likelihood of supplying water of adequate quality decreases severely (Andrade et al., 2020). In several Brazilian regions of dams and rivers close to poor communities, the effectiveness of the durability of river quality is responsible for the main sources of water for industrial, domestic and agricultural use (Tester et al., 2020; Lobo et al., 2009).
Due to the scarcity of water resources in recent decades, the investigation of aquatic environments has become increasingly essential, as there has been a great interference with water quality and an increase in the use of important and little-studied reservoirs (Hart & Hart, 2006).
One of the problems affecting the quality of water in reservoirs is a hypereutrophic environment, due to high concentrations of nutrients, associated with episodes of microalgal blooms or even fish kills, with undesirable consequences for their multiple uses (Chaves et al., 2019; Godlewska et al., 2023). The species that grow in these environments need to survive under limited light conditions, while at the same time they must be able to degrade the compounds responsible for coloring the water in the environment and also withstand very high nutrient concentrations (Chong et al., 2021).
A small fraction of the radiant energy incident on an aquatic environment is converted by microalgae into chemical energy, which is transferred to other trophic levels, and plays a crucial role in the dynamics of the environment (Sipaúba-Tavares & Rocha, 1993).
The importance of microalgae in relation to water quality becomes indisputable when we look at their influence on the environment, as they play a structuring role in the trophic chain and serve as bioindicators (Singh & Patidar, 2020). Thus, based on chlorophyll-a (chl-a), it is possible to use satellite images to evaluate water supply reservoirs, based on quantification and evaluation at spatial (horizontal and vertical) and temporal scales (Ambati et al., 2019; Barbosa et al., 2019).
Chl-a is a pigment found in all phytoplankton species (Falcioni et al., 2023; Xu et al., 2020) and has been widely used as a proxy indicator of eutrophication in aquatic environments and primary production by microalgae, being important in relation to monitoring episodes of excessive increase in cell multiplication (Watanabe et al., 2019).
These common problems in reservoirs can be quickly elucidated using satellites (Dörnhöfer & Oppelt, 2016). The authors describe that the increase in chl-a and cyanobacteria in the aquatic environment can be extremely harmful and even worse for subsequent human consumption if found in excess. Thus, the use of remote sensing techniques can assist traditional sampling strategies to increase the efficiency of obtaining information on spatial and temporal variability in the habitat.
Various spectral indices have been proposed specifically for evaluating chlorophyll content in large or small quantities, but each environment requires a for the studied site (Clevers et al., 2017; Cui & Zhou, 2017; Darvishzadeh et al., 2019; Cazzaniga et al., 2019; Pompêo et al., 2021).
Among some indices used, the form of reflectance relationship/difference/slope derived from the chlorophyll absorption bands was observed (Lin et al., 2015); Normalized Difference Vegetation Index (NDVI), Normalized Difference Chlorophyll Index (NDCI), Modified Normalized Difference Water Index (MNDWI), Normalized Difference Turbidity Index (NDTI), Water Ratio Index (WRI), Automated Water Extraction Index (AWEI), Simple Ratio (SR) and Simple Ratio Watercolor (SRWC) (Saberioon et al., 2020).
Moreover, little by little the use of machine learning algorithms, such as support vector machines, are becoming widespread, wich can be applied to drones (Najafzadeh & Basirian, 2023).
Although there are studies in Brazil (Aranha et al., 2022) and around the world (An et al., 2020) that analyze chlorophyll-a concentrations in aquatic environments using spectroradiometers, spectral waves and other forms; there are still no studies using microalgae as a test object. What we find are models based on remote field sensing (Lopes et al., 2021).
Having a model available to estimate chl-a concentrations in a given reservoir as a whole is extremely important, as it is possible to obtain a parameter of the environmental quality of the water and even imagine future improvements in that location. Furthermore, the equations are useful for measuring reflectances with the spectroradiometer, which is much cheaper and faster than measuring chl-a directly. Therefore, the objective of this research was to identify reflectance patterns of the microalgae Chlorella vulgaris and Raphidocelis subcapitata that allow, through the creation of an algorithm, estimate their concentrations in the aquatic environment, this calculation was revised through its correlation to Chl-a concentrations.
METODOLOGY
The microalgae species used in this work were defined according to their morphological characteristics, such as differences in their shapes, length, width, cell density, sheath and abundance in the environment. The microalgae species chosen for the study were: Raphidocelis subcapitata and Chlorella vulgaris, from UFSCAR's freshwater microalgae culture collection (CCMA-UFSCar, strain 704). These species were acquired for the study because they are widely studied species, because they are easy to grow, because they are regularly found in reservoirs and because one has a mucilage sheath (Chlorella vulgaris), and the other does not have (Raphidocelis subcapitata).
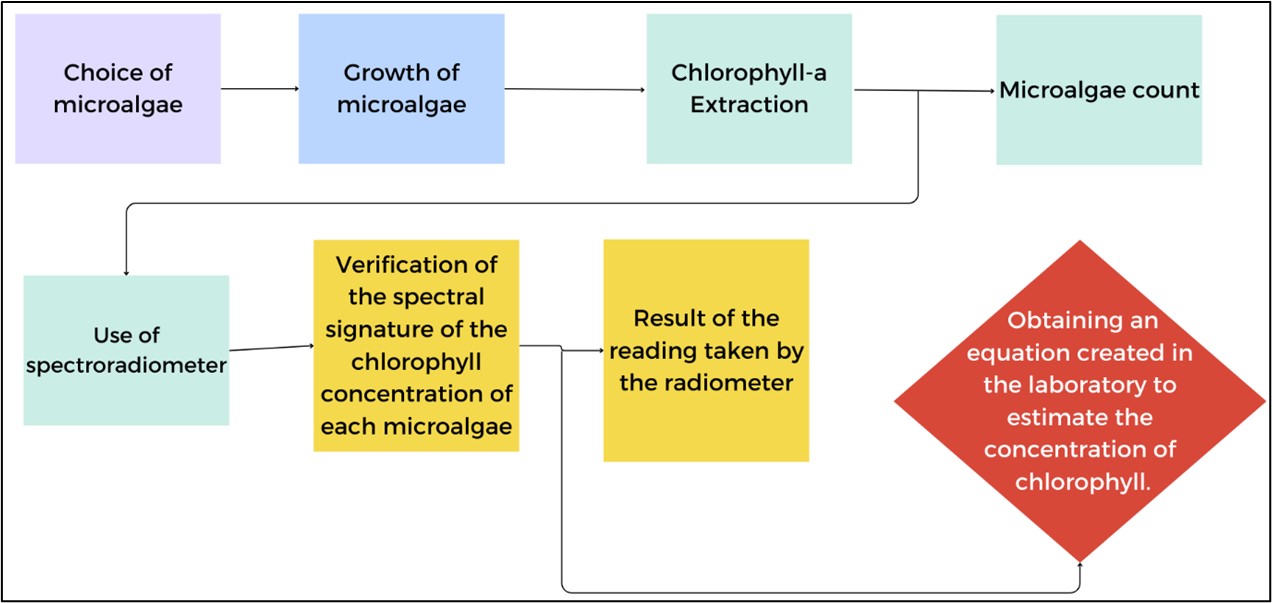
To understand the entire methodology, a flowchart was created to better understand the project (Figure 1).

Although are green microalgae, they have different families, growth, structural characteristics, uses in industry, abundance and spectral readings, which is why their structures and differences in the environment should be studied.
Chlorella vulgaris, a spherical unicellular microalgae 1-6 μm in diameter (Luo et al., 2006; Safi et al., 2014), is green, has a high biomass productivity and a relatively short cell doubling time (24 h). In addition, it is an important source for the commercial production of carotenoids, various biopharmaceuticals and lipids for biodiesel production (Ambati et al., 2019), and is found frequently and in large quantities in the water supply dams and rivers of São Paulo (Lopes et al., 2021; Palmer, 1960).
Formerly known as Selenastrum capricornutum and Pseudokirchneriella subcapitata, Raphidocelis subcapitata is a microalgae with a curved and twisted appearance. They are unicellular and have a length of between 8 and 14 μm, and a width range between 2 and 3 μm. Generally found in fresh waters, it is a unicellular green microalgae with a single long chloroplast and a bright green color (Torres, 2016). This bright color is essentially due to the presence of chlorophyll. Its short life cycle and ease of growth in laboratory conditions are other characteristics that make it an ideal test organism.
In addition, it short life cycle, high growth rates, ease of maintaining cultures and its ability to grow in well-defined synthetic media make it one of the most important organisms for assessing aquatic toxicity (Kaplan, 2013). Due to its sensitivity to toxicity tests, it shows the toxic effects caused in ecosystems by chemical substances present in it, making it important in environmental impact assessments (Vidotti & Rollemberg, 2004).
The microalgae were grown in an incubator with controlled, containing empty shelves for light to pass through. The incubator was lit with fluorescent lamps intensity of 60 µmol m-2s-1 24-hour photoperiod, the temperature maintained at 21±2ºC. The distilled water is autoclaved before use with the microalgae. Cooling is maintained constantly by the greenhouse and aeration is provided by a compressor pump.
Both microalgae were grown without the insertion of culture medium in order to verify their natural growth, and the microalgal density was collected and counted twice a week for 30 days.
For chl-a analysis, aliquots ranging from 500 ml (start) to 10 ml (end) were taken weekly and filtered through glass fiber filters (GF/C 0.7 mm pore size). To count the microalgae, 10 ml of the sample was taken every week and the cell count was carried out in a Neubauer chamber (400X magnification).
The chl-a concentrations were determined at the end by colorimetric analysis, checking the wave readings in each sample after extraction in 90% ethanol (Nush, 1980), for subsequent analysis and linear regression, using a spectroradiometer (Ocean Optics USB4000), whose spectral reading ranges from 200 to 1100 nm and resolution depend on the choices of grid and light input aperture, it also has 3648 pixels and the optical resolution ranges from 0.1 to 10 nm FWHM (depending on the configuration).
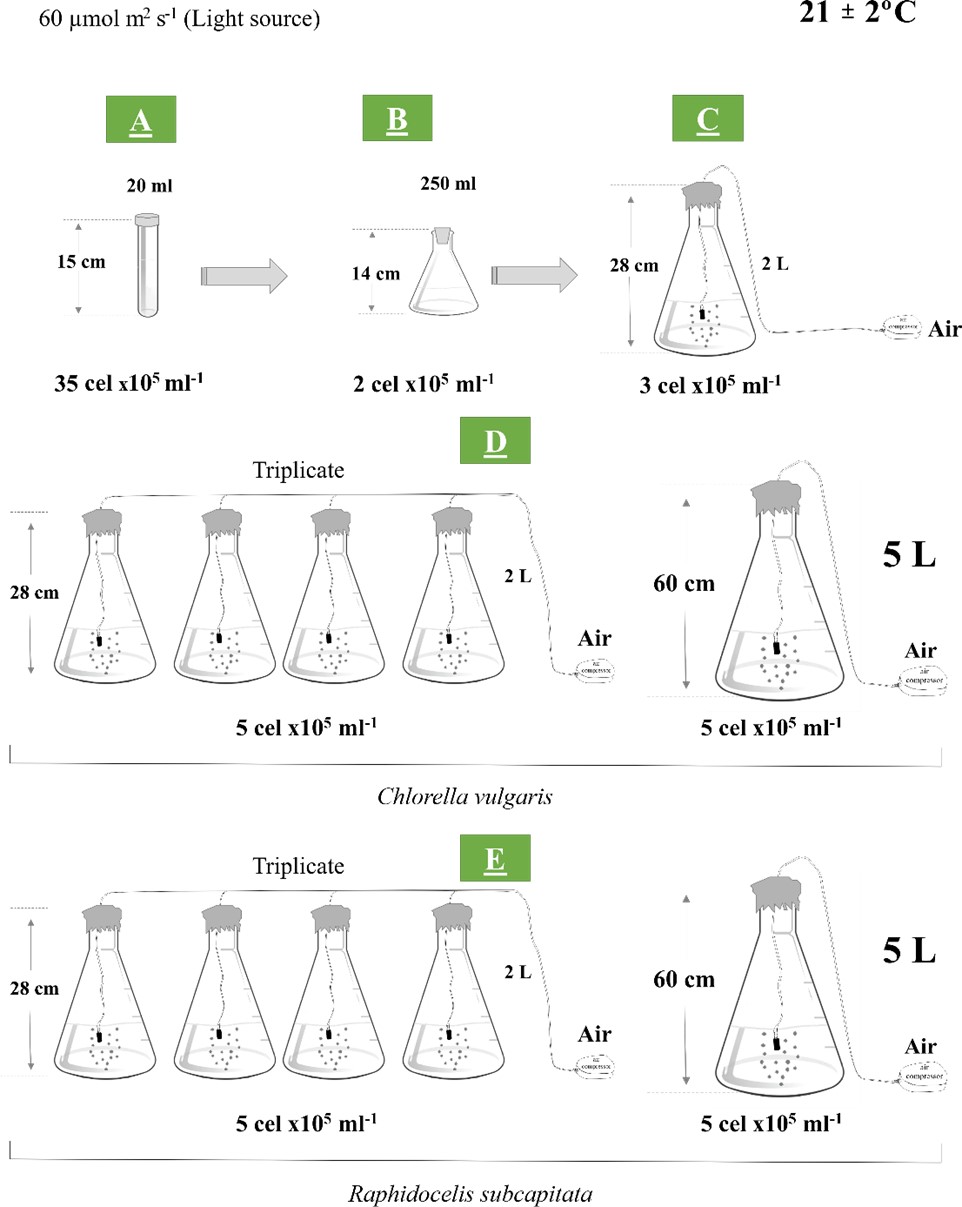
The experiment was carried out in a static system in triplicate (Figure 2), totaling 12 containers for each microalgae, plus 3 5-liter containers for removing and measuring chl-a. In addition to weekly cell counts, each microalgae was counted separately to avoid possible contamination. The initial volume of inoculum used to maintain the cultures was 5x10⁵ cels.ml-1 in each 2-liter Erlenmeyer flask and 1400 ml of distilled water, the concentration was low enough for the crop to grow throughout the period.
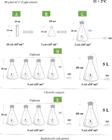
Schematic diagram of microalgae cultivation, where A = strain; B = transfer to a 250 mL erlenmeyer flask; C = initial cultivation in 2L without culture medium; D = experiment in a phototrophic system with 1400ml of water with Chlorella vulgaris microalgae, and in a 5-liter Erlenmeyes with 4200ml where the chl-a was removed; E = experiment in a phototrophic system with 1400ml of water with microalgae Raphidocelis subcapitata, and in a 5-liter erlenmeyes with 4200ml where the chl-a was removed.
Using the spectroradiometer, weekly readings were taken in the blue, green, red and near infrared bands, at a distance of 30 cm. The vats where measurements were taken had a capacity of 5 liters, in which weekly samples of microalgae were taken to analyze growth, cell density, chlorophyll, reflectance and wavelength, where the removal of the aliquot containing the analyzed microalgae and analyzes were always carried out on the same date as the weekly collections (Figure 3).

Schematic of the use of the Ocean Optics USB 4000 Spectroradiometer in the laboratory to measure the energy reflected by the microalgae Chlorella vulgaris and Raphidocelis subcapitata when they interact with the electromagnetic radiation artificially generated by a 1000-watt tungsten lamp. The results are presented in graphs with the wavelengths on the X axis and the reflectance percentages on the Y axis.
The radiometric measurements were taken in transparent glass vats with a capacity of 5 liters, containing 1.5 liters of distilled, autoclaved and sterilized water, with the addition of 500 ml of already grown and diluted microalgae, where they were observed throughout the growth period; this volume was chosen according to the literature where growth of chlorophycean microalgae has already been verified in this proportion (Sipaúba-Tavares & Rocha, 1993) initially containing in this container an inoculum of 5 cel x105 ml-1.
The counts and analyses of the microalgae Raphidocelis subcapitata were carried out in April and May 2019, while those of Chlorella vulgaris took place in April and May 2020. The dates and period in question were chosen at random, as there would be no external or internal influence due to the controlled environment.
The spectral range between 400 and 900 nm was chosen because of the presence of noise between 200 and 390 nm and between 900 and 1100 nm, as well as because it is the most appropriate range for studying microalgae according to the spectral response function (SRF) index (Kandilian et al., 2016; Serôdio et al., 2009). After measuring the spectrum from 400nm to 900nm, a correlogram was created reflectance the chlorophyll values obtained by each microalgae.
Preliminary tests were then carried out to verify the most suitable bands, as well as consulting the literature to verify the ideal wavelength for chlorophyll-a. To this end, before the experiment began, there were 3 tests with microalgae to find out the best readings for these specific microalgae.
STATISTICAL ANALYSIS
The R software (R Core Team, 2020; RStudio, 2019; Zeileis & Hothorn, 2002) and some of its libraries developed by public and private entities were used, and the results to assess the suitability of the model were obtained. The first iteration of the statistical analysis was based on 16 data points, 8 of which were from the Raphidocelis subcapitata species and 8 from the Chlorella vulgaris species. The species were analyzed separately. Even so, it is possible to find a relationship between the variables amount of chlorophyll-a present in the water and the spectroradiometer measurements.
The following metrics were used to evaluate the linear models:
-
R-squared, or coefficient of determination;
-
Correlogram function;
-
Derivative when necessary.
RESULT AND DISCUSSION
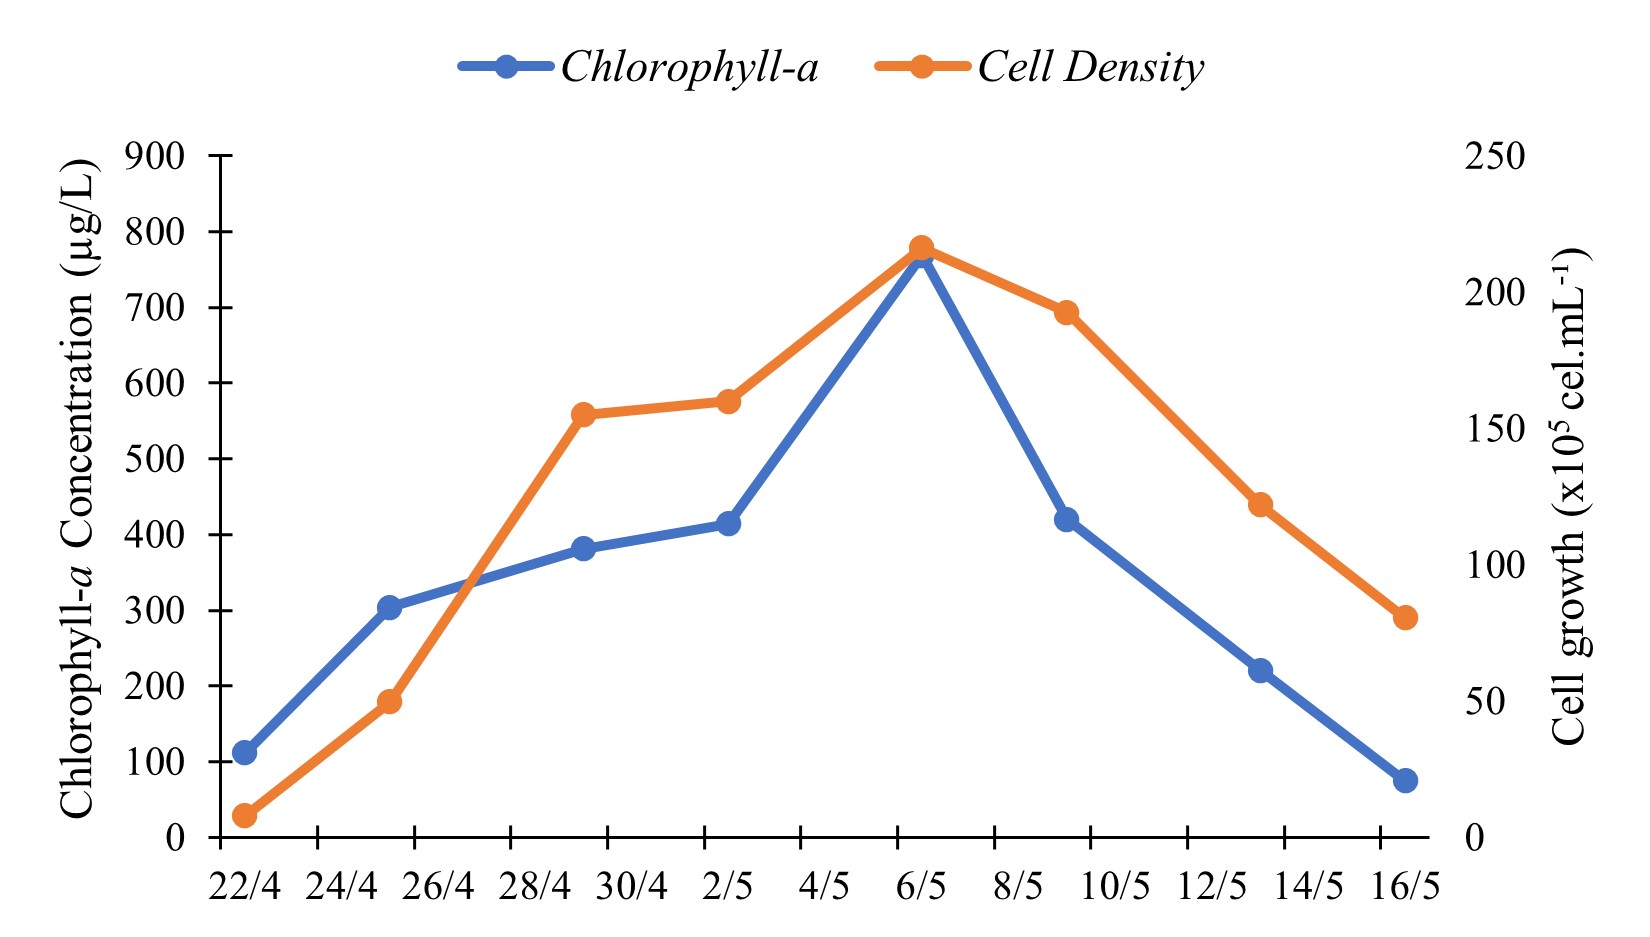
The cell density and chl-a concentration during the microalgae's growth period are shown in the figures below (Figure 4 and Figure 5). It can be seen that Chlorella vulgaris grew exponentially, with a growth peak in the 5th collection (3rd week), reaching an average of 439.68 x10⁵ cel.ml-1 (Figure 4).
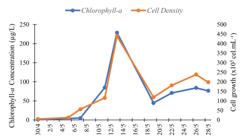
Subsequently, there was a decrease in its cell density and concentration, with growth resuming from the middle of the third week. In this way, the growth of Chlorella vulgaris is consistent with the literature (Šoštarič et al., 2009; Pearsall & Loose, 1937). These authors indicate that its life cycle is 30 days on average, with subsequent cell death, entering the senescence phase.
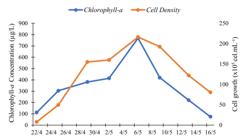
According to Stemkovski et al. (2016)Raphidocelis subcapitata has a life cycle of 28 days on average, like many chlorophyceae. According to this author, after this period, in laboratory experiments, the colony needs to be replicated and divided into other containers, or cell death occurs. This occurs because when there is a high density in the same container (overpopulation), there is a dispute for oxygen and nutrients, consequently causing cell death, decomposition and the emergence of organic matter; It is necessary to divide these microalgae so that there is a space with everything it needs to develop. Thus it can be seen that its growth occurred more uniformly and with less expressive peaks, reaching a maximum growth of 216.3 x10⁵ cell.ml-1 in the third week, which also corroborates the aforementioned author.
With regard to the concentration of chl-a (Figure 5), the maximum content reached was 228.7 µg/L for C. vulgaris and 768.4 µg/L for R. subcapitata, and for both, its peak, as well as for cell density, occurred in the 5th collection (3rd week), showing that growth were similar, thus obtaining a relationship between chl-a and cell density. Thus, both microalgae showed a pattern, with an increase in cell density and consequently in chl-a concentrations; with the differences being the cellular density of each one, resulting from the size of each microalgal cell typical of each species.
A strong correlation between cell density and chlorophyll-a concentration was already expected, given a well-executed experiment. This correlation arises from the fact that chlorophyll-a is an essential pigment for photosynthesis, and its concentration in algae cells reflects their metabolic activity and growth potential. Thus, as the concentration of chlorophyll-a increases, it indicates a greater capacity for photosynthesis, probably leading to an increase in cell density (Simkin et al., 2022).
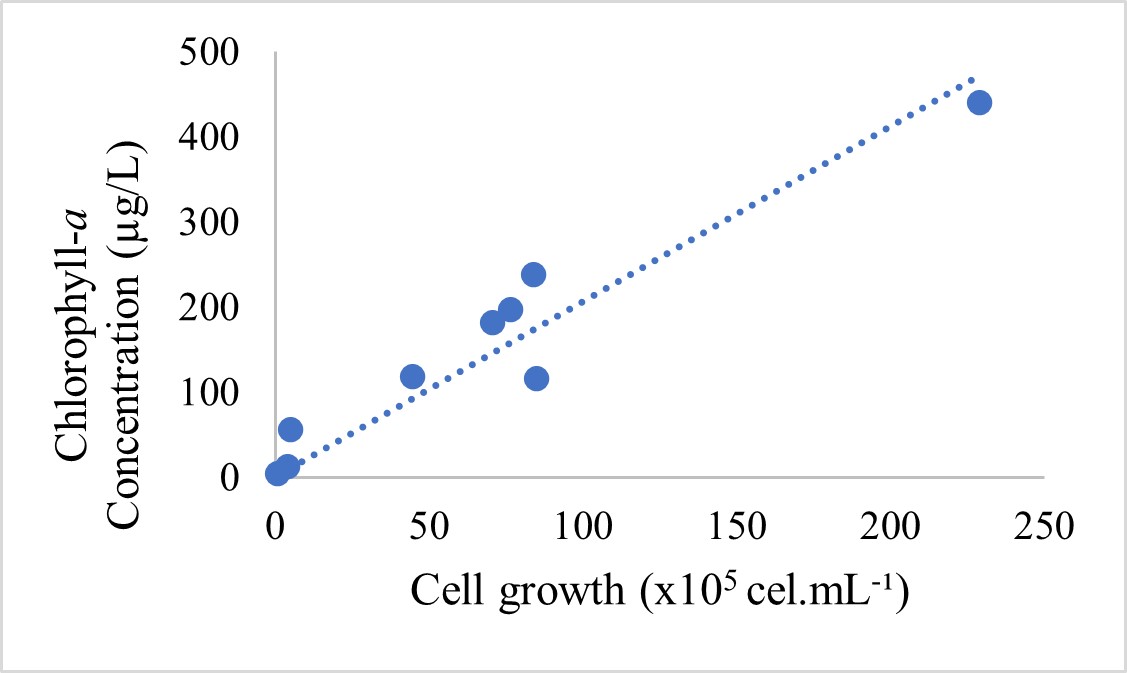
The cell density of Chlorella vulgaris and the concentration of chl-a show a very strong Pearson correlation of 0.96 (p-value 0.000041) (Figure 6). The model that best explains the relationship between the two variables is:
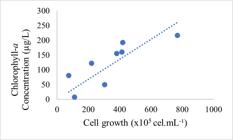
The CellDensity coefficient has a p-value of 0.000000786, which allows us to reject the null hypothesis that the cell density of Chlorella vulgaris has no impact on chlorophyll concentration.
The cell density of Raphidocelis Subcapitata and the concentration of chl-a show a strong Pearson correlation of 0.81 (p-value 0.013778) (Figure 7). The model that best explains the relationship between the two variables is:

The CellDensity coefficient has a p-value of 0.0000721, which allows us to reject the null hypothesis that the cell density of Raphidocelis Subcapitata has no impact on chlorophyll concentration.
The figures (Figure 4 and Figure 5) show that there is a correlation between microalgal cell density and chl-a of Raphidocelis subcapitata and Chlorella vulgaris, which was to be expected, as observed in relationships established by other authors (Zonneveld, 1998; Wang et al., 2018; Pérez-Morales et al., 2015) who correlate an increase in chlorophyll in freshwater environments with an increase in phytoplankton and consequently some zooplankton species, since cell growth increases, there will immediately be a higher concentration of chlorophyll-a (Sipaúba-Tavares et al., 2019).
The decrease in cell density occurs naturally and is typical of chlorophyceous microalgae, because as previously mentioned, there is an average time for algal growth in the laboratory, until it reaches a higher density and it is necessary to replicate the sample or cell death will occur, normally occurring from of the third week drop and decrease in population (Okomoda et al., 2021, Sipaúba-Tavares et al., 2011). It can be explained by various factors such as an increase in population and consequently a decrease in available oxygen, the lack of nutrients, vitamins and culture medium to increase cell growth, a decrease in the content of proteins in the cells and the number of cytoplasmic ribosomes, there is also an intense accumulation of lipids, a slowdown in photosynthetic activity, disorganization of the chloroplast structure and a decrease in chlorophyll (Desnitskiy, 2021). As a result, the green pigmentation of the cells weakens and eventually disappears, changing color (Hagen & Kochert, 1980; Pommerville & Kochert, 1982).
It can also be observed that cell growth is much higher in C. vulgaris between the second and third week, while the amount of chlorophyll-a is higher in R. subcapitata. One of the hypotheses to explain this higher amount of chlorophyll-a may be related to the fact that R. subcapitata does not have a sheath like C. vulgaris, that it has a higher number of pigments, which has not increased its density to the same degree, and that its volume per unit is greater than that of C. vulgaris (Richa et al., 2016). In our bibliographic review, no studies were found that correlated the presence of a mucilaginous sheath with the interference in the spectral signature of each microalgae, however, it is observed that this is a morphological difference between the two species under study. The presence of the mucilaginous sheath in C. vulgaris and its relationship with the light reflectance obtained by the microalgae must still be investigated in future studies.
These cells have mucilaginous envelopes or other cell wall ornamentation. Chlorella vulgaris also has a single chloroplast with a pyrenoid. This mucilage sheath may represent adaptive responses to environmental factors, such as pressure from the environment and endosymbiotic life strategies, which may indirectly mean that this species spends more energy building all its structures (Krienitz et al., 2004). Chloroplasts can serve to reduce CO2 permeability and the mucilaginous sheath around the chloroplast further increases diffusion resistance to CO2 escaping from the chloroplast (Fridlyand, 1997).
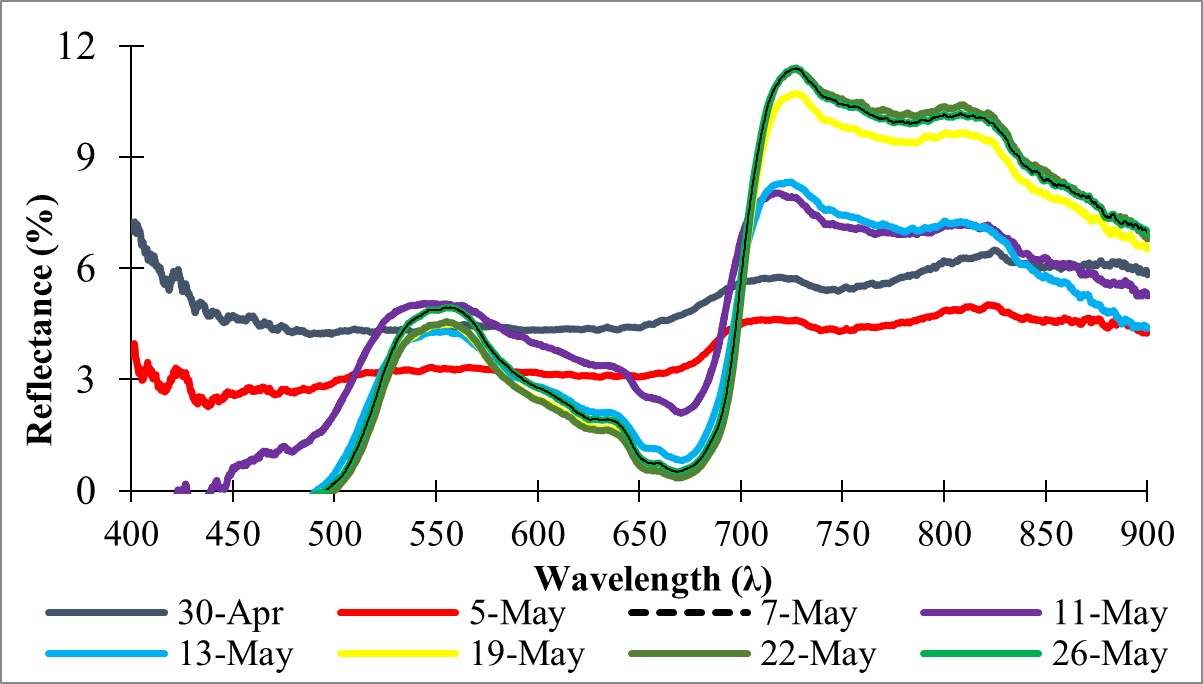
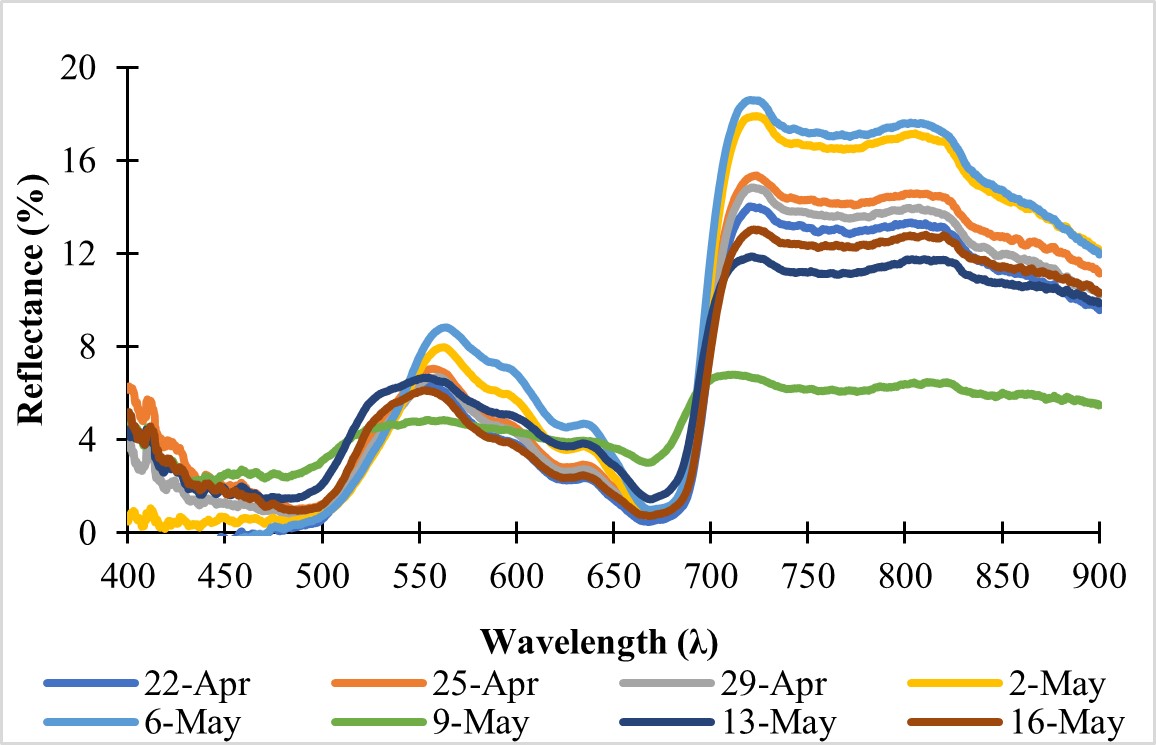
During the analysis, in addition to obtaining the chlorophyll-a content and checking cell growth, the reflectance of the microalgae cultures was also measured using a spectroradiometer (Figure 8 and Figure 9) in order to check which band and reflectance spectrum was best. To do this, the spectroradiometer was placed on the transparent tank in an artificially lit environment, where the device provided data on the reflectance obtained by the microalgae sample, and as this value was obtained, a wavelength was generated; thus, the peak wave obtained and the relationship with chlorophyll could be observed over the period of 8 collections (4 weeks).
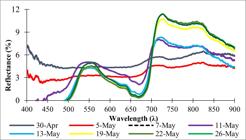
Reflectance spectra obtained in the laboratory from 8 samples of the microalgae Chlorella vulgaris diluted in distilled water.
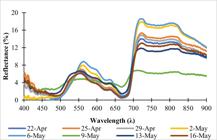
Reflectance spectra obtained in the laboratory from 8 samples of the microalgae Raphidocelis subcapitata diluted in distilled water.
In the reflectance spectra, it is possible to identify the wavelength peaks and the amount of light energy reflected during the experimental period. The microalgae Chlorella vulgaris and Raphidocelis subcapitata present two peaks: one around 560 nm (corresponding approximately to the peak of green wavelengths) and a higher peak around 730 nm (marking the transition from red to near infrared). There were differences in reflectance, while C. vulgaris reached 12% reflectance in the NIR on the third and fourth analysis, R. subcapitata reached 18% on the fifth and sixth day of analysis, as can be seen in the graph.
However, differences were observed in the amount of reflectance between the algae analyzed, making it clear that the microalgae Raphidocelis subcapitata reflected more.
Both microalgae obtained some low reflectance values at wavelengths shorter than 500 nm. An microalgae with a high concentration of chlorophyll will have a much higher reflectance at the position of the red edge than the reflectance at the position of the green peak in the spectral device reading (Lin et al., 2015).
Boegh et al. (2013) state that there is a relationship between chlorophyll concentration and visible reflectance, while the relationship between chlorophyll concentration and infrared reflectance is positive. As stress occurs in the aquatic environment due to the appearance of new nutrients, product discharges, among others, the reflectance over the visible and infrared area will increase, with the reflectance being positive as chl-a and algal groups increase (Boegh et al., 2013).
Thomas & Gaussman (1977) observed a stronger correlation between reflectance at 550 nm and chlorophyll concentration than between this and reflectance at 650 nm.
This shows that the results are within the standards for chlorophyll, as are those of the studies (Lobo et al., 2009). These authors found absorption bands of chlorophyll-a at 440 nm and 675 nm and greater reflection in the green spectral region (500 nm), resulting in the green appearance of water rich in phytoplankton. Other studies (Santos et al., 2021) also found absorbance peaks in the red region at 672 nm, while (Gitelson, 1992; Watanabe et al., 2015) found peaks at 700 nm rich in green pigments in general, without differentiating between species.
The spectroradiometer was used to obtain the spectral signature of each microalgae for the green pigment (chlorophyll), and the wavelength data for each date; the device had a wavelength gap (difference) of 0.21 nm between each reading. To obtain the reflectance and wavelength spectra, we took into account the ranges (400-900 nm) that the device could read and correlated them with the chlorophyll-a collected and analyzed at the same time.
Using this data, a correlogram was created, which shows the relationship between the bidirectional reflectance factor and the variable expressing the concentration of chlorophyll-a, making it possible to identify the spectral positions with the highest correlation between the spectral reflectance of chlorophyll-a when the aim is to develop models based on just one spectral band (Ferreira & Pereira Filho, 2009).
The variables in a multivariate regression cannot be correlated with each other, and in this case, the reflection of the bands presents multicollinearity between them; this way, the R2 can even be improved, but the significance of the coefficients drops, which invalidates the entire analysis, that is, the bands are multicollinear, the independent variables cannot be multicollinear.
The resulting correlogram shows the autocorrelation tests in a series of distance classes based on Moran's first experiment (Moran, 1950). The values ranged from -1 to 1, with values further away from zero representing stronger positive or negative spatial autocorrelation (Moran, 1950). Positive (and significant) values in a correlogram indicate that, for a given distance class, the correlations within that class are more similar than expected by chance, while negative (and significant) values indicate the reverse, where the correlations are less similar than expected by chance.
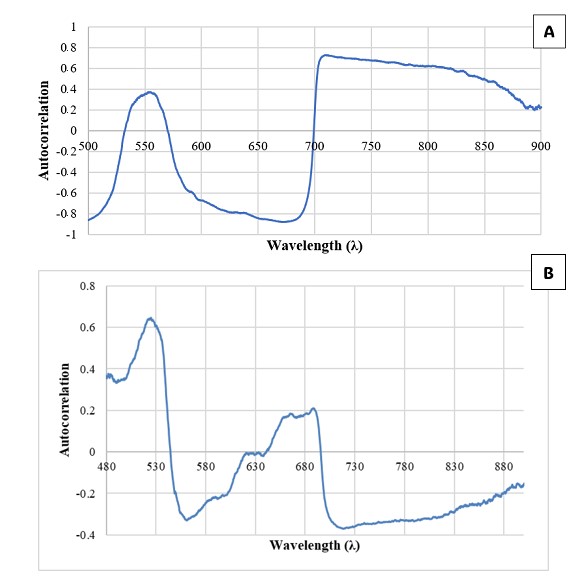
In order to obtain the peak with the best performance in terms of reading and chlorophyll, a correlogram was made of the natural logarithm of the chlorophyll concentration and the reflectance over a series of wavelengths, where a positive peak was observed at a wavelength of 704.13 and a valley at a wavelength of 671.57 (Figure 10A).

As with C. vulgaris, in order to obtain the peak with the best performance in relation to readings and chlorophyll, a correlogram was also made for Raphidocelis subcapitata, where it was observed that the wavelength with the highest correlation with chlorophyll is 524.84 nm (Figure 10B) and the correlation was 0.64 (p-value 0.087415).
The peak in the C. vulgaris correlogram at 671 nm indicates that the analyzed variables are inversely related, that is, when the chlorophyll concentration increases the observed reflectance decreases. In the case of R. subcapitata, the variables are directly related, since the increase in chlorophyll concentration increased in reflectance. In the literature review, no indications were found that this difference is related to the morphological and structural structure of these species, a fact that should be further investigated in future research.
An observation must be made regarding the data. Although significant at 10%, the power of the analysis would benefit from a larger sample. In this present study, the relatively small sample for Raphidocelis subcapitata (n=8) presents itself as a limitation for the further development of this study, however, the results obtained were promising, which validates possible large-scale research. The numerical analysis required several statistical transformations, such as logarithmic transformations, to impose the results. Numerical analysis required several statistical transformations, such as log transforms, to enforce the results.
Due to the short life cycle of microalgae and the storage capacity that made the experiment viable, the collection of samples and subsequently data was limited to just twice a week, which over the life cycle of the mother samples resulted in eight collected samples. Even with only eight pieces of data, the consistency in the collection is visible, as it covered all phases of the algae's growth, from the exponential phase to the senescence period, resulting in a qualitative view of growth. Although the amount of data is not considered "ideal", the life cycle of microalgae is the main limiting factor for this data collection, since the initial volume required for significant data collection (i.e. greater than thirty samples) is not viable under the conditions of this research.
In general, it is observed: i) strong absorption of electromagnetic energy in the blue region of the spectrum (400 to 500 nm); ii) peak reflectance in the green region (550 to 560 nm); iii) absorption due to the presence of phycobiliproteins (630 nm); iv) absorption due to the presence of photosynthetic pigments (680 nm); and v) peak reflectance at 700 nm due to the cellular structure of phytoplankton (Arst, 2003; Gitelson, 1992; Rundquist et al., 1996). Gitelson et al. (1986) identified in their studies that reading water fluorescence at 685 nm demonstrates great reflection due to the pigments present in the composition of several phytoplankton species.
According to Kokaly et al. (2009), the broad wavelength region of 400-700 nm is considered to be the most active region for chlorophyll, as it represents visible light and determines the energetic conditions of photosynthesis (Dera, 1992). The chlorophyll prediction indices that provide the greatest accuracy are mainly based on reflectance around the 550 nm or 680-750 nm regions depending on the microalgae, location, climate, and temperature (Heenkenda et al., 2015).
Several authors (Wang et al., 2019; Yu et al., 2020; Johan et al., 2018) have experimented with empirical and semi-empirical algorithms to determine the concentration of chlorophyll-a in water reservoirs based on radiometric measurements obtained in situ or in laboratory simulations, as well as using images from orbital sensors. These authors suggest that the spectral region between red and infrared in particular is useful for estimating chlorophyll concentration in eutrophic environments where the accumulation of colored dissolved organic matter (CDOM) is abundant.
The red region of the reflectance spectrum is very important for remote sensing of inland and coastal waters. This is due to several unique spectral characteristics of phytoplankton chlorophyll-a that occur in this region, as already observed by Neville & Gower (1977) and Gower et al. (1980).
The linear regression model that best explains the variation in the concentration of chl-a released by the microalgae Chlorella vulgaris as a function of reflectance at wavelength 671.57nm is∶ ln(Chlor)= -1.057*Refl+5.03.
The log transformation of the dependent variable was used to correct the heteroscedasticity of the data. Linear regression models expect data that is homoscedastic. Log transformation is a common stabilizing transformation that worked very well with our data, reinforcing the coefficient of determination with no harm whatsoever to the validity of the model.
The coefficient of determination is 77% (p-value 0.001881), with both coefficients of the equation significant at 1% (Figure 11).
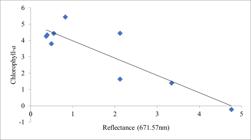
Linear regression model with logarithmic transformation to estimate chlorophyll-a concentrations in reservoirs from laboratory reflectance data using the microalgae Chlorella vulgaris.
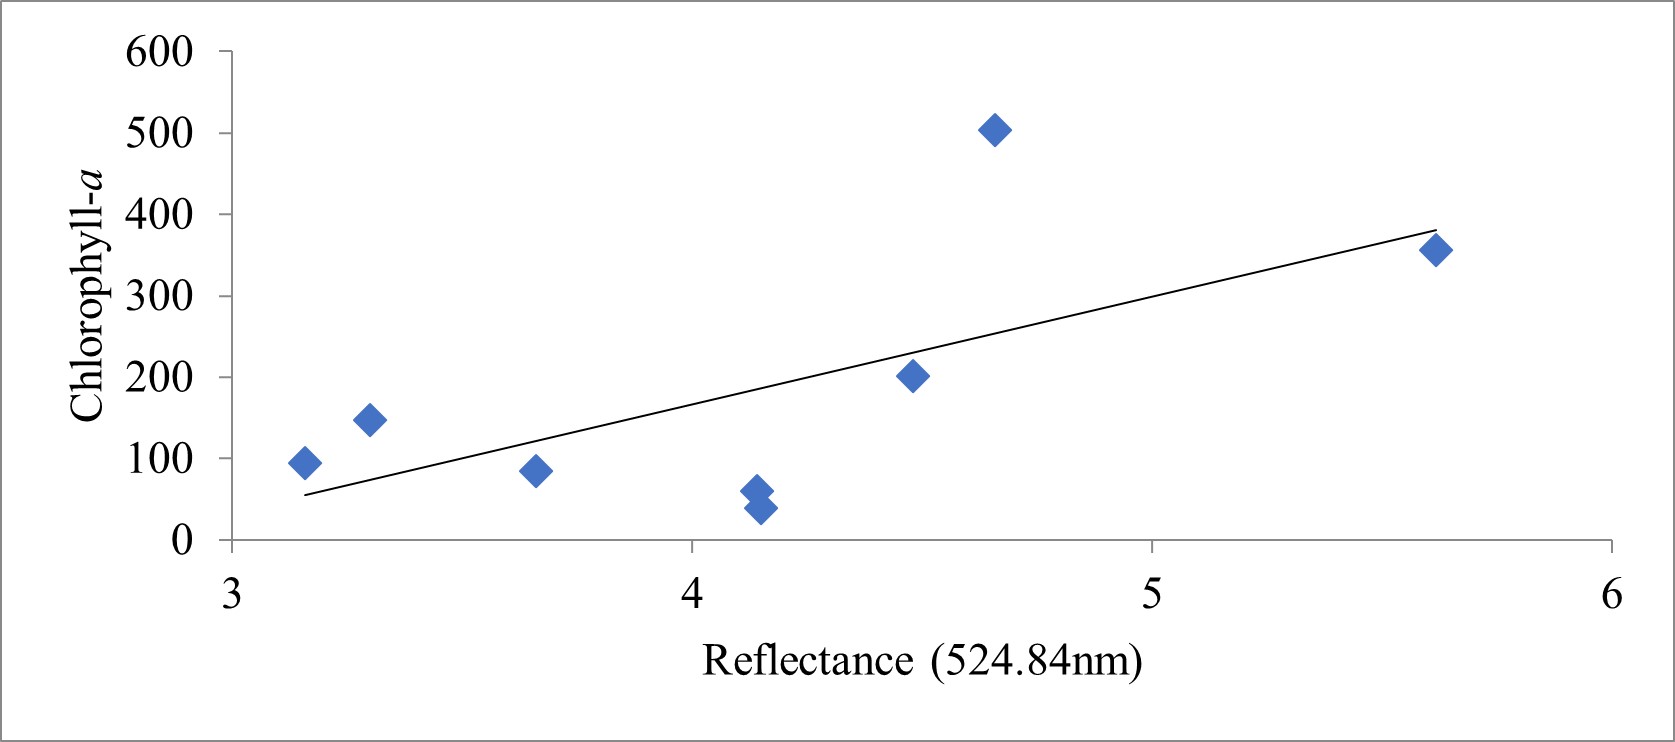
The linear regression model that explain better the variation in the concentration of chl-a released by the microalgae Raphidocelis subcapitata (Figure 12) as a function of reflectance at wavelength 524.84nm is Chlor = 47.57 * Refl.

Linear regression model with logarithmic transformation to estimate chlorophyll-a concentrations in reservoirs from laboratory reflectance data using the microalgae Raphidocellis subcapitata.
The model found has a coefficient of determination of 69% (p-value 0.00735). It was not possible to obtain significance for the best constant intercept at 10%, which means that there is not enough evidence to support the argument that the constant is different than zero. The angular coefficient is significant at 1% (p-value 0.00538). The significance results of the coefficients support the existence of a regression model in the Y = B * X + A, A=0 or, simply put, Y = B * X.
The correlograms showed different results for each microalgae, and the R2 was higher for Chlorella vulgaris after a logarithmic transformation. In any case, both models have a relevant coefficient of determination and significant estimated parameters.
Yu et al. (2016) state that the spectral matching algorithm of a correlogram can be used to calculate the linear correlation coefficient between the spectral data stabilized through the relative synthesis of the spectral axis and draw the correlation coefficient diagram to remove these errors and thus see which wavelengths are best.
It is also worth remembering that a negative correlation can be found, as in this study, because it can be minimal in the level of reflectance in the spectral region (maximum absorption) and the concentration of chlorophyll, meaning that there is minimal absorption (Gamov, 2022). The low level of reflectance in this region would therefore give rise to considerable variability between the replicate samples, which would require the use of many replicates (Cazzaniga et al., 2023). Other studies (Thomas & Gaussman, 1977) have observed a better correlation between reflectance at 550 nm and chlorophyll concentration than the correlation between reflectance at 675 nm and chlorophyll concentration, for example.
Although no specific studies were found to determine the spectral signature of microalgae, but rather of chlorophyll as a whole, it can be said that although Chlorella vulgaris had a higher biovolume and cell density, it had a lower chlorophyll-a content and lower reflectance than Raphidocelis subcapitata, thus closely correlating the reflectance read by the spectroradiometer and the chlorophyll-a concentrations.
To obtain the equation to be applied to future specific models, with the signature of the microalgae in question, the values obtained from the spectroradiometer reading were taken.
Using this data, the correlogram and the derivative for estimating chlorophyll-a concentrations were obtained from laboratory reflectance data using the microalgae C. vulgaris and R. subcapitata.
It was also observed that the R2, which is used to determine the equation to assess the adequacy of the model, whose metric ranges from 0 to 1 and the closer to 1 the closer to a perfect relationship (Serôdio et al., 2009), in which the independent variable explains the completeness of the variation in the dependent variable, was close to 1 in R. subcapitata, proving to be a good metric for analysis.
In the case of the microalgae R. subcapitata (p-value 0.00735), the R2 was 0.69 and the model was y= 47.57x, which shows that it is a good equation and has a sufficient value for future application. Chlorella vulgaris, on the other hand, obtained the best R2 of 0.77 and the model was y =-1.053x + 5.03, which is a strong coefficient of determination and can be used for various analyses.
The R2 for C. vulgaris (p-value 0.001881), is higher after a logarithmic transformation, showing that there is strong confidence in the equation obtained, in addition to it increasing over the time analyzed, with 77% determination with the spectral reading of 671 nm.
In R. subcapitata, the R2 showed a strong degree of applicability of the equation obtained, and it was also used. The model using all the spectral ratios read together with the correlogram resulted in viable data for estimating chlorophyll concentrations. The microalgae's biology may explain the variance in the ability of the spectroradiometer to reflect signals compared to Chlorella vulgaris. A larger sample size would certainly improve the assertiveness of the regression.
The reflectance of chlorophyll-a gradually increases in the transition zone of the red and near infrared (NIR) regions (655-755 nm), known as the "red edge" (Zarco-Tejada, 2000), which can provide important information about the biochemical composition of the microalgae (Ahmad et al., 2020). Therefore, the reflectance of the red edge is very sensitive to the composition of the microalgae, including Chl-a and Chl-b (Solovchenko, 2023; Sims & Gamon, 2002), this light can thus serve as an indication of higher reflectance and also assist in analyzing the biochemical composition of the microalgae.
Tests already carried out with chlorophyll (in an open, uncontrolled environment) have shown that the concentration of Chl-a is higher in summer in some countries and the spectral characteristics are mainly regulated by temperature (Freitas & Dierssen, 2019; Dörnhöfer & Oppelt, 2016). where the spectral band with the highest correlation observed in the study was at an average of 496 nm, where it appears close to the green band, which is one of the characteristic bands of Chl-a. However, in winter, the water is not suitable for the survival of phytoplankton, causing a low concentration of Chl-a; the spectral characteristics are therefore mainly controlled by suspended solids. Specifically, due to the strong scattering of suspended matter, the infrared band correlation can be dominated by suspended matter rather than Chl-a, making it unsuitable for Chl-a studies as shown by (Li et al., 2022).
Various algorithms have been proposed to quantify Chl-a. Some algorithms are a ratio of two bands (Gitelson et al., 2008; Mishra & Mishra, 2012), three bands (Gitelson et al., 2011), four bands (Le et al., 2013), and several others (An et al., 2020; Sonobe et al., 2021; Zhou et al., 2020); because it was observed that analyzing only one spectral region could end up weakening the equation obtained, as there are several factors that influence and must be taken into account in natural environments, thus suggesting the use of several spectral bands, especially in the case of large sample quantities for testing (Song et al., 2013).
It has thus been observed that implementations of empirical equations are limited for different lake datasets due to different environmental contexts (related to biochemical and hydrological characteristics). To improve performance, the ideal is to obtain an R2 closer to the appropriate one (Li et al., 2021).
Adding to these models the relevant statistics to assess the possibility of specification errors, error dispersion and the strength of the correlation between the variables, one of the notable points of this table is that the R2 reached good values, which shows that there is a good correlation between the spectral reading and chlorophyll and can be an important tool for creating equations in situ.
CONCLUSION
Considering the analyzes carried out in a controlled environment and all the data obtained, it is possible to predict the cell density of microalgae based on statistical models. Furthermore, it is possible to conclude that for reading the microalgae used, the best correlation was given at wavelength 524.84, in Raphidocelis subcapitata and 671.13 in Chlorella vulgaris, thus obtaining an R2 with great predictive power for both, thus pre-establishing that to define the amount of chlorophyll-a of each microalgae in the environment, the equations already mentioned can be used and thus seek to predict improvements and avoid environmental catastrophes such as local eutrophication, checking the degree of trophy and medium amounts of these microalgae specifically.
One of the reasons for using the spectroradiometer is the fact that it is cheaper to measure the Chl-a reflectance with the device, as in the laboratory, despite the different methodologies for this analysis, they all require time, expensive material, and a good structure in order to produce the analyzes without cross-contamination.
Although the same variable (chl-a) was used to relate to reflectance, it was observed that the wavelength that best explains the concentration of chl-a was different for each microalgae. This effect may be related to the set of other photosynthetic pigments specific to each microalgae evaluated. To this end, it is also suggested that future studies be carried out with more replications in order to improve the statistical model and find a global model for different environments determining the chlorophyll-a content, regardless of the microalgae disposed in the environment.
There are no records of the use of these two microalgae for spectroradiometer tests, in order to obtain different equations to estimate chl-a concentration. However, equations are used to estimate the chlorophyll-a concentrations of the entire microalgal community. It is also noted that the use of in situ microalgae for testing is still little addressed, and it is necessary to develop more work with different types of microalgae, analyzing mainly the most frequent ones at the study site.
One of the differences of this study is the fact that in all literature the spectroradiometer is used in the field, or with samples from the studied site to create the model to estimate chlorophyll-a, and in this case there is the use of microalgae grown in the laboratory, as a test element for creation of the appropriate model, making the process less expensive, in addition to having the possibility of predicting the species available in this environment after in situ tests.
Furthermore, it is expected that these two equations will be used in maps to check the water quality of the environment, checking the incidence of these microalgae and the arrangement of both in the environment. In the future it will be possible to create equations for microalgae with higher incidence depending on the desired location, and even with cyanobacteria harmful to water treatment systems; thus being able to observe the population dynamics of the environment, sudden growth of microalgae and develop an equation that suits each environment, without having to go into the field; serving as a tool for investigation, growth and development, both in the laboratory and in the field.
REFERENCES
-
Ahmad, S., Pandey, A. C., Kumar, A., Parida, B. R., Lele, N. V., & Bhattacharya, B. K. (2020). Chlorophyll deficiency (chlorosis) detection based on spectral shift and yellowness index using hyperspectral AVIRIS-NG data in Sholayar reserve forest, Kerala. Remote Sensing Applications: Society and Environment, 19, 100369. http://doi.org/10.1016/j.rsase.2020.100369
» http://doi.org/10.1016/j.rsase.2020.100369 -
Ambati, R. R., Gogisetty, D., Aswathanarayana, R. G., Ravi, S., Bikkina, P. N., Bo, L., & Yuepeng, S. (2019). Industrial potential of carotenoid pigments from microalgae: current trends and future prospects. Critical Reviews in Food Science and Nutrition, 59(12), 1880-1902. http://doi.org/10.1080/10408398.2018.1432561
» http://doi.org/10.1080/10408398.2018.1432561 -
An, G., Xing, M., He, B., Liao, C., Huang, X., Shang, J., & Kang, H. (2020). Using machine learning for estimating rice chlorophyll content from in situ hyperspectral data. Remote Sensing, 12(18), 3104. http://doi.org/10.3390/rs12183104
» http://doi.org/10.3390/rs12183104 -
Andrade, E. M. D., Ferreira, K. C. D., Lopes, F. B., Araújo, I. C. D. S., & Silva, A. G. R. D. (2020). Balance of nitrogen and phosphorus in a reservoir in the tropical semi-arid region. Revista Ciência Agronômica, 51(1), e20196800. http://doi.org/10.5935/1806-6690.20200020
» http://doi.org/10.5935/1806-6690.20200020 -
Aranha, T. R. B. T., Martinez, J. M., Souza, E. P., Barros, M. U., & Martins, E. S. P. (2022). Remote analysis of the chlorophyll-a concentration using Sentinel-2 MSI images in a semiarid environment in Northeastern Brazil. Water (Basel), 14(3), 451. http://doi.org/10.3390/w14030451
» http://doi.org/10.3390/w14030451 -
Arst, K. I. (2003). Optical properties and remote sensing of multicomponental water bodies Springer Science & Business Media. Retrieved in 2024, February 20, from https://books.google.com.br/books?hl=pt-BR&lr=&id=eY1RdNu8ugkC&oi=fnd&pg=PR9&dq=arst++2003&ots=nrupExZWHd&sig=tqQqnRBqBiuXZsUV9DNMNHMFoYw#v=onepage&q=arst%20%202003&f=false
» https://books.google.com.br/books?hl=pt-BR&lr=&id=eY1RdNu8ugkC&oi=fnd&pg=PR9&dq=arst++2003&ots=nrupExZWHd&sig=tqQqnRBqBiuXZsUV9DNMNHMFoYw#v=onepage&q=arst%20%202003&f=false -
Barbosa, C. C. F., De Moraes Novo, E. M. L., & Martins, V. S. (Eds.) (2019). Introdução ao sensoriamento remoto de sistemas aquáticos: princípios e aplicações São José dos Campos: Instituto Nacional de Pesquisas Espaciais. Retrieved in 2024, February 20, from https://www.dpi.inpe.br/labisa/livro/res/conteudo.pdf
» https://www.dpi.inpe.br/labisa/livro/res/conteudo.pdf -
Bianchi, E., Dalzochio, T., Simões, L. A. R., Rodrigues, G. Z. P., Da Silva, C. E. M., Gehlen, G., Do Nascimento, C. A., Spilki, F. R., Ziulkoski, A. L., & Da Silva, L. B. (2019). Water quality monitoring of the Sinos River Basin, Southern Brazil, using physicochemical and microbiological analysis and biomarkers in laboratory-exposed fish. Ecohydrology & Hydrobiology, 19(3), 328-338. http://doi.org/10.1016/j.ecohyd.2019.05.002
» http://doi.org/10.1016/j.ecohyd.2019.05.002 -
Boegh, E., Houborg, R., Bienkowski, J., Braban, C. F., Dalgaard, T., Van Dijk, N., Dragosits, U., Holmes, E., Magliulo, V., Schelde, K., Di Tommasi, P., Vitale, L., Theobald, M. R., Cellier, P., & Sutton, M. A. (2013). Remote sensing of LAI, chlorophyll and leaf nitrogen pools of crop- and grasslands in five European landscapes. Biogeosciences, 10(10), 6279-6307. http://doi.org/10.5194/bg-10-6279-2013
» http://doi.org/10.5194/bg-10-6279-2013 -
Cazzaniga, I., Bresciani, M., Colombo, R., Bella, V. D., Padula, R., & Giardino, C. (2019). A comparison of Sentinel-3-OLCI and Sentinel-2-MSI-derived Chlorophyll-a maps for two large Italian lakes. Remote Sensing Letters, 10(10), 978-987. http://doi.org/10.1080/2150704X.2019.1634298
» http://doi.org/10.1080/2150704X.2019.1634298 -
Cazzaniga, I., Zibordi, G., & Mélin, F. (2023). Spectral features of ocean colour radiometric products in the presence of cyanobacteria blooms in the Baltic Sea. Remote Sensing of Environment, 287, 113464. http://doi.org/10.1016/j.rse.2023.113464
» http://doi.org/10.1016/j.rse.2023.113464 -
Chaves, L. C. G., Lopes, F. B., Maia, A. R. S., Meireles, A. C. M., & Andrade, E. M. D. (2019). Water quality and anthropogenic impact in the watersheds of service reservoirs in the Brazilian semi-arid region. Revista Ciência Agronômica, 50(2), 223-233. http://doi.org/10.5935/1806-6690.20190026
» http://doi.org/10.5935/1806-6690.20190026 -
Chong, J. W. R., Yew, G. Y., Khoo, K. S., Ho, S. H., & Show, P. L. (2021). Recent advances on food waste pretreatment technology via microalgae for source of polyhydroxyalkanoates. Journal of Environmental Management, 293, 112782. http://doi.org/10.1016/j.jenvman.2021.112782
» http://doi.org/10.1016/j.jenvman.2021.112782 -
Chrispim, M. C., & Nolasco, M. A. (2017). Greywater treatment using a moving bed biofilm reactor at a university campus in Brazil. Journal of Cleaner Production, 142(1), 290-296. http://doi.org/10.1016/j.jclepro.2016.07.162
» http://doi.org/10.1016/j.jclepro.2016.07.162 -
Clevers, J. G. P. W., Kooistra, L., & Van Den Brande, M. M. M. (2017). Using Sentinel-2 data for retrieving lai and leaf and canopy chlorophyll content of a potato crop. Remote Sensing, 9(5), 405. http://doi.org/10.3390/rs9050405
» http://doi.org/10.3390/rs9050405 -
Cui, S., & Zhou, K. (2017). A comparison of the predictive potential of various vegetation indices for leaf chlorophyll content. Earth Science Informatics, 10(2), 169-181. http://doi.org/10.1007/s12145-016-0281-3
» http://doi.org/10.1007/s12145-016-0281-3 -
Darvishzadeh, R., Skidmore, A., Abdullah, H., Cherenet, E., Ali, A., Wang, T., Nieuwenhuis, W., Heurich, M., Vrieling, A., O’Connor, B., & Paganini, M. (2019). Mapping leaf chlorophyll content from Sentinel-2 and RapidEye data in spruce stands using the invertible forest reflectance model. International Journal of Applied Earth Observation and Geoinformation, 79, 58-70. http://doi.org/10.1016/j.jag.2019.03.003
» http://doi.org/10.1016/j.jag.2019.03.003 -
Dawson, D., Vanlandeghem, M. M., Asquith, W. H., & Patiño, R. (2015). Long-term trends in reservoir water quality and quantity in two major river basins of the southern Great Plains. Lake and Reservoir Management, 31(3), 254-279. https://doi.org/10.1080/10402381.2015.1074324
» https://doi.org/10.1080/10402381.2015.1074324 -
Dera, J. (1992). Marine physics Amsterdam: Elsevier. Retrieved in 2024, February 20, from https://books.google.com.br/books?hl=pt-BR&lr=&id=YsK4YAZlRzsC&oi=fnd&pg=PP1&dq=Dera,+1992&ots=t-k0VuUXW9&sig=y5BzbTZGwiZCAQsyOAHuDac3BtI#v=onepage&q=Dera%2C%201992&f=false
» https://books.google.com.br/books?hl=pt-BR&lr=&id=YsK4YAZlRzsC&oi=fnd&pg=PP1&dq=Dera,+1992&ots=t-k0VuUXW9&sig=y5BzbTZGwiZCAQsyOAHuDac3BtI#v=onepage&q=Dera%2C%201992&f=false -
Desnitskiy, A. G. (2021). Volvox as a model for studying cell death and senescence. Russian Journal of Developmental Biology, 52(4), 259-267. http://doi.org/10.1134/S1062360421030036
» http://doi.org/10.1134/S1062360421030036 -
Dörnhöfer, K., & Oppelt, N. (2016). Remote sensing for lake research and monitoring – recent advances. Ecological Indicators, 64, 105-122. http://doi.org/10.1016/j.ecolind.2015.12.009
» http://doi.org/10.1016/j.ecolind.2015.12.009 -
Falcioni, R., Antunes, W. C., Demattê, J. A. M., & Nanni, M. R. (2023). A novel method for estimating chlorophyll and carotenoid concentrations in leaves: a two hyperspectral sensor approach. Sensors (Basel), 23(8), 3843. http://doi.org/10.3390/s23083843
» http://doi.org/10.3390/s23083843 - Ferreira, A. B., & Pereira Filho, W. (2009). Avaliação da reflectância espectral de corpos d’água em Santa Maria-RS por meio de espectrorradiometria de campo. Geoambiente On-line, 13, 1-14.
-
Freitas, F. H., & Dierssen, H. M. (2019). Evaluating the seasonal and decadal performance of red band difference algorithms for chlorophyll in an optically complex estuary with winter and summer blooms. Remote Sensing of Environment, 231, 111228. http://doi.org/10.1016/j.rse.2019.111228
» http://doi.org/10.1016/j.rse.2019.111228 -
Fridlyand, L. E. (1997). Models of CO2 concentrating mechanisms in microalgae taking into account cell and chloroplast structure. Bio Systems, 44(1), 41-57. http://doi.org/10.1016/S0303-2647(97)00042-7
» http://doi.org/10.1016/S0303-2647(97)00042-7 -
Gamov, I. (2022). Spectral signatures and properties of carbon defects in GaN and AlN Germany: Technische Universitaet Berlin. https://doi.org/10.14279/depositonce-15534
» https://doi.org/10.14279/depositonce-15534 -
Gitelson, A. (1992). The peak near 700 nm on radiance spectra of algae and water: relationships of its magnitude and position with chlorophyll concentration. International Journal of Remote Sensing, 13(17), 3367-3373. http://doi.org/10.1080/01431169208904125
» http://doi.org/10.1080/01431169208904125 -
Gitelson, A. A., Dall’Olmo, G., Moses, W., Rundquist, D. C., Barrow, T., Fisher, T. R., Gurlin, D., & Holz, J. (2008). A simple semi-analytical model for remote estimation of chlorophyll-a in turbid waters: validation. Remote Sensing of Environment, 112(9), 3582-3593. http://doi.org/10.1016/j.rse.2008.04.015
» http://doi.org/10.1016/j.rse.2008.04.015 -
Gitelson, A. A., Gao, B. C., Li, R. R., Berdnikov, S., & Saprygin, V. (2011). Estimation of chlorophyll-a concentration in productive turbid waters using a Hyperspectral Imager for the Coastal Ocean: the Azov Sea case study. Environmental Research Letters, 6(2), 024023. http://doi.org/10.1088/1748-9326/6/2/024023
» http://doi.org/10.1088/1748-9326/6/2/024023 -
Gitelson, A. A., Nikanorov, A. M., Szabo, G. Y., & Szilagyi, F. (1986). Etude de la qualite des eaux de surface par teledetection. IAHS-AISH Publication, (157), 111-121. Retrieved in 2024, February 20, from https://www.researchgate.net/publication/235462291_Etude_de_la_qualite_des_eaux_surface_par_teledetection
» https://www.researchgate.net/publication/235462291_Etude_de_la_qualite_des_eaux_surface_par_teledetection -
Godlewska, M., Balk, H., Izydorczyk, K., Kaczkowski, Z., Mankiewicz-Boczek, J., & Ye, S. (2023). Rapid in situ assessment of high-resolution spatial and temporal distribution of cyanobacterial blooms using fishery echosounder. The Science of the Total Environment, 857, 159492. http://doi.org/10.1016/j.scitotenv.2022.159492
» http://doi.org/10.1016/j.scitotenv.2022.159492 -
Gower, J. F. R., Denman, K. L., & Holyer, R. J. (1980). Phytoplankton patchiness indicates the fluctuation spectrum of mesoscale oceanic structure. Nature, 288(5787), 157-159. http://doi.org/10.1038/288157a0
» http://doi.org/10.1038/288157a0 -
Hagen, G., & Kochert, G. (1980). Protein synthesis in a new system for the study of senescence. Experimental Cell Research, 127(2), 451-457. http://doi.org/10.1016/0014-4827(80)90452-8
» http://doi.org/10.1016/0014-4827(80)90452-8 -
Heenkenda, M. K., Joyce, K. E., Maier, S. W., & De Bruin, S. (2015). Quantifying mangrove chlorophyll from high spatial resolution imagery. ISPRS Journal of Photogrammetry and Remote Sensing, 108, 234-244. http://doi.org/10.1016/j.isprsjprs.2015.08.003
» http://doi.org/10.1016/j.isprsjprs.2015.08.003 -
Johan, F. B., Jafri, M. Z. B. M., San, L. H., Omar, W. M. W., & Ho, T. C. (2018). Chlorophyll a concentration of fresh water phytoplankton analysed by algorithmic based spectroscopy. Journal of Physics: Conference Series, 1083, 012015. http://dx.doi.org/10.1088/1742-6596/1083/1/012015
» http://dx.doi.org/10.1088/1742-6596/1083/1/012015 -
Kandilian, R., Soulies, A., Pruvost, J., Rousseau, B., Legrand, J., & Pilon, L. (2016). Simple method for measuring the spectral absorption cross-section of microalgae. Chemical Engineering Science, 146, 357-368. http://doi.org/10.1016/j.ces.2016.02.039
» http://doi.org/10.1016/j.ces.2016.02.039 -
Kaplan, D. (2013). Absorption and adsorption of heavy metals by microalgae. In A. Richmond & Q. Hu (Eds.), Handbook of microalgal culture: applied phycology and biotechnology (2nd ed.). Hoboken: Blackwell Publishing Ltd. http://doi.org/10.1002/9781118567166.ch32
» http://doi.org/10.1002/9781118567166.ch32 -
Kokaly, R. F., Asner, G. P., Ollinger, S. V., Amrtin, M. E., & Wessman, C. A. (2009). Characterizing canopy biochemistry from imaging spectroscopy and its application to ecosystem studies. Remote Sensing of Environment, 113(1), 78-91. http://doi.org/10.1016/j.rse.2008.10.018
» http://doi.org/10.1016/j.rse.2008.10.018 -
Krienitz, L., Hegewald, E. H., Hepperle, D., Huss, V. A. R., Rohr, T., & Wolf, M. (2004). Phylogenetic relationship of Chlorella and Parachlorella gen. nov. (Chlorophyta, Trebouxiophyceae). Phycologia, 43(5), 529-542. http://doi.org/10.2216/i0031-8884-43-5-529.1
» http://doi.org/10.2216/i0031-8884-43-5-529.1 -
Le, C., Hu, C., Cannizzaro, J., English, D., Muller-Karger, F., & Lee, Z. (2013). Evaluation of chlorophyll-a remote sensing algorithms for an optically complex estuary. Remote Sensing of Environment, 129, 75-89. http://doi.org/10.1016/j.rse.2012.11.001
» http://doi.org/10.1016/j.rse.2012.11.001 -
Li, S., Song, K., Wang, S., Liu, G., Wen, Z., Shang, Y., Lyu, L., Chen, F., Xu, S., Tao, H., Du, Y., Fang, C., & Mu, G. (2021). Quantification of chlorophyll-a in typical lakes across China using Sentinel-2 MSI imagery with machine learning algorithm. The Science of the Total Environment, 778, 146271. http://doi.org/10.1016/j.scitotenv.2021.146271
» http://doi.org/10.1016/j.scitotenv.2021.146271 -
Li, Z., Li, S. X., Li, T. R., Gao, X. X., & Zhu, L. D. (2022). Physiological and transcriptomic responses of Chlorella sorokiniana to ciprofloxacin reveal olecular mechanisms for antibiotic removal. iScience, 25(7), 104638. http://doi.org/10.1016/j.isci.2022.104638
» http://doi.org/10.1016/j.isci.2022.104638 -
Lin, C., Popescu, S. C., Huang, S. C., Chang, P. T., & Wen, H. L. (2015). A novel reflectance-based model for evaluating chlorophyll concentrations of fresh and water-stressed leaves. Biogeosciences, 12(1), 49-66. http://doi.org/10.5194/bg-12-49-2015
» http://doi.org/10.5194/bg-12-49-2015 -
Lobo, F. L., Barbosa, C. C., Novo, E. M., & Yunes, J. S. (2009). Mapping potential cyanobacterial bloom using Hyperion/EO-1 data in Patos Lagoon estuary. Acta Limnologica Brasiliensia, 21(3), 299-308. Retrieved in 2024, February 20, from https://repositorio.furg.br/bitstream/handle/1/2134/Mapping%20potential%20cyanobacterial%20bloom%20using%20HyperionEO-1%20data%20in%20the%20Patos%20Lagoon%20estuary.pdf?sequence=1&isAllowed=y
» https://repositorio.furg.br/bitstream/handle/1/2134/Mapping%20potential%20cyanobacterial%20bloom%20using%20HyperionEO-1%20data%20in%20the%20Patos%20Lagoon%20estuary.pdf?sequence=1&isAllowed=y -
Lopes, F. B., Barbosa, C. C. F., Novo, E. M. L. M., Carvalho, L. A. S., Andrade, E. M., & Teixeira, A. S. (2021). Modelling chlorophyll-a concentrations in a continental aquatic ecosystem of the Brazilian semi-arid region based on remote sensing. Revista Ciência Agronômica, 52(2), e20207210. http://doi.org/10.5935/1806-6690.20210028
» http://doi.org/10.5935/1806-6690.20210028 -
Luo, W., Pflugmacher, S., Pröschold, T., Walz, N., & Krienitz, L. (2006). Genotype versus Phenotype Variability in Chlorella and Micractinium (Chlorophyta, Trebouxiophyceae). Protist, 157(3), 315-333. http://doi.org/10.1016/j.protis.2006.05.006
» http://doi.org/10.1016/j.protis.2006.05.006 -
Mishra, S., & Mishra, D. R. (2012). Normalized difference chlorophyll index: a novel model for remote estimation of chlorophyll-a concentration in turbid productive waters. Remote Sensing of Environment, 117, 394-406. http://doi.org/10.1016/j.rse.2011.10.016
» http://doi.org/10.1016/j.rse.2011.10.016 -
Moran, P. A. (1950). Notes on continuous stochastic phenomena. Biometrika, 37(1/2), 17-23. http://doi.org/10.2307/2332142
» http://doi.org/10.2307/2332142 -
Najafzadeh, M., & Basirian, S. (2023). Evaluation of river water quality index using remote sensing and artificial intelligence models. Remote Sensing, 15(9), 2359. http://doi.org/10.3390/rs15092359
» http://doi.org/10.3390/rs15092359 -
Neville, R. A., & Gower, J. F. R. (1977). Passive remote sensing of phytoplankton via chlorophyll α fluorescence. Journal of Geophysical Research, 82(24), 3487-3493. http://doi.org/10.1029/JC082i024p03487
» http://doi.org/10.1029/JC082i024p03487 -
Nush, E. A. (1980). Comparison of diferente methods for chlorophyll and phaeopigments determination. Archiv für Hydrobiologie, 14(1), 14-36. http://dx.doi.org/10.4236/abc.2013.35054
» http://dx.doi.org/10.4236/abc.2013.35054 -
Okomoda, V. T., Abdulrahman, A. K., Khatoon, H., Mithun, S., Oladimeji, A. S., Abol-Munafi, A. B., Alabi, K. I., Alamanjo, C. C., & Anuar, H. (2021). Performance characteristics of Ankistrodesmus falcatus in different culture media and concentration. Plants, 10(4), 755. http://doi.org/10.3390/plants10040755
» http://doi.org/10.3390/plants10040755 -
Palmer, C. M. (1960). Algas e suprimento de água na área de São Paulo. Revista do Departamento de Água e Esgoto, 21, 11-15, Retrieved in 2024, February 20, from http://revistadae.com.br/artigos/artigo_edicao_37_n_737.pdf
» http://revistadae.com.br/artigos/artigo_edicao_37_n_737.pdf -
Pearsall, W. H., & Loose, L. (1937). The growth of Chlorella vulgaris in pure culture. Proceedings of the Royal Society of London. Series B, Biological Sciences, 121(824), 451-501. http://doi.org/10.1098/rspb.1936.0075
» http://doi.org/10.1098/rspb.1936.0075 -
Pérez-Morales, A., Martínez-López, A., & Camalich-Carpizo, J. M. (2015). Dry weight, carbon, c/n ratio, hydrogen, and chlorophyll variation during exponential growth of selected microalgae species used in aquaculture. Cicimar Oceánides, 30(1), 33-34. http://doi.org/10.37543/oceanides.v30i1.168
» http://doi.org/10.37543/oceanides.v30i1.168 -
Pommerville, J. C., & Kochert, G. (1982). Effects of senescence on somatic cell physiology in the green alga Volvox carteri. Experimental Cell Research, 140(1), 39-45. http://doi.org/10.1016/0014-4827(82)90153-7
» http://doi.org/10.1016/0014-4827(82)90153-7 -
Pompêo, M., Moschini-Carlos, V., Bitencourt, M. D., Sòria-Perpinyà, X., Vicente, E., & Delegido, J. (2021). Water quality assessment using Sentinel-2 imagery with estimates of chlorophyll a, Secchi disk depth, and Cyanobacteria cell number: the Cantareira System reservoirs (São Paulo, Brazil). Environmental Science and Pollution Research International, 28(26), 34990-35011. http://doi.org/10.1007/s11356-021-12975-x
» http://doi.org/10.1007/s11356-021-12975-x -
R Core Team. (2020). R: a language and environment for statistical computing Vienna, Austria: R Foundation for Statistical Computing. Retrieved in 2024, February 20, from https://www.R-project.org/
» https://www.R-project.org/ - Richa, Sinha, R. P., & Häder, D. P. (2016). Effects of global change, including UV and UV screening compounds. In M. A. Borowitzka, J. Beardall & J. A. Raven (Eds.), The Physiology of Microalgae. Developments in Applied Phycology (Vol. 6, pp. 373-409). Cham: Springer. https://doi.org/10.1007/978-3-319-24945-2_17.
-
RStudio. (2019). RStudio: integrated development for R Boston, MA: RStudio, Inc. Retrieved in 2024, February 20, from http://www.rstudio.com/
» http://www.rstudio.com/ - Rundquist, D. C., Han, L., Schalles, J. F., & Peake, J. S. (1996). Remote measurement of algal chlorophyll in surface waters: the case for the first derivative of reflectance near 690 nm. Photogrammetric Engineering and Remote Sensing, 62(2), 195-200.
-
Saberioon, M., Brom, J., Nedbal, V., Souc̆ek, P., & Císar̆, P. (2020). Chlorophyll-a and total suspended solids retrieval and mapping using Sentinel-2A and machine learning for inland waters. Ecological Indicators, 113, 106236. http://doi.org/10.1016/j.ecolind.2020.106236
» http://doi.org/10.1016/j.ecolind.2020.106236 -
Safi, C., Zabib, B., Merah, O., Pontalier, P. Y., & Vaca-Garcia, C. (2014). Morphology, composition, production, processing and applications of Chlorella vulgaris: a review. Renewable & Sustainable Energy Reviews, 35, 265-278. http://doi.org/10.1016/j.rser.2014.04.007
» http://doi.org/10.1016/j.rser.2014.04.007 -
Santos, E. P., De Jesus, T. B., Carneiro, A. D. S. R., Santos, R. L., & Costa, T. S. (2021). Espectrorradiometria de Campo e Dados Sentinel-2 Aplicado ao Estudo da Clorofila-A em corpos hídricos de reservatórios. Anuário do Instituto de Geociências, 44, http://doi.org/10.11137/1982-3908_2021_44_38707
» http://doi.org/10.11137/1982-3908_2021_44_38707 -
Serôdio, J., Cartaxana, P., Coelho, H., & Vieira, S. (2009). Effects of chlorophyll fluorescence on the estimation of microphytobenthos biomass using spectral reflectance indices. Remote Sensing of Environment, 113(8), 1760-1768. http://doi.org/10.1016/j.rse.2009.04.003
» http://doi.org/10.1016/j.rse.2009.04.003 -
Simkin, A. J., Kapoor, L., Doss, C. G. P., Hofmann, T. A., Lawson, T., & Ramamoorthy, S. (2022). The role of photosynthesis related pigments in light harvesting, photoprotection and enhancement of photosynthetic yield in planta. Photosynthesis Research, 152(1), 23-42. http://doi.org/10.1007/s11120-021-00892-6
» http://doi.org/10.1007/s11120-021-00892-6 -
Sims, D. A., & Gamon, J. A. (2002). Relationships between leaf pigment content and spectral reflectance across a wide range of species, leaf structures and developmental stages. Remote Sensing of Environment, 81(2–3), 337-354. http://doi.org/10.1016/S0034-4257(02)00010-X
» http://doi.org/10.1016/S0034-4257(02)00010-X -
Singh, G., & Patidar, S. K. (2020). Water quality restoration by harvesting mixed culture microalgae using Moringa oleifera. Water Environment Research, 92(9), 1268-1282. http://doi.org/10.1002/wer.1322
» http://doi.org/10.1002/wer.1322 -
Sipaúba-Tavares, L. H., & Rocha, O. (1993). Cultivo em larga escala de organismos planctônicos para alimentação de larvas e alevinos de peixes: i-algas clorofíceas. Biotemas, 6(1), 93-106. https://doi.org/10.5007/%25x
» https://doi.org/10.5007/%25x -
Sipaúba-Tavares, L. H., Fernandes, J. B. K., Melo-Santos, G. L., & Scardoeli-Truzzi, B. (2019). Microalgae Ankistrodesmus gracilis as feed ingrediente for ornamental fish Xiphophorus maculatus. International Aquatic Research, 11(2), 125-134. http://doi.org/10.1007/s40071-019-0223-z
» http://doi.org/10.1007/s40071-019-0223-z -
Sipaúba-Tavares, L. H., Millan, R. N., De Almeida Berchielli, F., & De Souza Braga, F. M. (2011). Use of alternative media and different types of recipients in a laboratory culture of Ankistrodesmus gracilis (Reinsch) Korshikov (Chlorophyceae). Acta Scientiarum. Biological Sciences, 33(3), 247-253. http://doi.org/10.4025/actascibiolsci.v33i3.8046
» http://doi.org/10.4025/actascibiolsci.v33i3.8046 -
Solovchenko, A. (2023). Seeing good and bad: optical sensing of microalgal culture condition. Algal Research, 71, 103071. http://doi.org/10.1016/j.algal.2023.103071
» http://doi.org/10.1016/j.algal.2023.103071 -
Song, K., Li, L., Tedesco, L. P., Li, S., Duan, H., Liu, D., Hall, B. E., Du, J., Li, Z., Shi, K., & Zhao, Y. (2013). Remote estimation of chlorophyll-a in turbid inland waters: three-band model versus GA-PLS model. Remote Sensing of Environment, 136, 342-357. http://doi.org/10.1016/j.rse.2013.05.017
» http://doi.org/10.1016/j.rse.2013.05.017 -
Sonobe, R., Yamashita, H., Mihara, H., Morita, A., & Ikka, T. (2021). Hyperspectral reflectance sensing for quantifying leaf chlorophyll content in wasabi leaves using spectral pre-processing techniques and machine learning algorithms. International Journal of Remote Sensing, 42(4), 1311-1329. http://doi.org/10.1080/01431161.2020.1826065
» http://doi.org/10.1080/01431161.2020.1826065 -
Šoštarič, M., Golob, J., Bricelj, M., Klinar, D., & Pivec, A. (2009). Studies on the growth of Chlorella vulgaris in culture media with different carbon sources. Chemical and Biochemical Engineering Quarterly, 23(4), 471-477. Retrieved in 2024, February 20, from https://hrcak.srce.hr/45409
» https://hrcak.srce.hr/45409 -
Stemkovski, M., Baraldi, R., Flores, K. B., & Banks, H. T. (2016). Validation of a mathematical model for green algae (Raphidocelis subcapitata) growth and implications for a coupled dynamical system with Daphnia magna. Applied Sciences (Basel, Switzerland), 6(5), 155. http://doi.org/10.3390/app6050155
» http://doi.org/10.3390/app6050155 -
Tester, P. A., Litaker, R. W., & Berdalet, E. (2020). Climate change and harmful benthic microalgae. Harmful Algae, 91, 101655. http://doi.org/10.1016/j.hal.2019.101655
» http://doi.org/10.1016/j.hal.2019.101655 -
Thomas, J. R., & Gaussman, H. W. (1977). Leaf reflectance vs. leaf chlorophyll and carotenoid concentration for elght crops. Agronomy Journal, 69(5), 799-802. http://doi.org/10.2134/agronj1977.00021962006900050017x
» http://doi.org/10.2134/agronj1977.00021962006900050017x -
Torremorell, A., Hegoburu, C., Brandimarte, A. L., Rodrigues, E. H., Pompêo, M., Cardoso-Silva, S., Moschini-Carlos, V., Caputo, L., Fierro, P., Mojica, I., Matta, A. P. L., Donato, C., Jiménez, P., Molinero, J., Rios-Rouma, B., Goyenola, G., Iglesias, C., López-Rodriguez, A., Meerhoff, M., Pacheco, J. P., Mello, F. T., Rodrígues-Olarte, D., Gomez, M. B., Montoya, J. V., López-Doval, J. C., & Navarro, E. (2021). Current and future threats for the ecological quality management of South American freshwater ecosystems. Inland Waters, 11(2), 125-140. http://doi.org/10.1080/20442041.2019.1608115
» http://doi.org/10.1080/20442041.2019.1608115 -
Torres, E. M. (2016). Microalgae sorption of ten individual heavy metals and their effects on growth and lipid accumulation (Master's thesis). Utah State University, Logan. Retrieved in 2024, February 20, from https://digitalcommons.usu.edu/cgi/viewcontent.cgi?article=6005&context=etd
» https://digitalcommons.usu.edu/cgi/viewcontent.cgi?article=6005&context=etd -
Hart, R., & Hart, R. C. (2006).Reservoirs and their Management: A Review of the Literature since 1990 Retrieved in 2024, February 20, from https://www.wrc.org.za/wp-content/uploads/mdocs/KV%20173%20final.pdf
» https://www.wrc.org.za/wp-content/uploads/mdocs/KV%20173%20final.pdf -
Vidotti, E. C., & Rollemberg, M. C. E. (2004). Algas: da economia nos ambientes aquáticos à biorremediação e à química analítica. Quimica Nova, 27(1), 139-145. http://doi.org/10.1590/S0100-40422004000100024
» http://doi.org/10.1590/S0100-40422004000100024 -
Wang, H., Zhu, R., Zhang, J., Ni, L., Shen, H., & Xie, P. (2018). A novel and convenient method for early warning of algal cell density by chlorophyll fluorescence parameters and its application in a highland lake. Frontiers in Plant Science, 9, 869. http://doi.org/10.3389/fpls.2018.00869
» http://doi.org/10.3389/fpls.2018.00869 -
Wang, Y., Liu, D., Wang, Y., Gao, Z., & Keesing, J. K. (2019). Evaluation of standard and regional satellite chlorophyll-a algorithms for moderate-resolution imaging spectroradiometer (MODIS) in the Bohai and Yellow Seas, China: A comparison of chlorophyll-a magnitude and seasonality. International Journal of Remote Sensing, 40(13), 4980-4995. http://doi.org/10.1080/01431161.2019.1577579
» http://doi.org/10.1080/01431161.2019.1577579 -
Watanabe, F., Alcântara, E., Bernardo, N., De Andrade, C., Gomes, A. C., Do Carmo, A., Rodrigues, T., & Rotta, L. H. (2019). Mapping the chlorophyll-a horizontal gradient in a cascading reservoirs system using MSI Sentinel-2A images. Advances in Space Research, 64(3), 581-590. http://doi.org/10.1016/j.asr.2019.04.035
» http://doi.org/10.1016/j.asr.2019.04.035 -
Watanabe, F., Alcântara, E., Rodrigues, T., Imai, N., Barbosa, C., & Rotta, L. (2015). Estimation of Chlorophyll-a Concentration and the Trophic State of the Barra Bonita Hydroelectric Reservoir Using OLI/Landsat-8 Images. International Journal of Environmental Research and Public Health, 12(9), 10391-10417. http://doi.org/10.3390/ijerph120910391
» http://doi.org/10.3390/ijerph120910391 -
Xu, W., Wang, G., Jiang, L., Cheng, X., Zhou, W., & Cao, W. (2020). Spatiotemporal variability of surface phytoplankton carbon and carbon-to-chlorophyll a ratio in the South China Sea based on satellite data. Remote Sensing, 13(1), 30. http://doi.org/10.3390/rs13010030
» http://doi.org/10.3390/rs13010030 -
Yu, B., Xu, L., Peng, J., Hu, Z., & Wong, A. (2020). Global chlorophyll-a concentration estimation from moderate resolution imaging spectroradiometer using convolutional neural networks. Journal of Applied Remote Sensing, 14(3), 034520-034520. http://doi.org/10.1117/1.JRS.14.034520
» http://doi.org/10.1117/1.JRS.14.034520 -
Yu, X., Yi, H., Liu, X., Wang, Y., Liu, X., & Zhang, H. (2016). Remote-sensing estimation of dissolved inorganic nitrogen concentration in the bohai sea using band combinations derived from modis data. International Journal of Remote Sensing, 37(2), 327-340. http://doi.org/10.1080/01431161.2015.1125555
» http://doi.org/10.1080/01431161.2015.1125555 -
Zarco-Tejada, P. J. (2000). Hyperspectral remote sensing of closed forest canopies: Estimation of chlorophyll fluorescence and pigment content Toronto, ON, Canada: York University. Retrieved in 2024, February 20, from https://www.researchgate.net/publication/241257435_Hyperspectral_remote_sensing_of_closed_forest_canopies_Estimation_of_chlorophyll_fluorescence_and_pigment_content
» https://www.researchgate.net/publication/241257435_Hyperspectral_remote_sensing_of_closed_forest_canopies_Estimation_of_chlorophyll_fluorescence_and_pigment_content -
Zeileis, A., & Hothorn, T. (2002). Diagnostic checking in regression relationships. R News, 2(3), 7-10. Retrieved in 2024, February 20, from https://cran.r-project.org/web/packages/lmtest/vignettes/lmtest-intro.pdf
» https://cran.r-project.org/web/packages/lmtest/vignettes/lmtest-intro.pdf -
Zhang, L., Thomas, S., & Mitsch, W. J. (2017). Design of real-time and long-term hydrologic and water quality wetland monitoring stations in South Florida, USA. Ecological Engineering, 108(Pt B), 446-455. https://doi.org/10.1016/j.ecoleng.2017.06.021
» https://doi.org/10.1016/j.ecoleng.2017.06.021 -
Zhou, X., Zhang, J., Chen, D., Huang, Y., Kong, W., Yuan, L., Huichun, Y., & Huang, W. (2020). Assessment of leaf chlorophyll content models for winter wheat using Landsat-8 multispectral remote sensing data. Remote Sensing, 12(16), 2574. http://doi.org/10.3390/rs12162574
» http://doi.org/10.3390/rs12162574 -
Zonneveld, C. (1998). A cell-based model for the chlorophyll a to carbon ratio in phytoplankton. Ecological Modelling, 113(1-3), 55-70. http://doi.org/10.1016/S0304-3800(98)00134-3
» http://doi.org/10.1016/S0304-3800(98)00134-3
Edited by
-
Editor in-Chief:
Adilson Pinheiro
-
Associated Editor:
Ibraim Fantin da Cruz