
 Spatial Dynamics of Age Structure, the Demographic Window, and Formal Employment in the Northern Semi-arid Region
Abstract
This article maps the spatial autocorrelation of age structure across municipalities in the Northern Semi-arid Region (SemSet) and compares the evolution and utilization of the demographic window in two intraregional configurations: a younger SemSet and an aging SemSet. To this end, the study employs the Local Indicators of Spatial Association and the Formal Employment Index (FEI), based on data from the Censuses (2000-2022) and the Annual Social Information Report (2000-2021). The identified patterns confirm that the dynamics of age structure vary by location and therefore must be examined across different spatial scales. The demographic window in the aging SemSet opened in 2005, whereas in the younger SemSet it opened in 2009. In the aging SemSet, in 2021, the FEI reached 11.80%, whereas in the younger SemSet it reached 12.39%, indicating that approximately twelve out of every 100 individuals of working age were formally employed. Despite this progress, the results indicate limited utilization of the demographic window and reveal underlying economic fragility.
Keywords:
Methods, Techniques, and Planning Instruments; Socio-spatial Differentiation; Regional Planning; Regional Development; Demographic Transition; Demographic Window; Northern Semi-arid Region
Resumo
Este artigo mapeia a autocorrelação espacial da estrutura etária entre os municípios do Semiárido Setentrional (SemSet) e compara a evolução e o aproveitamento da janela demográfica em dois recortes intrarregionais, um SemSet jovem e outro envelhecido. Para tanto, utilizaram-se o Índice de Moran Local e o Índice de Emprego Formal (IEF), instrumentalizados pelos dados dos Censos Demográficos (2000-2022) e da Relação Anual de Informações Sociais (2000-2021). Os padrões identificados ratificam que a dinâmica da estrutura etária varia com o lugar e, por isso, deve ser estudada nas diferentes escalas. A janela demográfica no SemSet envelhecido abriu-se em 2005 e no SemSet jovem em 2009. No envelhecido, o IEF em 2021 foi de 11,80%, enquanto, no rejuvenescido, foi de 12,39%, isto é, doze entre cem pessoas em idade ativa tinham emprego formal. Apesar da evolução, os resultados caracterizam baixo aproveitamento da janela e denotam fragilidade econômica.
Palavras-chave:
Métodos, Técnicas e Instrumentos de Planejamento; Diferenciação Socioespacial; Planejamento Regional; Desenvolvimento Regional; Transição Demográfica; Janela Demográfica; Semiárido Setentrional
Introduction
The end of the first quarter of the twenty-first century in Brazil is characterized by societal shifts that differ significantly from those of previous periods, including progressive population ageing, increased female participation in the labor market, and family structures with fewer children per household.
These characteristics reflect a society in constant adaptation, in which demographic dynamics interact with social relations and economic structures. This process requires adjustments aimed at ensuring the well-being of individuals across all age groups, with direct implications for the public policy agenda. Such changes are a consequence of the demographic transition that began in Brazil during the 1970s (Alves, 2020; Oliveira, 2019; Vasconcelos; Gomes, 2012; Brito, 2008).
This phenomenon poses both economic and social challenges and opportunities: it generates a growing demand for robust health care and social security systems, while the labor force initially expands but subsequently tends to contract and age. In addition, there is an increasing need for care policies, whether to promote the inclusion and support of the older population or to provide assistance to families-particularly women participating in the labor market-who require adequate support networks1.
The concept of demographic transition refers to changes that take place in the age structure of a population, characterized by a shift from high fertility and mortality rates to lower and more stable levels. This transition is commonly associated with economic and social transformations, including urbanization, rising educational attainment, and improvements in health conditions (Lee, 2003; Vasconcelos; Gomes, 2012).
Another key feature of this demographic transition process is the so-called window of opportunity. This concept is grounded in the idea that this “window” is associated with potential economic gains arising from changes in the population’s age structure. It refers to the period during which the working-age population (WAP) predominates relative to other age groups (Alves, 2008; Bloom, Canning; Sevilla, 2003).
This context fosters the expansion of production, employment, and productivity, while also encouraging higher aggregate rates of savings and increased contributions to social security systems. Taken together, these effects create favorable conditions for economic development (Bloom, Canning; Sevilla, 2003; Kotschy; Bloom, 2023; Malmberg, Malmberg; Maskell, 2023).
The relationship between economics and demography lies at the origins of the demographic transition, which began in Europe in the late eighteenth century, particularly in countries such as the United Kingdom and France, where industrialization reshaped population dynamics. This process subsequently spread worldwide and is projected to be completed by 2100 (Coale, 1989; Lee, 2003).
Whether viewed from the classical perspective of the so-called rupture theorists-who argue that shocks associated with modernity drove these changes (Lesthaeghe, 2014; Coleman, 2006; Coale, 1989; Van de Kaa, 1987)-or from the perspective of continuity theorists (Caldwell, 1976; Davis, 1963), who posit a multiphasic process, this transition has constituted a central theory in demography.
In the traditional model, the transition unfolds in four stages. Initially, high fertility and mortality rates result in slow population growth. Subsequently, mortality declines rapidly due to advances in health and sanitation, while fertility remains high, leading to accelerated growth. In the third stage, fertility also declines, thereby slowing demographic growth. Finally, as a consequence of this pattern, the population stabilizes or may even begin to contract (Coale, 1989; Lee, 2003).
From this perspective, Van de Kaa (1987) and Lesthaeghe (2014) developed the concept of the Second Demographic Transition2. They characterized this context by reversed nuptiality-reflected in a decline in marriage and remarriage rates following separation-and by reversed timing of fertility, associated with access to modern and effective contraceptive methods, higher levels of non-marital fertility, and a higher mean age at parenthood. This transition also unfolds within a social context that contrasts with the first transition, being marked by post-materialist needs such as self-realization, increased female autonomy, and new family arrangements.
Coleman (2006), in turn, introduced the notion of the Third Demographic Transition. Within this framework, improvements in well-being affect demographic variables, while behavioral changes associated with post-materialist values intensify the complexity initiated during the first transition. This formulation emerged in a context in which countries-particularly in Western Europe-were experiencing population transformations driven by below-replacement fertility levels, high immigration rates, and the resulting ethnic diversification, with broad implications for social, cultural, and economic structures.
In summary, while the first transition focuses on declining mortality and fertility rates, the second emphasizes changes in family structures and social values, and the third highlights immigration as a central element-previously neglected in earlier models. In this context, conditioned by an ageing population structure, immigration plays a role in offsetting labor force shortages.
From another perspective, as an alternative to the stage-based model described above and grounded in the theory of change and response, Davis (1963) argued that demographic change is multifaceted. It is a continuous, reflexive, and behavioral process that, within a system of cultural values, operates as a pendulum between reproduction and the means of subsistence (the economy). Thus, delaying marriage, adopting contraception, practicing abortion, or undertaking sterilization are examples of responses to population growth.
Caldwell (1976), in turn, proposed an ethnocentric model that analyses distinct fertility behaviors-regimes with and without economic gains. In this approach, modernity is considered a necessary, although insufficient, condition for explaining changes in these behaviors, and social change is regarded as more decisive than economic change.
Within this model, urban industrial society constitutes the core driver of behavioral change and fertility decline. Family size is determined by family relations (household arrangements), and the intrafamilial flow of wealth has become transformed-shifting from children-to-parents transfers to parents-to-children transfers.
Against this backdrop, understanding the determinants of changes in the age structure and the ways in which they materialize is crucial for policymakers and researchers. As noted earlier, these changes affect economic growth, labor markets, and social services. Moreover, because they occur unevenly across populations-both in terms of pace and patterns-analyzing the spatial dynamics of these transformations is equally important.
Accordingly, alongside advances in computational capacity and the increasing availability of geographically referenced data, the use of spatial analysis and econometric models has expanded significantly. This approach enables researchers to identify patterns that are not captured by global perspectives-such as traditional regression models-and reveals local nuances in demographic data (Almeida, 2012).
In this regard, Santana et al. (2024) investigated the spatiotemporal distribution of COVID-19 in the Metropolitan Region of São Paulo between 2020 and 2022, examining the association between risk clusters and socioeconomic variables. Their findings underscored the role of territorial inequalities in the spread of the pandemic. Through non-parametric tests (Mann-Whitney and Kruskal-Wallis), the study demonstrated that socially vulnerable peripheral areas, marked by lower income levels, disproportionately concentrated both infections and deaths.
Also in the context of COVID-19, Boing et al. (2024) examined vaccination coverage among children aged five to eleven years across Brazilian municipalities in 2022, relating it to socioeconomic indicators. Using multilevel modelling and spatial analyses (bivariate Local Indicator of Spatial Association - LISA), the authors confirmed the persistence of disparities. The lowest coverage levels were observed in municipalities with low Human Development Index (HDI) scores and low educational attainment, particularly in the North and Mid-West regions, underscoring the role of social inequalities in shaping vaccination uptake.
Beyond exploratory analysis, spatial models-such as the Spatial Autoregressive Model (SAR), the Spatial Error Model (SEM), Geographically Weighted Regression (GWR), and Spatial Two-Stage Least Squares (S2SLS)-have been widely applied. These methods allow researchers to estimate local relationships between variables and to infer causal mechanisms, while explicitly accounting for spatial dependence.
Within this perspective, Stampe et al. (2025) examined the role of savings as a channel for the second demographic dividend in Brazil between 2000 and 2010, using income growth in comparable minimum areas as the outcome variable. By employing spatial models (SAR and SEM), the authors demonstrated that savings play a significant role in mitigating the effects of population ageing and revealed the presence of regional interdependence in economic performance.
Figueiredo (2025), applying SEM models to municipalities in the Northern Semi-arid Region (hereafter referred to as SemSet), estimated that a 10% reduction in the Youth Dependency Ratio (YDR) corresponds, on average, to increases in GDP per capita of 6.79%, 6.76%, and 8.72% in 2000, 2010, and 2021, respectively. Conversely, a 10% increase in the Old-Age Dependency Ratio (ODR) exerted a negative effect of 3% in 2000, 6.27% in 2010 and 8.88% in 2021. Simultaneously, a 10% increase in the ratio between the population aged 30 to 49 years relative to the remainder of working-age population raised GDP per capita by 6.58% in 2000, 10.20% in 2010, and 4.73% in 2021.
Thus, situating itself within this debate, this article maps the spatial autocorrelation of age structure across municipalities in the study area, and compares the evolution and utilization of the demographic window of opportunity in two intraregional subsets: a younger SemSet and an ageing SemSet. This approach constitutes an alternative to the conventional macro-regional approach, operationalized through exploratory spatial data analysis.
To this end, drawing on data from the 2022 Demographic Census (IBGE, 2023) and employing Local Indicators of Spatial Association, the study identifies spatial patterns in the Total Dependency Ratio (TDR), the Youth Dependency Ratio (YDR), and the Old-Age Dependency Ratio (ODR).
Subsequently, in light of these results, two semi-arid regions are compared: one younger and the other older. In this analysis, the temporal extent of the demographic window of opportunity is determined by comparing the relative share of the working-age population with the TDR, while the Formal Employment Index (FEI)-defined as the ratio of the working-age population to formal employment-captures the extent to which this window is being utilized.
The SemSet is a subregion of the Brazilian Semi-arid Region, encompassing 45.65% of its total area. In 2022, it accounted for 62.90% of the semi-arid population, corresponding to 19,521,179 individuals. Population density in the SemSet has reached 32.03 inhabitants per km², compared to 15.86 inhabitants per km² in the southern portion of the Semi-arid Region. Between 2010 and 2022, the population growth rate in the SemSet was 0.35% per year, compared to 0.17% per year in the southern area. Over the same period, Brazil’s population outside the semi-arid delimitation grew at an annual rate of 0.57%. (Figure 1)
These differentials underscore the importance of disaggregated analyses. In this regard, Birdsall (1988) argued that the effects of demographic growth vary across time, place, and circumstances and therefore do not lend themselves to generalization, but instead must be examined at different scales. This interpretation reinforces the need for public policies that take local specificities into account while not disregarding aspects of regional identities, thereby justifying the disaggregation of analyses.

This article is organized into three additional sections. The following section outlines the methodological procedures adopted in the analysis. The subsequent section presents and discusses the results of the spatial autocorrelation of age structure and of the evolution and utilization of the demographic window of opportunity. The concluding section summarizes the main findings and discusses the study’s limitations and directions for future research.
1. Methods
The description of the age structure is based on data from the Demographic Censuses conducted between 2000 and 2022, specifically the indicator “resident population, by age group”. The analysis of formal employment, in turn, draws on data on “active employment ties as of 31 December”, obtained from the Annual Social Information Report (RAIS) for the period from 2000 to 2021 (MTE, n.d.).
1.1 Age structure
To describe and analyze the dynamics of the age structure, in addition to geometric growth rates, classical indicators commonly used to assess the population’s static characteristics were employed, namely demographic dependency ratios. These indicators assume that the younger population (aged 0-14 years) and the older population (aged 65 years and over) are economically dependent on the population aged 15-64 years.
Thus, the TDR captures the ratio between the economically dependent population and the working-age population. A TDR of 90, for example, indicates that 90 dependents rely on everyone hundred working-age individuals, a configuration associated with considerable social and economic pressures.
Understanding the nature of these challenges requires attention to the composition of this indicator and therefore to its disaggregation into the YDR and the ODR. A high and rising YDR implies greater demand for child-oriented services, particularly investments in basic education. Conversely, increases in the ODR signals growing pressure on health care and social security systems. While the first scenario reflects the early stages of the demographic transition, the second reflects the population ageing characteristic of its more advanced stages (Lee, 2003).
In addition, specific indicators for the WAP are analyzed in order to measure and characterize it. To some extent, these indicators link the demographic dimension to employment dynamics. They include the relative share of the WAP in the total population and its age composition. These measures serve as consistent proxies for the size and profile of the labor supply, as well as for employment and skills requirements.
The younger the WAP-particularly those aged 15-29 years-the greater the scope for aligning employment policies with investments in formal education, including basic and tertiary education. This age profile implies a longer period during which the demographic window of opportunity remains “open”, thereby allowing sufficient time for education-oriented policy agendas to mature. The resulting demographic dividend would therefore stem from productivity gains associated with a more educated working-age population.
By contrast, when an adult WAP-particularly those aged 30-44 years-predominates, there is greater pressure for the immediate creation of jobs, often requiring lower levels of qualification. In such contexts, investments in formal education may no longer have sufficient time to yield adequate returns. Accordingly, a more decisive role for employment policies should be combined with investments in technical and vocational training, whose returns are more immediate.
Lastly, when a mature WAP-particularly those aged 45-64 years-predominates, investments in education entail greater uncertainty regarding returns, whereas productivity gains driven by technological innovation, in conjunction with employment policies, become more appropriate for promoting the effective use of the demographic window of opportunity. Under such conditions, the gains derived from the “demographic bonus” are smaller than in the two previous cases.
1.2 Formal employment
Formal employment is defined here in accordance with the categories adopted in the RAIS (MTE, n.d.) and therefore comprises employment relationships of workers governed by the Consolidation of Labor Laws (CLT), statutory civil servants, workers under temporary contracts, and casual workers when hired through unions. The stock of these employment ties is used as a proxy for the level of employment. This choice is justified by the fact that individuals may hold multiple jobs; consequently, the number of employment ties differs from the number of employed persons and may therefore overestimate the level of formal employment.
The use of formal employment as an analytical category is justified by the fact that it generally offers better working conditions, social protection, and stability, thereby reflecting a more productive and sustainable use of the WAP. Consequently, economies with higher levels of formal employment tend to exhibit higher productivity levels, which are directly related to the effective utilization of the demographic window. In addition, data on formal employment are available at the municipal level, enabling the intended spatial analysis.
Accordingly, the analysis of the dynamics of formal employment over the period from 2000 to 20213 for the two semi-arid subregions is conducted using the FEI, as proposed by Reiff, Santos, and Rocha (2007). This index is defined as the ratio between the stock of employment ties and the working-age population, and is directly influenced by improvements in employment and inversely by increases in the working-age population.
To operationalize the FEI, it was necessary to estimate the total number of person-years in the WAP, considering exposure as of 31 December of each year, which corresponds to the reference date for the stock of employment ties4. For this purpose, the geometric growth method was applied between the Demographic Censuses of 2000, 2010, and 2022 (IBGE, 2003, 2011, 2023), with interpolation used to estimate values for the intercensal years between 2000 and 2021.
In addition to being simple and intuitive, the FEI provides an objective measure of the extent to which the WAP is absorbed into the formal labor market, thereby highlighting the degree to which the population’s economic potential is utilized. Moreover, because formal employment is associated with tax revenue generation, access to social security benefits, and greater job security, the FEI serves as a useful indicator for simultaneously assessing economic and social progress.
Although the FEI constitutes a measure of the outcome of efforts to exploit the demographic window, its limitations should be acknowledged. The index is sensitive to economic shocks and labor market policies, such that economic crises or processes of legal flexibilization may affect employment levels without necessarily reflecting the underlying demographic potential.
Moreover, because it does not account for informality, the FEI underestimates the economic utilization of the demographic window and does not differentiate among types of formal employment; therefore, it does not capture wage levels. In addition, although it is a useful measure of insertion into the formal labor market, it fails to account for other factors that may influence the utilization of the window, such as educational attainment or social mobility.
Lastly, other sources of bias should be considered. While the stock of workers is subject to reporting errors, the WAP does not distinguish individuals according to their labor force status. Moreover, the analysis assumes that the place of residence and the place of work are located in the same municipality, thereby disregarding commuting flows as well as remote or hybrid work arrangements.
1.3 Spatial analysis
Spatial analysis of municipalities was conducted using thematic and correlation maps. Thematic maps depict the spatial distribution of variables, classified by quartiles, while correlation maps assess whether this distribution is random or forms clusters with distinct patterns, thereby revealing spatial dependence.
This analysis is based on the Local Indicator of Spatial Association, a statistic that quantifies spatial dependence and spatial heterogeneity. Assuming data normality, it examines covariance to measure the degree of interdependence among polygons, using a spatial contiguity (neighborhood) matrix (Almeida, 2012). The method produces a value for each municipality, thereby enabling the identification of spatial clusters. Formally, it is defined as:
In the expression, denotes the number of points or areas (municipalities), is the value of the variable of interest for the point (area), refers to the indicator under analysis, and is an element of the spatial weights matrix representing the relationship between all pairs of points (areas) and .
The maps classify municipalities as “High-High” and “Low-Low” when they contribute to positive autocorrelation, indicating the presence of clusters; “High-Low” and “Low-High” indicate contributions to negative autocorrelation, highlighting transition areas where high values are surrounded by low values, and vice versa (Almeida, 2012).
The spatial weights matrix adopted follows the geographic queen contiguity criterion, with 999 permutations. Widely employed in the literature (Stampe, Pozzobon; Niquito, 2020; Tyszler, 2006) for its comprehensive definition of neighborhood, it considers all municipalities that share any boundary point or vertex as neighbors, thereby capturing spatial interactions more accurately (Almeida, 2012).
To capture this connectivity, a second-order spatial matrix was employed; i.e., in addition to directly adjacent municipalities (first order), neighbors of neighbors (second order) were also included. By considering indirectly connected areas, this configuration enhances the ability to detect spatial interactions, which is particularly important in regions with high population mobility between municipalities.
In this regard, Tyszler (2006) notes that higher-order matrices provide a broader, more effective means of capturing diffuse effects, such as those related to age structure. Moreover, given that the SemSet region predominantly consists of small municipalities or municipalities with few neighbors, the second-order matrix increases connectivity, rendering the analysis more stable and less prone to local effects.
With this in mind, the following sections apply the methodological procedures outlined above to conduct spatial analyses of the demographic structure in the SemSet, while also characterizing and examining the evolution of formal employment as a proxy for the utilization of the demographic window of opportunity.
2. Age Structure and Window of Opportunity
2.1 Dependence and heterogeneity among SemSet municipalities
Analysis of the age structure indicates that in 2022 the average dependency ratio (DR) in SemSet municipalities was 48.96. This indicates that for every 100 working-age individuals, there were approximately 49 dependents. The median DR of 49.14 suggests that roughly 50% of the municipalities had values either above or below this value.
This result signals a slowdown in the pace of TDR reduction and reflects the progression of demographic transition (Lee, 2003). In SemSet, the TDR was 97.22 in 1970 and 82.91 in 1991, corresponding to a reduction of 14.31 dependents. In the following decades, likely due to changes in fertility, this decrease nearly doubled between 1991 and 2010, when the TDR reached 54.46 (Figueiredo, 2025)5.
In this context, Figure 2 categorizes the municipalities by total dependency ratio (TDR). Lighter shades indicate lower TDR values, with the first quartile representing 25% of municipalities with the lowest TDR, ranging from 39.18 to 46.59 dependents per 100 working-age individuals. Conversely, the last quartile shows that approximately 25% of municipalities presented a TDR between 51.29 and 60.67 dependents per 100 working-age individuals.

In the two intermediate classes, the narrower range is notable, indicating a greater concentration around the mean TDR of 48.96. Together, they demonstrate that 50% of municipalities reported a TDR between 46.59 and 51.29 dependents per 100 working-age individuals. Examples include Marcolândia (PI), with 48.27; Barbalha (CE), 46.79; Queimadas (PB), 49.71; Arapiraca (PE), 51.00; Portalegre (RN), 50.51; and São Bernardo (MA), 50.87.
Despite this concentration around the mean, it should be noted that the total range coefficient was 21.49, sharply distinguishing demographic dynamics within the SemSet. While the TDR in Tibau (RN) and São José do Divino (PI) was 39.18 and 39.63, respectively, in Francisco Ayres (PI) and Cacimbas (PB) it reached 60.67 and 60.48.
These results may be interpreted in terms of two demographic components: (i) fertility and (ii) migration. In terms of magnitude, São José do Divino and Cacimbas are primarily shaped by the Total Fertility Rate (TFR)6, whereas Tibau and Francisco Ayres are more likely influenced by the Net Migration Rate (NMR)7.
In the context of the lowest TDRs, São José do Divino had a TFR of 1.1 children per woman in 2010-the eighth lowest in the SemSet-which directly affected its TDR. In Tibau, despite TFRs of 1.9 (2010) and 1.7 (2022)-ranking 366th and 431st, respectively-the NMR between 2010 and 2022 was 2.2 (a net migration of 1,196 people), which negatively impacted the TDR.
As an example among the highest TDRs, Cacimbas consistently ranked among the municipalities with the highest TFRs: 3.3 (2010) and 2.3 (2022) children per woman. In 2010, it was the fourth highest in the SemSet, which may explain its elevated dependency, even amid population loss, since the NMR between 2010 and 2022 was -0.98.
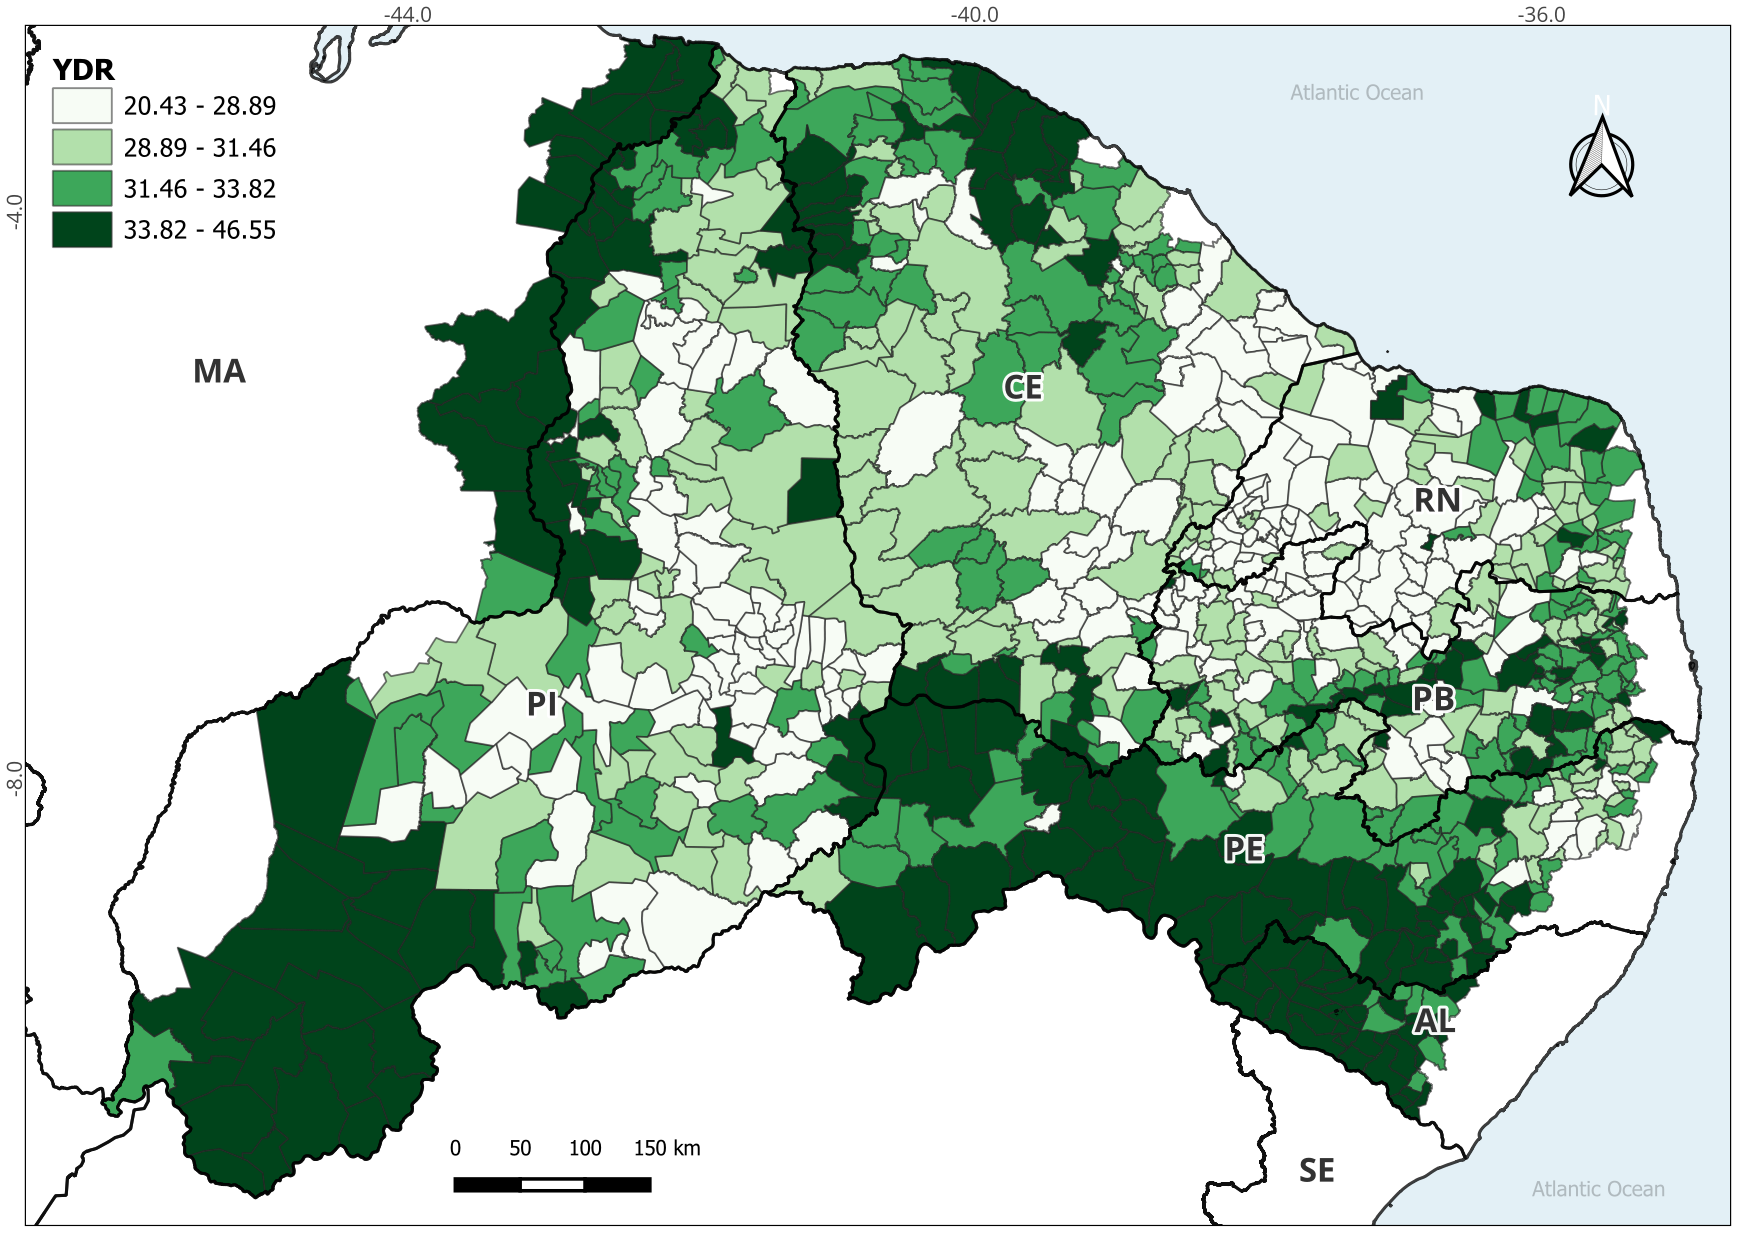
To illustrate the composition of dependency captured by the TDR, the next two figures present the 2022 results for the youth dependency ratio (YDR) and old-age dependency ratio (ODR). Figure 3 categorizes municipalities by YDR quartile. As with the overall TDR, values were concentrated around the mean (31.54), which closely matched the median (31.46), indicating a symmetric distribution.
Thus, in 2022 there were, on average, 31 individuals aged 0-14 for every 100 working-age residents. According to Figueiredo (2025), this indicates that the demographic transition in the region lags behind the national average, suggesting that targeted policies addressing this profile-such as investments in education-are likely to be more effective in preparing to leverage the demographic window of opportunity.
The third quartile indicates that in 234 municipalities, the YDR was at least 33.82 young people per 100 working-age individuals. Of these, 55 were in the state of Pernambuco and 55 in Piauí. In Piauí, the highest YDR was recorded in Porto (43.35), while in Pernambuco, Carnaubeira da Penha stood out with a YDR of 42.01. This high value reflects a combination of a high TFR (2.57)-the third highest in the SemSet-and a negative net migration of -2,291 individuals.

By contrast, the first quartile indicates that in 25% of municipalities, the YDR was below 28.99 young people per 100 working-age individuals, including 69 municipalities in Rio Grande do Norte, 67 in Piauí, and 51 in Paraíba. In the first state, Jardim do Seridó (20.43) presented the lowest value. In Piauí and Paraíba, the lowest YDRs were observed in Aroeiras do Itaim (22.74) and Coxixola (22.92), respectively.
In the case of Jardim do Seridó (population 11,655), fertility was the main determinant, with a TFR of 1.12 children per woman, which was the lowest in the region. A similar pattern is observed in Aroeiras do Itaim, where a downward trend has continued, with a TFR of 1.04 children per woman. By contrast, Coxixola exhibited a reversal: its TFR increased from 1.47 in 2000 (823rd highest in the SemSet) to 1.88 in 2022 (182nd).
A decline in TFRs is a primary driver of demographic transition, and as discussed in the literature, is associated with social, economic, and cultural changes. Factors such as urbanization, higher levels of education, post-materialist needs like self-realization, increased female autonomy, and new family arrangements help to explain the trend toward fertility below replacement levels (Coale, 1989; Lesthaeghe, 2014; Van de Kaa, 1987).
Figure 4 demonstrates that, among the 42 municipalities analyzed in the state of Alagoas, 39 (92.86%) fall within the first and second strata, with an ODR below 17.21. In Pernambuco, 65.49% of municipalities (93 of 142 municipalities) fall within these strata. The two lowest values were recorded in Toritama (7.55) and Santa Cruz do Capibaribe (8.44).

These two municipalities are part of what is known as the Agreste garment hub, one of Brazil’s main clothing production regions. Both are notable for their large-scale production of apparel, particularly jeans. This economic dynamism has contributed to the rejuvenation of the population through immigration, especially during the 2000s.
By analogy, this situation resembles the scenario described by Coleman (2006), in which population transformation is driven by below-replacement fertility combined with high immigration rates. These dynamics have significant implications for the social, cultural, and economic structure.
Between 2000 and 2009, the average annual net migration rate was 2.60 and 3.28 per 100 inhabitants in Santa Cruz do Capibaribe and Toritama, respectively. This corresponds to a net migration of 19,063 in the former and 9,409 in the latter. As a result, the population growth rate from 2000 to 2010 was 4.02% per year in Santa Cruz and 5.01% per year in Toritama, compared with 1% per year for the SemSet overall.
Although continuous areas of relatively low ODR predominate in the states of Alagoas and Pernambuco, similar patterns are also observed in other states. Of the 468 municipalities in strata 1 and 2, 106 (22.65%) were located in Piauí and 84 (17.95%) in Ceará, particularly in its southern region. In Rio Grande do Norte, nearly half of the municipalities analyzed (71 of 148) fell into these strata, with coastal areas being especially prominent.
Figure 4 further shows that the first quartile comprises 25% of polygons with an older dependency ratio (ODR) ranging from 7.55 to 15.22 older individuals per 100 working-age individuals. In this context, the predominance of this lowest class is particularly evident in Alagoas and Pernambuco, where it accounts for 59.52% and 34.51% of municipalities, respectively. In absolute terms, Ceará stands out for the number of municipalities in this quartile.
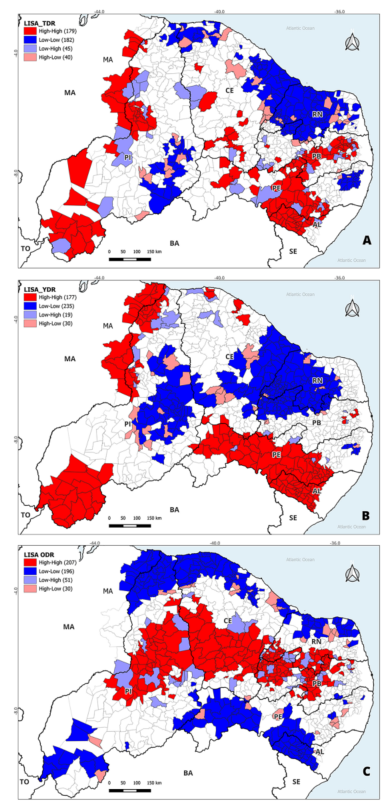
Figure 5 presents maps that formally confirm the spatial dependence intuitively suggested by the previous figures. The analysis focuses on positive spatial autocorrelation, i.e., on municipalities whose values are similar to the average of their surrounding areas, expressed either in a High-High pattern (shown in red) or in a Low-Low pattern (blue polygons).
Analysis of the total dependency ratio (TDR) reveals that 179 municipalities exhibited high TDR values relative to the SemSet context and were surrounded by neighboring municipalities with similarly high values, thus forming a High-High pattern. Conversely, 182 municipalities with low TDR values were embedded in neighborhoods with similarly low averages, characterizing Low-Low clusters.
Within the High-High pattern, the largest contiguous cluster extended from the northeastern municipalities of Paraíba, crossed the state diagonally, and continued through central Pernambuco to the border with Alagoas, where it encompassed nearly 70% of that state’s municipalities. In addition, notable clusters included one spanning southern Piauí and another comprising approximately half of the analyzed polygons in Maranhão, together with municipalities in northwestern Piauí.

The analysis of the YDR and the ODR reveals differences in stages of the demographic transition and, consequently, its spatial heterogeneity, corroborating the findings of Schröder and Alves (2023) for the health macroregions of Northeastern Brazil. Accordingly, without disregarding regional identity, this evidence underscores the need to account for local specificities, as advocated by Birdsall (1988).
The spatial correlation observed for the YDR (Figure 5) closely mirrors that identified for the TDR, indicating the greater contribution of younger cohorts, relative to older ones, to the composition of dependency, and suggesting that, despite the aging process, the population remains predominantly adult.
Were it not for the discontinuity in only four municipalities in Ceará (Saboeiro, Catarina, Arneiroz, and Jucás), the Low-Low pattern in the YDR would be spatially contiguous from Rio Grande do Norte to Piauí. This cluster originates in the central region of Rio Grande do Norte, incorporates municipalities in eastern Ceará and southwestern Paraíba, and extends to central Piauí, thereby grouping 219 polygons.
Finally, an analysis of the ODR results (Figure 5) indicates that, under the High-High pattern, a “belt” spans the Northern Semi-arid region, originating in the states of Paraíba and Rio Grande do Norte, crossing Ceará, and extending into Piauí. This cluster comprises 207 municipalities reporting high ODR values, consistent with those observed in neighboring areas, which also exhibit high values.
Considering the four-stage model, this configuration is indicative of a relatively more advanced stage of the demographic transition (Coale, 1989; Lee, 2003) within this “belt”. This context demands more immediate employment policies, which increasingly compete on the policy agenda with care and health policies targeted at the older population.
In this light, it is likely that the spatial distribution of the YDR is directly associated with past dynamics of total fertility rates (TFRs), as reflected in the ODR, although these rates are not particularly low in the highlighted municipalities, suggesting that the results may instead be driven by the out-migration of younger populations.
In summary, the age structure in the SemSet mirrors the broader Brazilian trend, characterized by a predominantly adult population undergoing an aging process. This situation defines the demographic window of opportunity experienced in these areas, given the relative increase in the working-age population, a condition that is conducive to higher levels of production and income.
At the same time, the intraregional analysis revealed both the heterogeneity and the spatial dependence of this process. From the perspective of the demographic transition, at least two distinct “Northern Semi-arid regions” may be identified: one relatively younger (characterized by a High-High pattern in the YDR) and another comparatively older (characterized by a High-High pattern in the ODR). In light of these findings, the following section examines the working-age population and the Formal Employment Index (FEI) within these two strata.
2.2 Window of Opportunity in the Northern Semi-Arid Regions
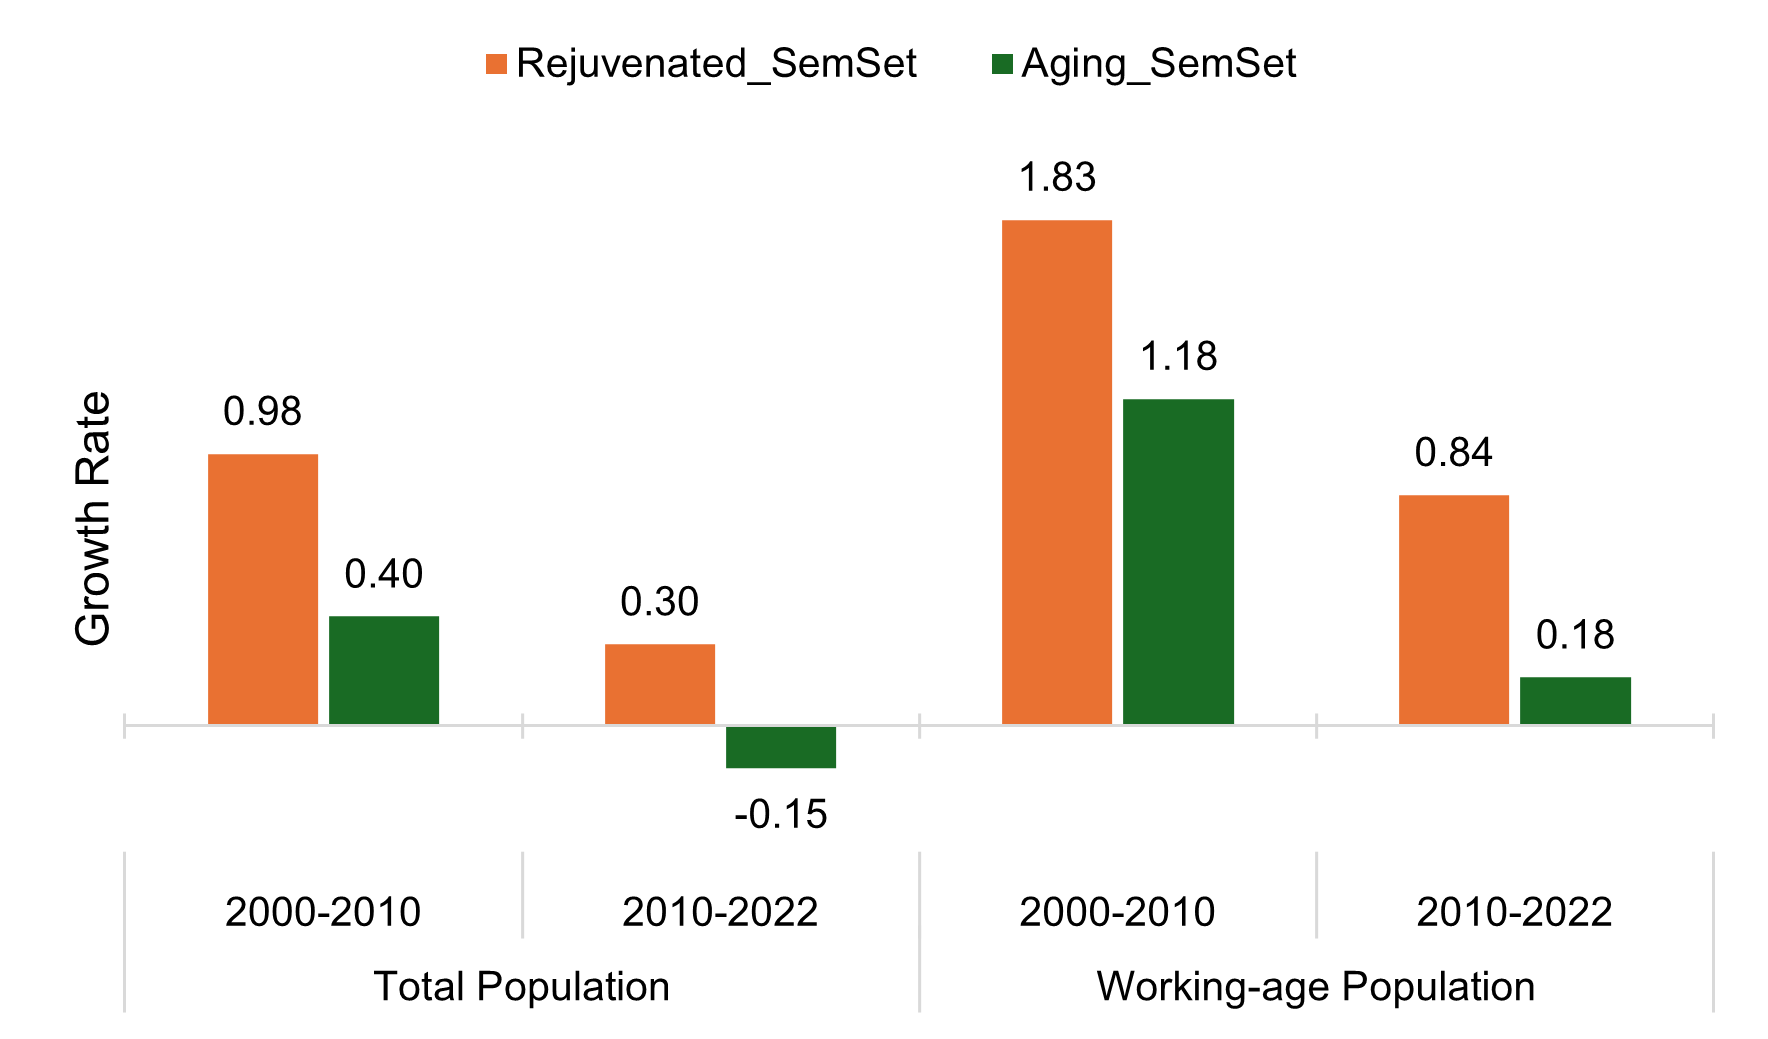
Two strata, two distinct demographic dynamics. Whether from the perspective of the total population or the working-age population (WAP), the average annual growth rates in the rejuvenated SemSet differ from those observed in the aging SemSet. When analyzing the total population, the latter recorded a growth of 0.40% per year between 2000 and 2010 and, in the subsequent period, entered a phase of decline (-0.15% per year). In the rejuvenated SemSet, growth rates were 0.98% and 0.30%, respectively. (Figure 6)

Average annual growth rates of the total population and the working-age population (WAP), per SemSet regional stratum (2000-2022)
In the case of the WAP, a key finding was the persist growth rates higher than those observed for the total population, thereby sustaining the opening of the window of opportunity. Another notable result is the persistence of differences in growth dynamics between the two strata. While in the rejuvenated SemSet the WAP grew at 1.83% per year (2000-2010) and 0.84% per year (2010-2022), in the aging SemSet this growth rate fell from 1.18% to 0.18% per year.
Consequently, the relative share of the WAP within the total population increases year after year (Figure 7). In the rejuvenated SemSet, this share was 57.44% in 2000, rose to 62.45% in 2010, and more recently reached 66.61% in 2022. Although slightly higher, these values converged with those observed for the aging SemSet, where the WAP accounted for 59.46%, 64.30%, and 66.88%, respectively.
Malmberg, Malmberg, and Maskell (2023) have emphasized the proportion of the WAP as a driver of urban, regional, and national development. However, thy also stress the importance of institutional, technological, and cultural factors evolving in a complementary manner. Analyzing regions in Europe and the United States, they estimated, using ordinary least squares and a five-year panel, that a one-percentage-point increase in the share of the WAP corresponds to a 12.58% increase in GDP per capita.
Kotschy and Bloom (2023) have examined the effects of changes in the proportion of the WAP affect global economic growth. Using a panel of 145 countries over the period from 1950 to 2015, they estimated that a 1% increase in the share of the WAP is associated with an increase of approximately 1% in GDP per capita. Growth scenarios were projected for the period from 2020 to 2050, ranging from 0.1 to 0.4 percentage points, reflecting the transition from the “bonus” to the “demographic drag”, i.e., the closing of the window of opportunity.
Thus, a comparison of the proportion of the WAP relative to the total population with the TDR indicates the extent of the window of opportunity. Based on this indicator, the difference between the rejuvenated and the aging SemSets is estimated to be approximately four years. In the latter, the window opened in 2005, whereas in the former it opened around 2009 (Figure 7).
As shown above, the demographic context in 2000 was not yet favorable. In the aging SemSet, the window of opportunity-proxied by the difference between the TDR and the share of the WAP-amounted to 8.77% in 2010 and 17.37% in 2022, whereas in the rejuvenated SemSet it reached 4.18% and 16.77%, respectively.
Thus, just as the Northern Semi-arid region as a whole exhibits a window of opportunity with a relatively longer temporal extension compared to areas outside the Semi-arid region (Figueiredo, 2025), within the subregion the rejuvenated SemSet displays a similar configuration. Consequently, in the aging SemSet more immediate policy responses are required, focused on increasing production and, therefore, on harnessing the “bonus” generated by the window of opportunity.

Miranda, Mendes, and Silva (2016) draw attention to the fact that taking advantage of this window depends on the capacity to deliver rapid, integrated responses to emerging demands, with an emphasis on sustainable development and the reduction of historical inequalities. They identify opportunities for strategic investments, such as expanding health and education coverage, professional training, and the reorganization of social security systems.
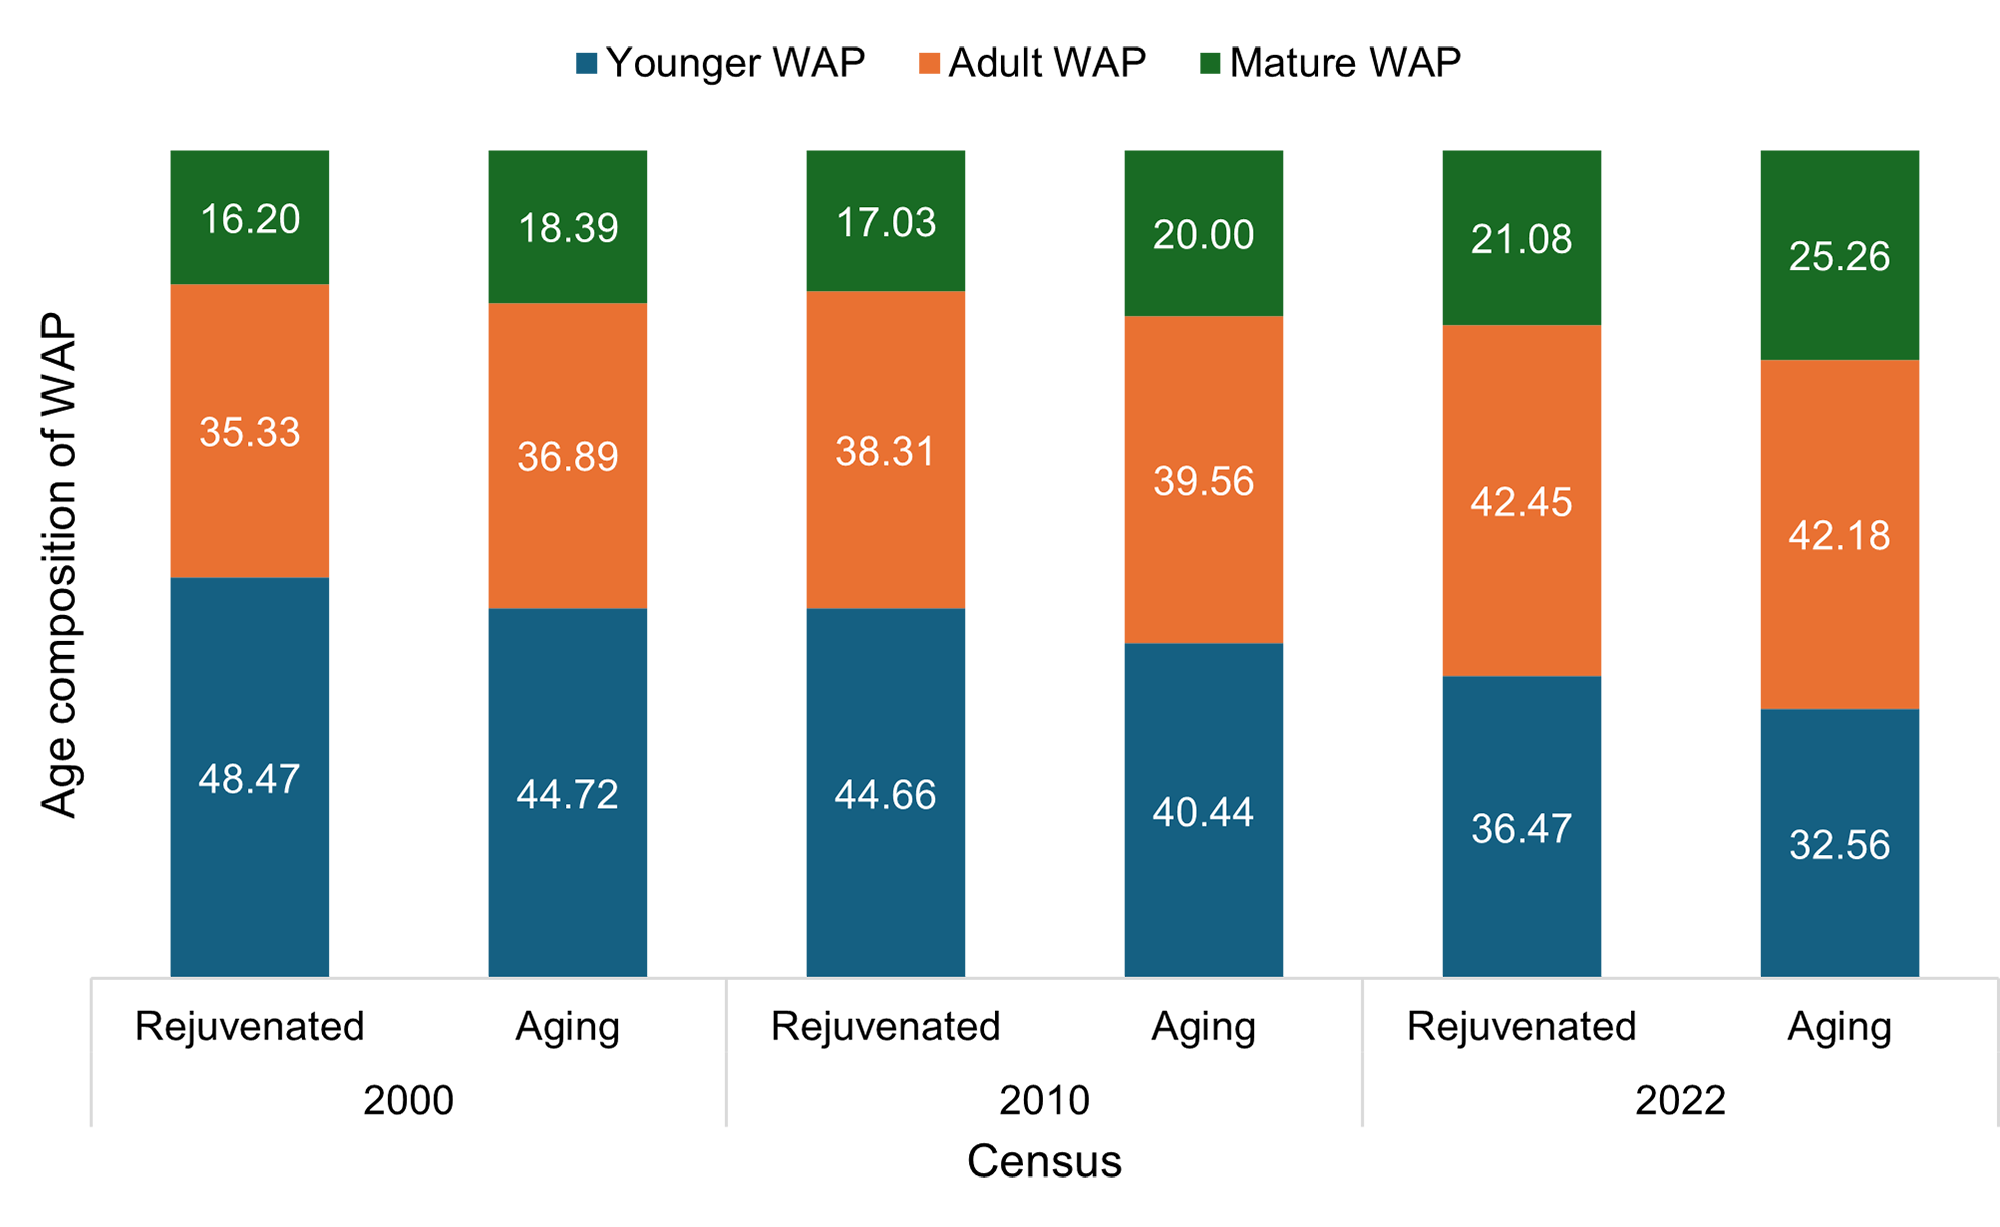
The effective use of this window requires an examination of the profile of the “demographic bonus.” In this regard, Figure 8 depicts changes in the age structure of the WAP. In addition to the aging trend, it reveals the predominance of the adult segment of the WAP, which in 2022 accounted for 42.45% in the rejuvenated SemSet and 42.15% in the aging SemSet, underpinning the urgent need for employment policies capable of absorbing this labor potential.

Additionally, the continued significant presence of the young WAP, particularly in the rejuvenated SemSet, represents an opportunity for investment in inclusion, skills development, and youth empowerment. In the absence of effective youth policies, the benefits of this window may not be fully realized. Beyond addressing current demands, such investments also contribute to future development (Melo; Rios-Neto, 2020; Miranda; Mendes; Silva, 2016).
Bloom, Canning, and Sevilla (2003) argued that longevity and educational attainment shape the temporal extent of the demographic window, so much so that appropriate education and labor market policies can extend its duration. From a methodological perspective, they emphasize the need to articulate demographic indicators (such as WAP, dependency ratios) with measures of productive insertion in the labor market and human capital.
From this analytical perspective, Figure 9 presents the evolution of the FEI as a measure of the utilization of the window of opportunity, considering the same regional strata. Two results stand out: (i) the upward trajectory of the indicator over the period, and (ii) the similarity in the behavior of the rejuvenated and the aging SemSets.
In the rejuvenated SemSet, for example, the FEI in 2000 stood at 7.05%, indicating that only seven out of every 100 individuals in the WAP were formally employed. Over the subsequent years, the indicator followed an upward trend, and by 2021 the FEI had reached 12.39%. Nevertheless, these results point to an economic fragility that is even more pronounced than that observed at the broader regional scale.

Thus, taking the FEI as a proxy for the utilization of the “demographic bonus”, it is evident that, despite the low absolute levels, the WAP was more effectively utilized during the window of opportunity. Over the period analyzed (2000-2021), the variation in the FEI amounted to 75.74% in the rejuvenated SemSet and 107.38% in the aging SemSet, compared to 92.24% at the aggregate level.
Figure 9 also indicates that the “bonus” materialized more clearly between 2000 and 2014, as reflected in the positive trend of the FEI, but showed signs of stagnation. This pattern may be associated with the constraints imposed by periods of political and economic instability experienced in Brazil after 2014, which were subsequently intensified by the COVID-19 crisis in 2020.
Final remarks
The mapping of the age structure of municipalities in the Northern Semi-arid region identified patterns of spatial autocorrelation and heterogeneity, which, although not generalizable-given that demographic dynamics vary according to place-warrant analysis across different scales. Thus, considering the patterns analyzed herein (dependency ratios, size, and composition of the WAP) when formulating public policies will help tailor policies to specific local needs, rather than relying on solely on a purely macroregional perspective.
The results for dependency ratios highlighted at least two “Northern Semi-arid regions”: (i) a younger one characterized by a High-High pattern in the YDR, predominantly composed of municipalities in Alagoas and Pernambuco (central and northwestern areas), southern Piauí, and the cluster formed by municipalities along the Piauí-Maranhão border; and (ii) an older one characterized by a High-High pattern in the ODR, spatially forming a belt stretching from east to west, mostly comprising municipalities in Paraíba, Ceará, and central-northern and southeastern Piauí.
This spatial correlation and heterogeneity in the demographic transition process directly affect the design, implementation, and effectiveness of public policies, with consequent impacts on the social and economic dynamics of the Semi-arid region. Population profiles inform more localized government interventions, necessitating the adaptation of strategies across sectors such as health, education, employment, and social security.
For the relatively younger Semi-arid region, a policy agenda focused on improving access to quality education and enhancing labor market integration may be more effective. In this context, the composition of students by educational level is expected to shift further, with demand for basic education declining and demand for higher education rising, necessitating significant investment.
In this regard, the effects on demand for early childhood education remain ambiguous. On the one hand, declining fertility reduces the number of children requiring enrollment at school; on the other, the growing participation of women in the labor market heightens the need for support networks, rendering the provision of nurseries and preschools crucial both for gender equity and for balancing family and professional responsibilities.
In the older Semi-arid region, the demographic transition is already affecting the profile of public policy demand in areas such as health, social security, and consumption patterns. Consequently, the agenda includes sustainable social protection policies and health systems equipped to manage a higher incidence of chronic and degenerative diseases. Moreover, with a growing number of functional limitations among older adults, there will be a significant increase in demand for long-term care, both in home-based and institutional settings.
By comparing the TDR with the share of the WAP relative to the total population, it was estimated that the window of opportunity in the aging SemSet opened in 2005, whereas in the rejuvenated region it occurred around 2009. However, when analyzing the utilization of this window, the FEI exhibited an upward trend, and the behavior of the rejuvenated and aging SemSets were particularly similar.
As the systematic reduction of the TDR occurs simultaneously with an increase in the WAP, driven both by the demographic transition and by population retention since the 2000s, the need for employment and technical training policies intensifies. In the absence of effective interventions, the expansion of the WAP could contribute to higher unemployment rates, which may, in turn, exacerbate socioeconomic indicators.
In the present study, the FEI was used as a measure of the utilization of this demographic opportunity. In the rejuvenated SemSet, the FEI in 2000 was 7.05%, indicating that only seven out of every 100 individuals in the WAP were formally employed; by 2021, this figure had risen to 12.39%. Despite this improvement, the persistently low absorption of the WAP into formal employment highlights ongoing economic fragility.
More effective employment policies are therefore necessary. For the growth of the WAP to generate a “bonus” in production, it is essential that it be accompanied by policies that both stimulate labor demand and strengthen labor supply by improving skills and qualifications. This aspect is directly related to productivity. In this context, investments in human capital (health and education) are crucial to ensure that the expansion of the WAP translates into gains derived from the population’s profile.
In this regard, the analysis of the WAP age profile, in addition to highlighting the aging trend, revealed the predominance of the adult WAP. In 2022, adults accounted for 42.45% of the WAP in the rejuvenated SemSet and 42.15% in the aging SemSet. Consequently, alongside the increased pressure for immediate job creation, investments in education face a shorter time horizon for yielding returns. Therefore, more incisive employment policies must be linked to investments in technical and vocational education, as these provide more immediate returns.
Finally, as a key finding, the analysis shows that although the window of opportunity is conditioned by the age structure, its utilization did not differ between the aging and the rejuvenated SemSets at an intraregional level. This suggests that other factors-likely related to shortcomings in economic and social policies-play a more decisive role, as noted by Birdsall (1988).
Therefore, despite the existence of limitations, this study highlights the importance of public policy planning that considers sociodemographic specificities for enhancing the effectiveness of development policies and for mitigating inter- and intraregional inequalities that have historically persisted within and between Brazilian regions. Furthermore, it suggests directions for future research in the Semi-arid region, including, among other elements, the effects of the growing WAP, the role of public policies, and the constraints imposed by political and economic instability experienced in Brazil after 2014 and during the COVID-19 pandemic.
Open Data
The data supporting the results of this study are available on the SciELO Data platform at: https://doi.org/10.48331/SCIELODATA.XVTZLW.
References
- ALMEIDA, E. S. Econometria Espacial Aplicada Campinas: Alínea, 2012.
-
ALVES, J. E. D. A transição demográfica e a janela de oportunidade São Paulo: Instituto Fernand Braudel de Economia Mundial, 2008. Disponível em: Disponível em: https://fernandonogueiracosta.wordpress.com/wp-content/uploads/2010/08/transicao_demografica.pdf Acesso em: 12 mar. 2022.
» https://fernandonogueiracosta.wordpress.com/wp-content/uploads/2010/08/transicao_demografica.pdf -
ALVES, J. E. D. Bônus demográfico no Brasil: do nascimento tardio à morte precoce pela Covid-19. Rebep, v. 37, p. 1-18, 2020. Disponível em: https://doi.org/10.20947/S0102-3098a0120. Acesso em: 30 mar. 2022.
» https://doi.org/10.20947/S0102-3098a0120 -
BIRDSALL, N. Economic approaches to population growth. In: CHENERY, H.; SRINIVASAN, T. N. Handbook of Development Economics Amsterdam: Elsevier, 1988. v. 1, p. 477-542. Disponível em: https://doi.org/10.1016/S1573-4471(88)01015-0. Acesso em: 17 abr. 2022.
» https://doi.org/10.1016/S1573-4471(88)01015-0 -
BLOOM, D. E.; CANNING, D.; SEVILLA, J. The demographic dividend Santa Monica, Calif.: Rand, 2003. Disponível em: Disponível em: https://www.jstor.org/stable/10.7249/mr1274wfhf-dlpf-rf-unpf Acesso em: 23 mar. 2022.
» https://www.jstor.org/stable/10.7249/mr1274wfhf-dlpf-rf-unpf -
BOING, A. C. et al Spatial clusters and social inequities in Covid-19 vaccine coverage among children in Brazil. Ciência & Saúde Coletiva, v. 29, n. 8, 2024. Disponível em: https://doi.org/10.1590/1413-81232024298.03952023. Acesso em: 27 fev. 2025.
» https://doi.org/10.1590/1413-81232024298.03952023 -
BRITO, F. Transição demográfica e desigualdades sociais no Brasil. Rebep , v. 25, p. 5-26, 2008. Disponível em: https://doi.org/10.1590/S0102-30982008000100002. Acesso em: 13 jul. 2022.
» https://doi.org/10.1590/S0102-30982008000100002 -
CALDWELL, J. C. Toward a Restatement of Demographic Transition Theory. Population and Development Review, v. 2, n. 3-4, p. 321, 1976. Disponível em: https://doi.org/10.2307/1971615. Accesso em: 18 jul. 2023.
» https://doi.org/10.2307/1971615 -
COALE, A. J. Demographic Transition. In: EATWELL, J.; MILGATE, M.; NEWMAN, P. (org.). Social Economics London: Palgrave Macmillan, 1989. p. 16-23. Disponível em: https://doi.org/10.1007/978-1-349-19806-1_4. Acesso em: 22 jun. 2022.
» https://doi.org/10.1007/978-1-349-19806-1_4 -
COLEMAN, D. Immigration and Ethnic Change in Low‐Fertility Countries: A Third Demographic Transition. Population and Development Review , v. 32, n. 3, p. 401-446, 2006. Disponível em: https://doi.org/10.1111/j.1728-4457.2006.00131.x. Acesso em: 12 mar. 2022.
» https://doi.org/10.1111/j.1728-4457.2006.00131.x -
DAVIS, K. The Theory of Change and Response in Modern Demographic History. Population Index, v. 29, n. 4, p. 345-366, 1963. Disponível em: https://doi.org/10.2307/2732014. Acesso em: 8 abr. 2023.
» https://doi.org/10.2307/2732014 - FIGUEIREDO, J. Ensaios sobre demografia econômica: estrutura etária, janela de oportunidade e desempenho econômico no Semiárido Setentrional. 2025. Tese (Doutorado) - Universidade Federal do Rio Grande do Norte, Natal, 2025.
-
FOTHERINGHAM, A. S. et al Exploring Spatial Context: A Comprehensive Bibliography of GWR and MGWR. [S. l.]: arXiv, 2024. Disponível em: Disponível em: https://arxiv.org/abs/2404.16209 Acesso em: 12 jan. 2025.
» https://arxiv.org/abs/2404.16209 -
GEODA Center for Geoespacial Analysis. GeoDa Versão 1.22.0.2. GeoDa Center for Geospatial Analysis, 2024. Disponível em: Disponível em: https://geodacenter.github.io /. Acesso em: 18 jan. 2024.
» https://geodacenter.github.io -
IBGE. Instituto Brasileiro de Geografia e Estatística. Malha municipal digital do Brasil: 2022. Formato shapefile. Rio de Janeiro: IBGE, 2022. Disponível em: Disponível em: https://www.ibge.gov.br/geociencias/cartas-e-mapas/malhas-digitais.html Acesso em: 15 mar. 2024.
» https://www.ibge.gov.br/geociencias/cartas-e-mapas/malhas-digitais.html -
IBGE. Instituto Brasileiro de Geografia e Estatística. Censo Demográfico 2000: características da população e dos domicílios. Rio de Janeiro: IBGE , 2003. Disponível em: Disponível em: https://www.ibge.gov.br/estatisticas/downloads-estatisticas.html Acesso em: 8 abr. 2023.
» https://www.ibge.gov.br/estatisticas/downloads-estatisticas.html -
IBGE. Instituto Brasileiro de Geografia e Estatística. Censo Demográfico 2010: características da população e dos domicílios. Rio de Janeiro: IBGE , 2011. Disponível em: Disponível em: https://www.ibge.gov.br/estatisticas/downloads-estatisticas.html Acesso em: 8 abr. 2023.
» https://www.ibge.gov.br/estatisticas/downloads-estatisticas.html -
IBGE. Instituto Brasileiro de Geografia e Estatística. Censo Demográfico 2022: resultados definitivos. Rio de Janeiro: IBGE , 2023. Disponível em: Disponível em: https://www.ibge.gov.br/estatisticas/downloads-estatisticas.html Acesso em: 17 jan. 2024.
» https://www.ibge.gov.br/estatisticas/downloads-estatisticas.html -
KOTSCHY, R.; BLOOM, D. E. Population Aging and Economic Growth: From Demographic Dividend to Demographic Drag? Bonn: Institute of Labor Economics, 2023. Disponível em: Disponível em: https://www.jstor.org/stable/resrep57337 Acesso em: 12 jan. 2025.
» https://www.jstor.org/stable/resrep57337 -
LEE, R. The Demographic Transition: Three Centuries of Fundamental Change. Journal of Economic Perspectives, v. 17, n. 4, p. 167-190, 2003. Disponível em: https://doi.org/10.1257/089533003772034943. Acesso em: 30 out. 2022.
» https://doi.org/10.1257/089533003772034943 -
LESTHAEGHE, R. The second demographic transition: A concise overview of its development. Proceedings of the National Academy of Sciences, v. 111, n. 51, p. 18112-18115, 2014. Disponível em: https://doi.org/10.1073/pnas.1420441111. Accesso em: 13 mar. 2022.
» https://doi.org/10.1073/pnas.1420441111 -
MALMBERG, A.; MALMBERG, B.; MASKELL, P. Population age structure - An underlying driver of national, regional and urban economic development. ZFW - Advances in Economic Geography, v. 67, n. 4, p. 217-233, 2023. Disponível me: https://doi.org/10.1515/zfw-2023-0040. accesso em: 14 jan. 2025.
» https://doi.org/10.1515/zfw-2023-0040 -
MELO, B. G. de; RIOS-NETO, E. The effect of education on the demographic dividend: an analysis of the Brazilian case. Revista Brasileira de Estudos de População, v. 37, p. e0119-e0119, 2020. Disponível em: https://doi.org/10.20947/S0102-3098a0119. Acesso em: 19 mar. 2022.
» https://doi.org/10.20947/S0102-3098a0119 -
MTE. Ministério do Trabalho e Emprego. Relação Anual de Informações Sociais - RAIS: 2000-2021. Brasília, DF: MTE, [s.d.]. Disponível em: Disponível em: https://bi.mte.gov.br/bgcaged/caged_rais_vinculo_id/caged_rais_vinculo_basico_tab.php Acesso em: 12 fev. 2024.
» https://bi.mte.gov.br/bgcaged/caged_rais_vinculo_id/caged_rais_vinculo_basico_tab.php -
MIRANDA, G. M. D.; MENDES, A. da C. G.; SILVA, A. L. A. da. Desafios das políticas públicas no cenário de transição demográfica e mudanças sociais no Brasil. Interface, v. 21, n. 61, p. 309-320, 2016. Disponível em: https://doi.org/10.1590/1807-57622016.0136. Acesso em: 21 mar. 2022.
» https://doi.org/10.1590/1807-57622016.0136 -
OLIVEIRA, A. S. Transição demográfica, transição epidemiológica e envelhecimento populacional no Brasil. Hygeia, v. 15, n. 32, p. 69-79, 2019. Disponível em: https://doi.org/10.14393/Hygeia153248614. Acesso em: 15 mar. 2022.
» https://doi.org/10.14393/Hygeia153248614 - REIFF, L. O. A.; SANTOS, G. A. G.; ROCHA, L. H. R. Emprego formal, qualidade de vida e o papel do BNDES. Revista do BNDES, Rio de Janeiro, v. 14, n. 27, p. 5-26, 2007.
-
QGIS Development Team. QGIS Geographic Information System Versão 3.34.1. Open Source Geospatial Foundation Project, 2024. Disponível em: Disponível em: http://qgis.osgeo.org Acesso em: 18 jan. 2024.
» http://qgis.osgeo.org -
SANTANA, K. V. de S. de et al Space-Time Analysis of the Covid-19 Pandemic and Its Relationship with Socioeconomic and Demographic Variables in the Metropolitan Region of São Paulo, Brazil. ISPRS - International Journal of Geo-Information, v. 13, n. 11, p. 397, 2024. Disponível em: https://doi.org/10.3390/ijgi13110397. Acesso em: 10 jan. 2025.
» https://doi.org/10.3390/ijgi13110397 -
SCHRÖDER, C. A.; ALVES, L. As particularidades da transição demográfica no Nordeste brasileiro. Revista Latinoamericana de Población, v. 17, p. e202317, 2023. Disponível em: http://doi.org/10.31406/relap2023.v17.e202317. Acesso em: 10 jan. 2025.
» https://doi.org/10.31406/relap2023.v17.e202317 -
STAMPE, M. Z.; MENEZES, G.; POZZOBON, F.; SIRTOLI, E. Brazilian demographic dividend: A spatial analysis of the role of savings. Papers in Regional Science, v. 104, n. 3, p. 100097, 2025. Disponível em: https://doi.org/10.1016/j.pirs.2025.100097. Acesso em: 12 jun. 2025.
» https://doi.org/10.1016/j.pirs.2025.100097 -
STAMPE, M. Z.; POZZOBON, F.; NIQUITO, T. W. Impactos da estrutura etária sobre o desempenho econômico das regiões do Brasil entre 1991 e 2010. Revista Brasileira de Estudos de População , v. 37, p. 1-25, 2020. Disponível em: https://doi.org/10.20947/S0102-3098a0116. Acesso em: 30 mar. 2024.
» https://doi.org/10.20947/S0102-3098a0116 -
TYSZLER, M. Econometria espacial: discutindo medidas para a matriz de ponderação espacial. 2006. Dissertação (Mestrado em Administração Pública e Governo) - Fundação Getúlio Vargas, São Paulo, 2006. Disponível em: Disponível em: https://hdl.handle.net/10438/2451 Acesso em: 27 mar. 2024.
» https://hdl.handle.net/10438/2451 -
VAN DE KAA, D. J. Europas Second Demographic Transition. Popul Bull, v. 42, n. 1, p. 1-59, 1987. Disponível em: Disponível em: https://estvitalesydemografia.wordpress.com/wp-content/uploads/2013/04/europec2b4s-second-demographic-transition.pdf Acesso em: 12 jul. 2023.
» https://estvitalesydemografia.wordpress.com/wp-content/uploads/2013/04/europec2b4s-second-demographic-transition.pdf -
VASCONCELOS, A. M. N.; GOMES, M. M. F. Transição demográfica: a experiência brasileira. Epidemiologia e Serviços de Saúde, v. 21, n. 4, p. 539-548, 2012. Disponível em: https://doi.org/10.5123/S1679-49742012000400003. Acesso em: 17 fev. 2022.
» https://doi.org/10.5123/S1679-49742012000400003
-
This study was supported by the Coordination for the Improvement of Higher Education Personnel - Brazil (CAPES), Funding Code 001, and by the Research Support Foundation of the State of Rio Grande do Norte (FAPERN), through Call for Proposals No. 13/2021. The authors also gratefully acknowledge Professors Cassiano Trovão, Francisco de Lima Júnior, Kleber Oliveira, and Silvana Queiroz for their valuable contributions, insightful suggestions, and critical comments, which significantly enhanced this work.
-
1
These aspects are encompassed by the National Care Policy, established by Law No. 15,069/2024. Brazil. Official Gazette of the Union: Brasília, DF, 24 December 2024.
-
2
Strictly speaking, this discussion derives from the collaboration between Ronald Lesthaeghe and Dirk J. Van de Kaa in the work Twee Demografische Transities? In: LESTHAEGHE, R.; VAN DE KAA, D. J. (eds.). Twee Demogralische Transities? Bevolking: groei en krimp, mens en maatschappij. Deventer: Van Loghum Slaterus, 1986, pp. 9-24.
-
3
This choice is due to a significant break in the RAIS time series in 2022, which led the Ministry of Labor and Employment not to recommend direct comparison of these results with previous years, making their inclusion in the analysis proposed here unfeasible (MTE, 2024). BRASIL. Ministério do Trabalho e Emprego. Nota técnica: Relação Anual de Informações Sociais, ano-base 2022. Brasília, DF: MTE, Secretaria Executiva, Subsecretaria de Estatísticas e Estudos do Trabalho, mar. 2024 [Ministry of Labor and Employment. Technical Note: Annual Social Information Report, base year 2022. Brasília, DF: MTE, Executive Secretariat, Subsecretariat of Labor Statistics and Studies, Mar. 2024]. Available at: https://www.gov.br/trabalho-e-emprego/pt-br/assuntos/estatisticas-trabalho/rais/rais-2022/nota-tecnica-rais-2022.pdf. Accessed: June 22, 2024.
-
4
Person-years are a measure of exposure that combines the number of individuals in a population with the length of time during which an individual is exposed to the event of interest. In this case, it is given by: , where denotes the population at time t; is the initial population; r is the growth rate per unit of time; and t is the time interval elapsed between the initial period and time t (Foz, 2021). GRUPO DE FOZ. Métodos demográficos: uma visão desde os países de língua portuguesa. [Demographic methods: a perspective from Portuguese-speaking countries]. São Paulo: Blucher Open Access, 2021. Available at: https://openaccess.blucher.com.br/article-list/9786555500837-504/list. Accessed on: March 13, 2023.
-
5
SemSet resembles the southern portion both in terms of pattern and level. However, relative to the population outside the Semi-arid region, its level is lower, particularly in the early stages of the process. In 1970, the TDR outside this region was 78.14, declining to 60.77 in 1991 and to 44.50 and 43.76 in 2010 and 2022, respectively. This indicates that, despite the convergence of the age structure, the demographic transition in the Semi-arid region lags temporally behind that of the rest of the country (Figueiredo, 2025).
-
6
The Total Fertility Rates (TFRs) used in the analysis were obtained from live birth records by maternal age and female population by reproductive age, considering five-year age groups from 15 to 49 years, as provided by DATASUS. These data enabled the age-specific fertility rates to be estimated for each five-year group and, consequently, the TFRs for each municipality (BRASIL, Ministério da Saúde, Departamento de Informática do Sistema Único de Saúde - DATASUS. TABNET: Health Information. Information System on Live Births [SINASC] and female population by age, 2000-2022. Brasília, DF: Ministério da Saúde, 2022. Available at: https://datasus.saude.gov.br/informacoes-de-saude-tabnet/. Accessed: January 8, 2024).
-
7
In the absence of data necessary for directly calculating migration rates, these were estimated using the balancing equation (natural growth). For this purpose, in addition to population counts from the 2000, 2010, and 2022 censuses (IBGE, 2003, 2011, 2023), vital statistics (live births and mortality) were used. The net migration balance was obtained as the difference between natural population growth and the total population growth recorded in the censuses. Finally, the Net Migration Rate (NMR) was calculated as the ratio of net migration to the average population, multiplied by the number of years in each intercensal period and expressed per 100 inhabitants.
-
20
Information on the use of Artificial Intelligence Search, systematization, and final organization of references: Zotero. Organization of databases and the respective preparation of charts, tables, and graphs: No. Final text review for grammar and spelling improvement, to comply with formal language standards: No.
-
Editors
Maria do Livramento Miranda Clementino - https://orcid.org/0000-0001-7972-4869Rodrigo José Firmino - https://orcid.org/0000-0002-0831-6603Sara Raquel Fernandes Queiroz de Medeiros - https://orcid.org/0000-0003-0712-6135

 Source: Own elaboration based on data from the Brazilian Institute of Geography and Statistics (IBGE) municipal boundary data (
 Source: Own elaboration (via
  Source: Own elaboration (via
  Source: Own elaboration (via
  Source: Own elaboration (
 Source: Own elaboration, based on the IBGE 2000, 2010 and 2022 Censuses (
 Source: Own elaboration, based on the IBGE 2000, 2010 and 2022 Censuses (
 Source: Own elaboration, based on the IBGE 2000, 2010 and 2022 Censuses (
 Source: Own elaboration, based on the IBGE 2000, 2010 and 2022 Censuses (