 Estimating irrigation demand based on seasonal climate forecasts
ABSTRACT
In regions with water shortages, detailed planning on water resource use is essential. The use of climate models for short- and medium-range forecasts is an important strategy for obtaining early information on the water requirements of crops and the water regime of a particular basin. This study aimed to assess the performance of seasonal climate forecasts and their applicability in estimating irrigation needs. To that end, the Simulation Model for Irrigation Strategies and climate forecast data derived from the Eta model were used. To analyze simulations, five members (days 13, 14, 15, 16 and 17) of the seasonal forecasts of rainfall and reference evapotranspiration for every month between 2001 and 2012 were used. The spread for reference evapotranspiration demonstrated that the model was unable to reproduce the behavior of this variable during the dry period. Comparison between forecasts months in advance showed no significant differences between the rainfall and the reference evapotranspiration forecasts. However, the results obtained for a one-month lead-time forecast exhibited superior performance.
Key words:
water resources; irrigation planning; Eta regional climate model; seasonal forecast errors
HIGHLIGHTS:
There is potential use of the seasonal climate forecasts for irrigation planning.
Reference evapotranspiration in the watershed has low seasonal forecast skill.
Total monthly precipitation is underestimated in most of the river basin.
RESUMO
Em regiões com baixa disponibilidade hídrica é de grande importância um planejamento mais detalhado sobre o uso de recursos hídricos. A utilização de modelos climáticos destinados às previsões de curto e médio prazo se apresenta como uma estratégia importante para se obter informações antecipadas acerca da demanda hídrica de culturas e do regime hídrico de determinada bacia. Objetivou-se, neste estudo, avaliar o desempenho das previsões climáticas sazonais e sua aplicabilidade na estimativa da demanda de irrigação. Para tanto, utilizou-se o Modelo de Simulação de Estratégias de Irrigação e dados de previsão climática derivados do modelo Eta. Para análise das simulações, foi utilizado um conjunto de cinco membros (dias 13, 14, 15, 16 e 17) de previsão sazonal de precipitação e evapotranspiração de referência para cada mês entre o período de 2001 a 2012. O espalhamento para a evapotranspiração de referência demonstrou que o modelo não foi capaz de reproduzir o comportamento desta variável durante o período seco. Comparação entre previsões com os meses de antecedência não demonstraram diferenças significativas entre previsões da precipitação e da evapotranspiração de referência. Contudo, os resultados obtidos para as previsões com um mês de antecedência apresentaram melhor desempenho.
Palavras-chave:
recursos hídricos; planejamento de irrigação; modelo climático Eta; erros de previsão sazonal
Introduction
Irrigated agriculture has important benefits for the region, given that it increases yields, stabilizes production, and allows year-round farming (Souza et al., 2023). However, recent droughts in the area, increasing water use conflicts, and lack of knowledge on water availability have significantly compromised social well-being and economic development, demonstrating the urgent need to improve water management practices (Althoff et al., 2021; Ferreira et al., 2021).
Climate is one of the factors that has the greatest impact on agriculture, and forecasting is essential to any planning strategy. Seasonal climate forecasts seek to predict future statistical properties of a given climate period, from one month to an entire season, and this is possible due to the predictability provided by the sea surface temperature (Shukla, 1998).
Several literature studies have assessed climate forecasting performance in estimating irrigation needs, for example Villani et al. (2021) used the iCOLT system, which integrates satellite data, probabilistic seasonal climate forecasts, observed data, and the soil water balance model to perform irrigation forecasts. Lalić et al. (2018) applied the AquaCrop model for climate forecasts using the ensemble provided by the European Centre for Medium-Range Weather Forecasts (ECMWF). They concluded that, despite the uncertainties observed, seasonal climate forecasts could help agricultural decision-making.
These forecasts provide prior information on extreme climate events that may damage crops (for example, droughts or heat waves) or irrigation water management in order to establish regional policies (Grigorieva et al., 2023). In this respect, the main aim of this study was to assess seasonal climate forecast performance and its applicability in estimating irrigation needs.
Material and Methods
Seasonal climate forecasts and their applicability in estimating irrigation demands were assessed in the Paracatu River Basin (Figure 1). With a drainage area of 45,600 km², parts of the river basin are located in Minas Gerais and Goiás states and the Federal District (Andrade et al., 2020).

With a rainy season between October and April and an annual average rainfall of 1,338 mm, the climate of the Paracatu River Basin is predominantly tropical humid. Annual mean reference evapotranspiration and temperature are 1,140 mm and 23 °C, respectively (Andrade et al., 2020). The following soils are found: Quartzipsamments, Oxisols, Inceptisols and Entisols (USDA, 2014).
Irrigation accounts for the primary water demand, comprising 86.6% of total water usage. The basin has 1,238 irrigation pivots, located mainly in the sub-basins of the Entre Ribeiro creek and Preto river, which together constitute 53% of the basin’s total irrigated area (Melo et al., 2020).
Future rainfall (FR) and reference evapotranspiration (ETo) forecasts were derived from the Eta model (Chou et al., 2020). Pre-processing was carried out using the R programming language (R Core Team, 2022).
Model performance was assessed considering raster and level five ottobasin data from the Paracatu River Basin. As part of pre-processing, Eta model forecasts were converted from 40 to 10-km spatial resolution using the raster package on RStudio (R Core Team, 2022). This step was needed to make the simulated and observed data scales compatible.
ETo was calculated based on forecast data using the Pennman-Monteith-FAO method (Souza et al., 2023). For latitude and elevation data, the ASTER Global Digital Elevation Model NetCDF V003 was used (NASA, 2019), obtained online through Application for Extracting and Exploring Analysis Ready Samples (AρρEEARS) (AppEEARS Team, 2022).
The soil data used in the present study were obtained from the raster of available water capacity (EMBRAPA, 2021).
The Eta model generated seasonal runs, always starting on days 13, 14, 15, 16, and 17 of every month, and ended four months later. The run starting on January 13, for example, ended on May 30. In February, a model run started on days 13, 14, 15, 16, and 17 and ended on June 30, and so on. The five runs, with different starting dates, comprise one seasonal forecast produced in ensemble mode.
For forecast assessment purposes, ETo-Brazil (Althoff et al., 2020) was used for reference evapotranspiration, and the MERGE product (Rozante et al., 2010) for rainfall data. Both databases exhibit a 10 km x 10 km spatial resolution.
Climate forecast performance was assessed in two ways:
i. By comparing the forecasts, in the same months at different monthly lead times; and,
ii. By comparing weekly forecast values initiated in one month with weekly forecasts in the next three months, whereby forecasts from the first week of August, with an average of five members, were compared with the first weeks of September, October, and November, with an average of the five members of these months.
Forecast performance was assessed by estimating the mean absolute error (MAE), the Nash-Sutcliffe efficiency (NSE) percentage bias (PBIAS), and Wilmott’s index of agreement (d) (Silva et al., 2020a).
Table 1 presents the range of PBIAS classification values.
Table 2 presents the range of Nash-Sutcliffe Efficiency classification values and Willmott’s index. NSE varies from -∞ to 1. Willmott’s index varies from 0 to 1. For the two metrics, the ideal value is 1.
An analysis of the Eta model rainfall forecast was conducted based on the categories that are incorrect or correct forecast criteria according to the occurrence or not of a rain event. To that end, the following indices were used to assess the occurrence or not of rainfall, as described by Moon & Kim (2020): proportion correct (PC), Eq. 1, critical success index (CSI), Eq. 2, probability of detection (POD), Eq. 3, and false alarm ratio (FAR), Eq. 4.
where:
a - the number of points at which the model forecast rain, and it occurred;
b - the number of points at which the model forecast rain, and it did not occur;
c - the number of points at which the model did not forecast rain, and it occurred;
d - the number of points at which the model did not forecast rain, and it did not occur; and,
n - the number of forecasted days.
The proportion correct (PC), Eq. 1, is considered the most direct and intuitive measure of accuracy. The proportion of hits meets the principle of event equivalency, given that it credits “yes” and “no” forecasts equally.
Irrigation needs in the Paracatu River Basin were simulated using the Irrigation Strategy Simulation Model (ISSM) (Souza et al., 2023).
Irrigation needs were simulated for the soybean crop, with a 100-day cycle and a maximum rooting depth of 60 cm. Simulations were carried out for 2005 and 2012, and the sowing occurred on October 15 of every year.
Results and Discussion
Analysis of the difference between monthly rainfall forecast by the Eta model and the MERGE monthly rainfall is demonstrated in Figure 2. The results showed that the forecasts underestimated monthly rainfall in most of the basin, especially in the rainy months of November and January, when the maximum forecast error was -781.9 and -495.7 mm, respectively.

Difference between total monthly rainfall simulated by Eta and MERGE in the Paracatu River basin
The estimated monthly ETo showed that the Eta model overestimated ETo for most of the Paracatu River Basin, mainly for November and January, as shown in Figure 3. In November, the model overestimated ETo for the entire basin, when forecast errors ranged between 13.8 and 141.5 mm.

Difference between total monthly rainfall simulated by Eta and ETo-Brazil in the Paracatu River basin
However, a historic series of climate modeling with established lead times questions whether forecast error patterns change with an increase in forecast lead time. According to Chou et al. (2020), the forecast errors in the one-month are smaller than the two-month lead trimester. This was also observed in this analysis, where, for all metrics, the first month of lead time demonstrated more satisfactory results compared to the others.
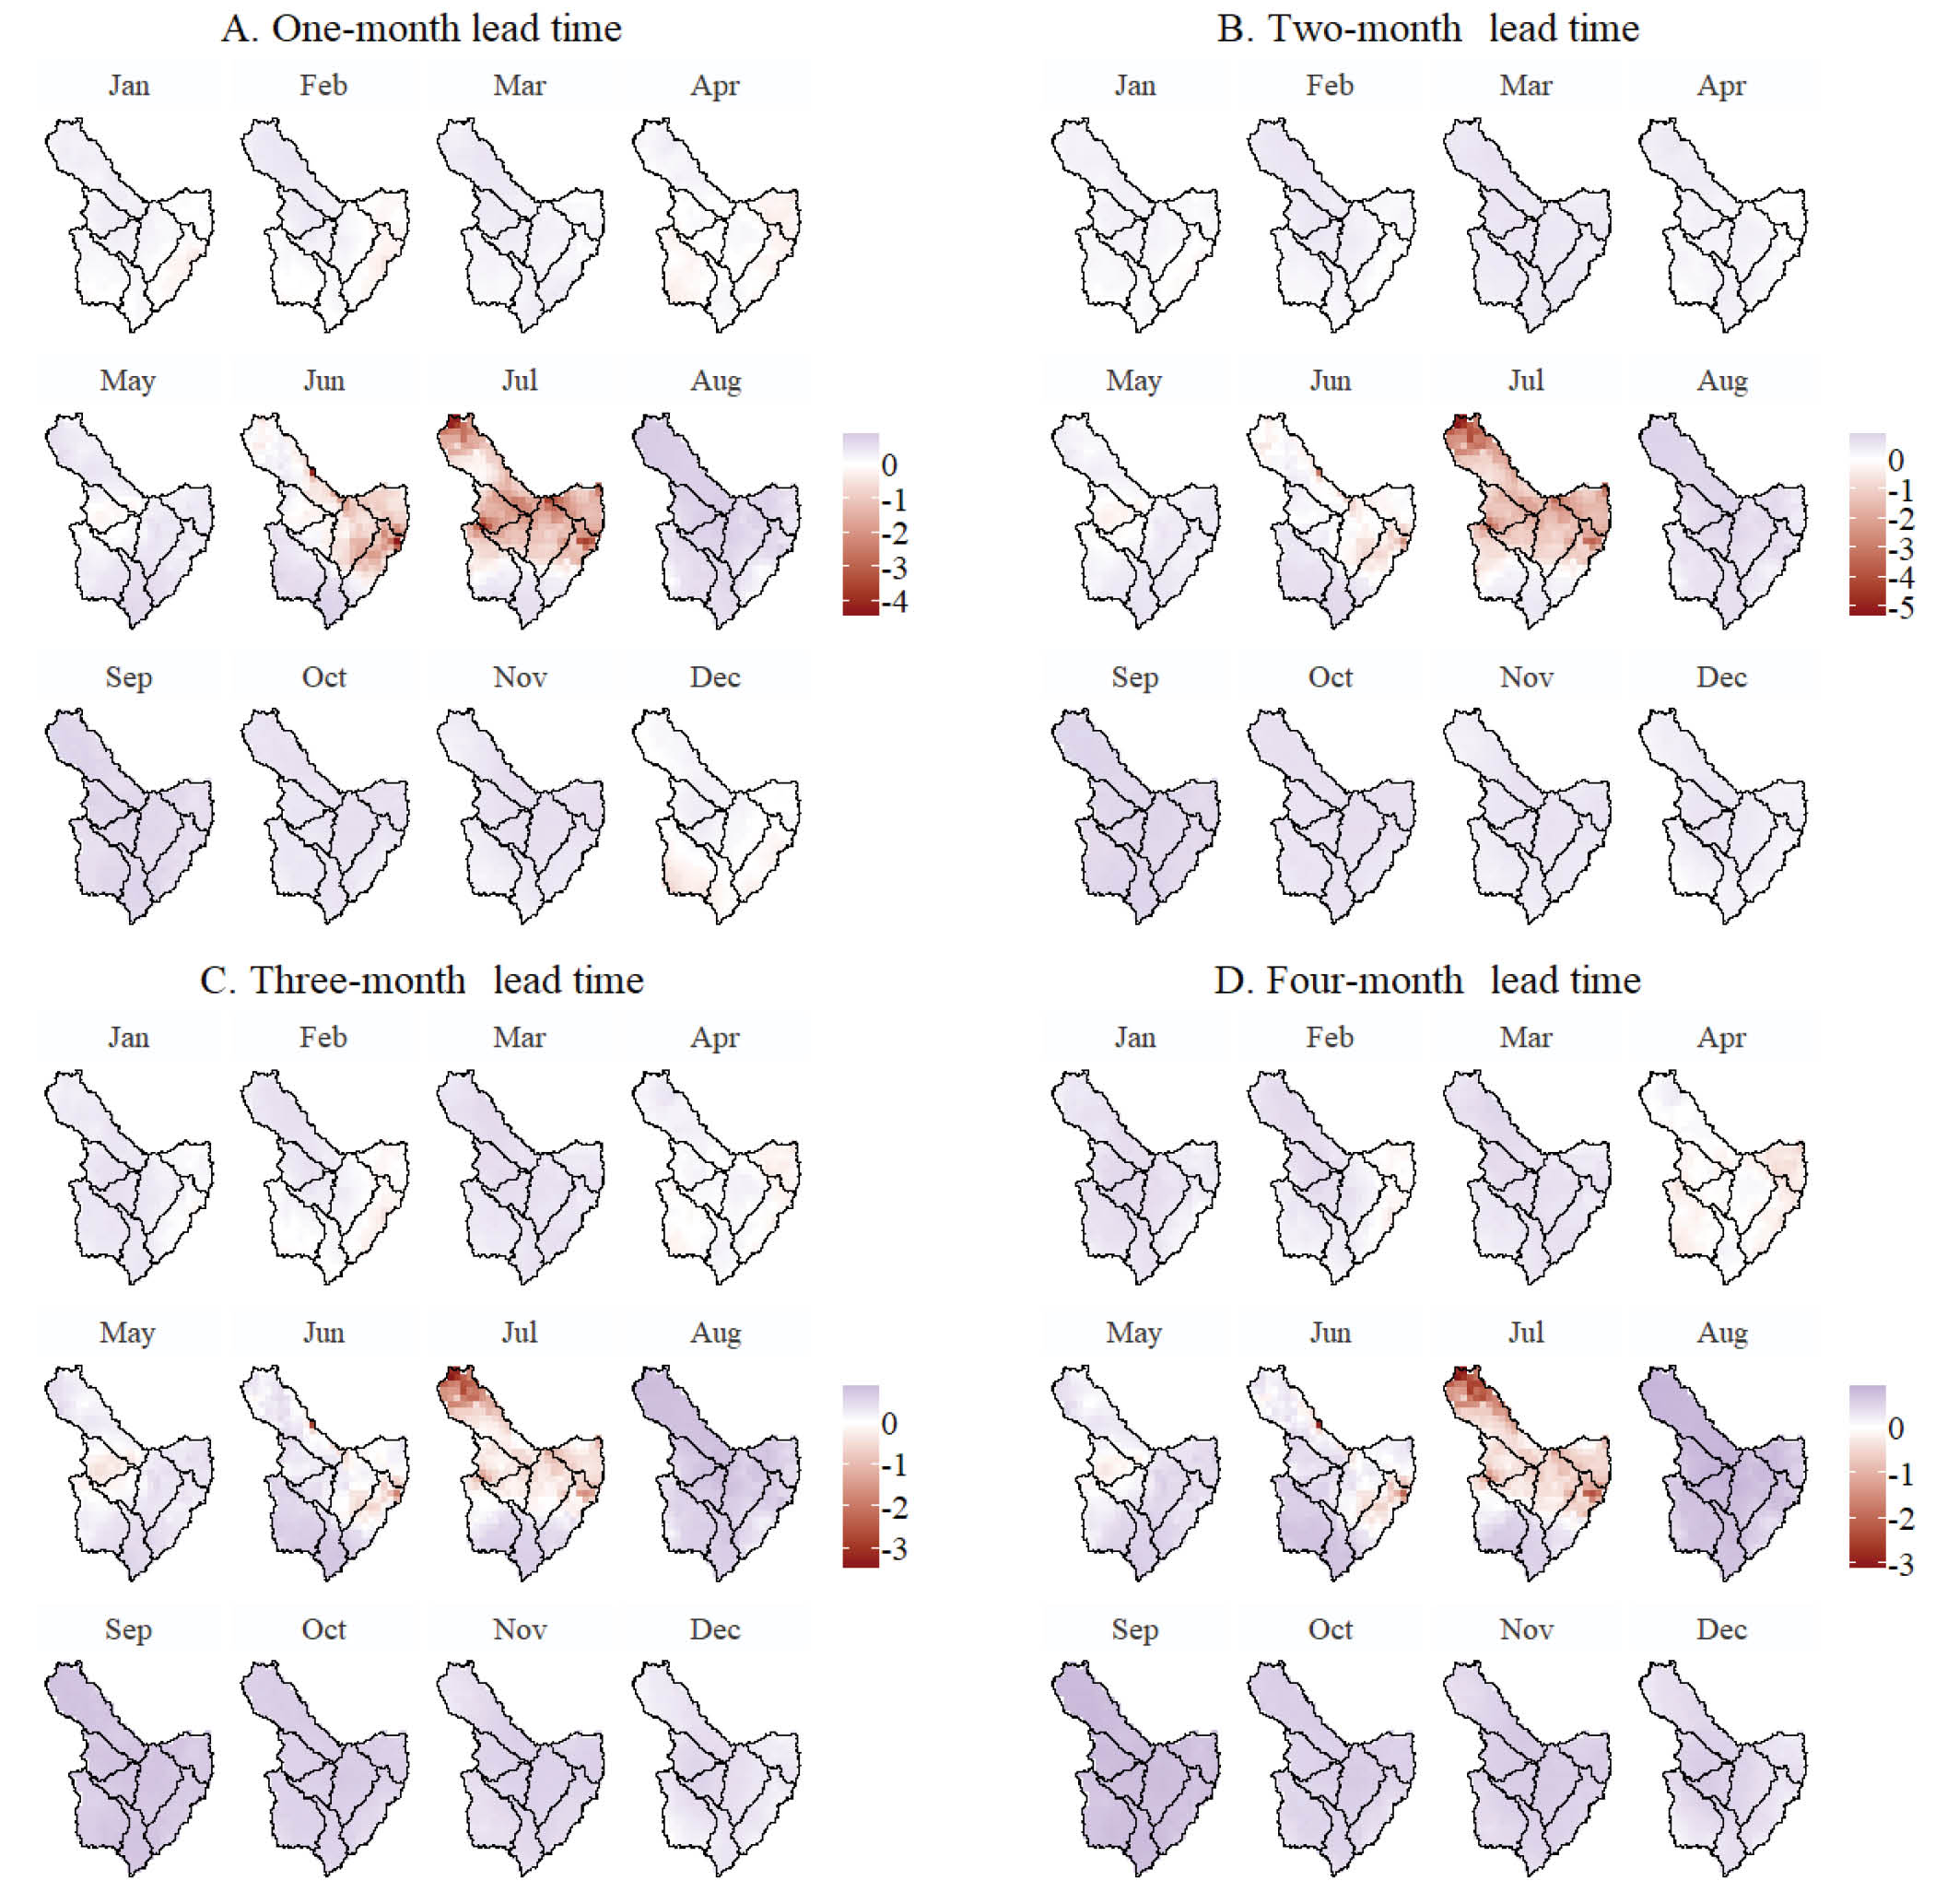
Figure 4 shows the values for percent bias over the study area. In general, PBIAS varied between 5 and 75% for the fourth month, 6 and 71% for the third, 40 and 77% for the second, and 3 and 66% for the one-month lead. The largest PBIAS values for each lead time were obtained in June and July. It is important to note that there was no bias correction.
Avila-Diaz et al. (2020) obtained similar bias percentages for the São Francisco River basin when evaluating the Eta-BESM and Eta-MIROC5 climate models. The authors also found underestimation during the dry period and overestimation in the rainy period.
Based on MAE, the worst model performance occurred between October and March, when MAE values are the largest. Figure 5 shows that forecasts for the dry months exhibited superior performance, regardless of lead time. In general, the best results were found during the dry months in all lead times, with minimum values occurring between May and September, with a minimum MAE of 0.9 mm in the first lead time month (July). The maximum MAE values were estimated primarily in November and December, ranging between 168.7 and 228.5 mm per month.
NSE revealed that the values furthest from 1 are located in the northern part of the basin, mainly between the two and four-month lead time, primarily in July. In this metric, negative values mean that the data observed are better predictors of reality than their simulated counterparts, which occurred in all the years of the historical series. Numerically, the three-month lead time obtained the best results since NSE varied between -6.8 and 0.5. On the other hand, the one-month lead time exhibited the best behavior, given that there were fewer negative pixel values. However, in all cases, there were more values below 0, which were classified as unsatisfactory according to NSE.
Willmott´s index obtained the values closest to 0 in the central and southeast regions of the basin, indicating that agreement is low in these areas. In general, according to this index, the results were quite unsatisfactory most of the year. However, in some months, the results were close to 1, such as January (0.76) and February (0.83) with a one-month lead time and January (0.77) and July (0.84) with three months. Similar results were obtained by Pinheiro et al. (2020) for Rio de Janeiro state, based on estimates generated by the HADCM3 model, ranging from 0.16 to 0.74. The authors reported difficulty simulating this variable, given that it is influenced by different atmospheric phenomena.
All the metrics demonstrated that rainfall calculated with a one-month lead time obtained the best results, corroborating Chou et al. (2020), who analyzed a 10-year historical series of rainfall in Brazil. Based on the results, seasonal forecast skill is low in the Center-West and Southeast regions, are located in a low predictability regime (Nobre et al., 2006). It is a transition zone between the tropical and extratropical regimes and is affected by both atmospheric conditions (Reboita et al., 2022).
In the present analysis, a rain event was considered any occurrence where total rainfall was greater than or equal to 10 mm per month. In general, the values were similar in all the lead months of each index, with minimum variations.
Analysis of the results based on the probability of detection (POD), which measures the accuracy of the forecasting model, showed that the Eta model was less than 50% accurate in forecasting daily rainfall for the Paracatu River Basin in all the lead months. FAR, which assesses false alarm rate, obtained 0.48, meaning that at least 48% of rain forecasts were inaccurate. However, the critical success index (CSI) demonstrated a solid performance, achieving 70%. In addition, the proportion correct (PC) showed that at least 89% of forecasts were correctly attributed to real occurrences for both rain events that occurred and did not occur.
Figure 6 shows that, in general, reference evapotranspiration showed a pattern similar to that of the monthly rainfall. The evapotranspiration results indicated that the performance of the model was worse in the north of the basin, with a PBIAS between 0 and 1, suggesting overestimation in this region.

Spatial distribution of bias percentage coefficient values for evapotranspiration in the study area
MAE ranged between 11 and 93 mm per month, with values varying from 0.35 to 3 mm per day, which is similar to the results obtained by Gomes et al. (2022) for the Madeira River Basin, based on intraseasonal simulations generated by the Eta model. March and September obtained the lowest values, varying from 12 to 17 and 11 to 19 mm per month, respectively. Maximum error values were found for June and July, varying from 67 to 93 and 60 to 85 mm per month, respectively. No significant differences were found for lead time, as show in Figure 7. Gomes et al. (2022) obtained substantial estimate improvements for evapotranspiration after correcting for bias.
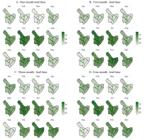
NSE also demonstrated low model accuracy in dry months, with the worst results obtained from May to July, concentrated in the southeast region of the basin, where the source of the Paracatu River is located. In all forecasts, June exhibited the worst performance. Pixel-by-pixel analysis revealed that the one-month lead time obtained the most acceptable results, where NSE reached 0.2 in March. However, it also exhibited the worst results, with NSE reaching -1,258.3 in June. The findings indicated that for all the forecast scenarios, the reference data are better ETo forecasters for all the months of the year, given that all the results are classified as unsatisfactory.
In general, Willmott’s index obtained unsatisfactory estimation results for the entire study area, primarily in the dry months, reinforcing the fact that the model was unable to adequately reproduce reference evapotranspiration values for the study area during this period. The d index varied from 0.04 to 0.6, 0.04 to 0.5, 0.04 to 0.5, and 0.04 to 0.05 for one, two, three, and four-month lead times, respectively.
Given the uncertainties of Zhao et al. (2019) in estimating Eto, the authors found that the global circulation models are unable to represent climate conditions on a small scale. However, this can also be observed in regional circulation models, which may be attributed to systematic errors inherent to the Eta model, resulting from the representation of physical processes, boundary conditions, and initial conditions (Silva et al., 2020b).
The water requirement of the 100-day cycle soybean crop, planted on October 15, for the 2005/06 and 2010/11 growing seasons, was estimated using the ISSM model. For the simulated data, a one-month lead time forecast was used because it obtained the most acceptable results.
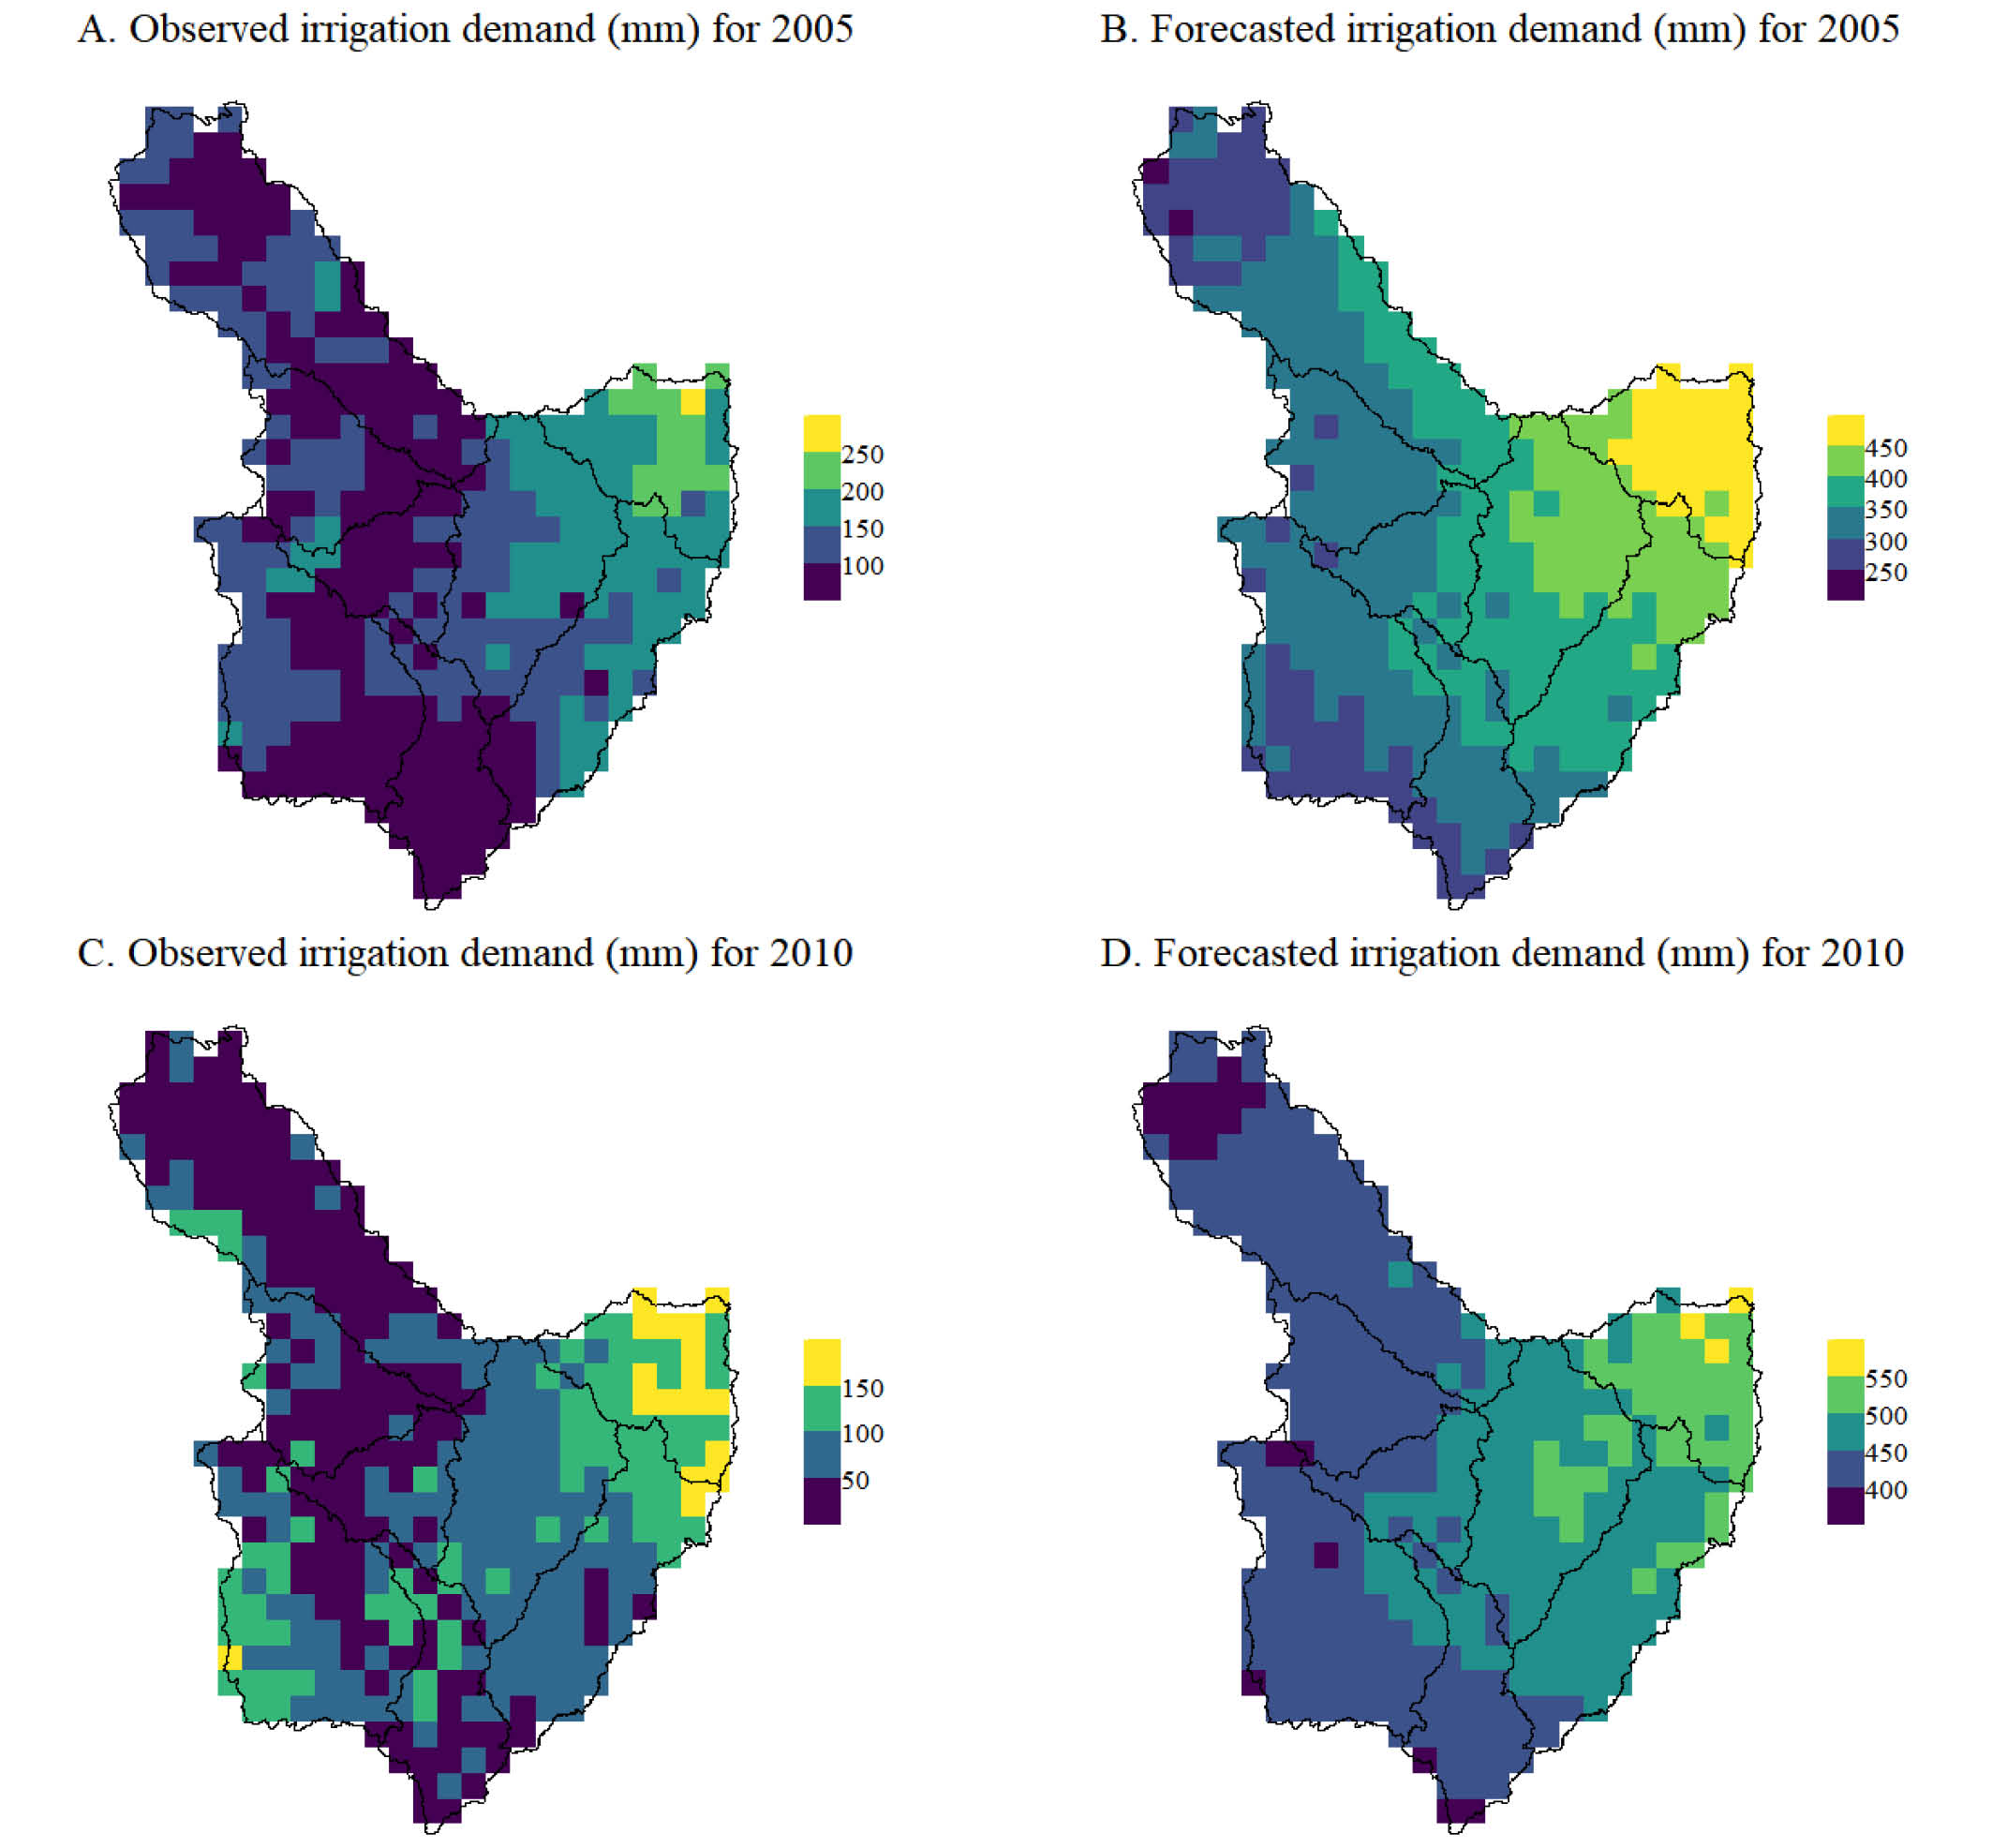
The spatial distribution of the irrigation depth predicted in each ottobasin is presented in Figure 8. In 2005, the highest demand levels occurred in Baixo Paracatu, with a range between 414.8 and 497.7 mm. In 2010, once again, the maximum values were in the same region, ranging between 481.2 and 557.0 mm, in the corresponding sub-basin. In 2005, the minimum values occurred in the Rio Prata Basin, in the Alto Paracatu region, varying between 250.1 and 361.3 mm, while in 2010, the minimum values were found in the Rio Preto Basin, ranging from 383.4 to 463.1 mm.

Figure 8 presents the observed (Figures 8A and C) and forecasted (Figures 8B and D) irrigation demand values. The maximum values were also found in Low Paracatu for both 2005 and 2010, varying from 91.1 to 183.2 mm in the latter and 126.4 to 268.1 mm in the former. In 2005, the minimum values in the Rio Prata Basin ranged from 53.6 to 146.9 mm. The minimum values in 2010 were observed in the Médio-Alto Paracatu, varying from 41 to 101 mm.
Figure 9 shows the statistical analysis results for PBIAS (Figures 9A and B), MAE (Figures 9C and D), d index (Figures 9E and F), and NSE (Figures 9G and H). The percentage bias indicates an overestimation of irrigation demand, following the trend observed in reference to evapotranspiration during the rainy season. Total PBIAS for the 100 days of demand reached exorbitant error values, concentrated in the Rio Preto, with minimum values of 223 and 286% in 2005 and 2010, respectively, classifying them as unsatisfactory.

Moreto et al. (2020) used rainfall data generated by the Eta model to support sugarcane production decision-making. They concluded that, despite the fact that the model overestimated rainfall in the study area, the results may still help producers in irrigation decisions and water management practices. As such, the results need refinement in the irrigation management phase.
The mean absolute error for 2005 was between 111.38 and 319.72 mm, indicating that the predicted and observed values differ considerably. It is important to note that this represents an average of 100 days of irrigation, which, distributed across the period assessed here, is equivalent to an irrigation depth of approximately 3 mm per day. For 2010, mean error values were higher for the period, varying between 264.6 and 443.1 mm over 100 days.
In a pixel-by-pixel analysis for the two years analyzed, the index of agreement and NSE were 0 for the entire basin. It is believed that this was caused because there was no large group for clustering except for the pair of coordinates related to each pixel. In order to produce results for the aforementioned metrics, the ottocode of each sub-basin was used for value clustering. In a general assessment, the data exhibited low agreement.
These results showed the need to correct seasonal forecast biases, as demonstrated by Pushpalatha & Gangadharan (2020). These authors reported that simple bias corrections significantly changed yield forecasts and water requirements in the soybean crop.
Conclusions
-
Although the Eta model was able to forecast the spatial pattern of rainfall and reference evapotranspiration relatively well during the period analyzed, their quantitative values should be improved, primarily for reference evapotranspiration.
-
Despite the uncertainties in predicting irrigation using the climate model, the results can be considered, from the standpoint of management and decision-making support in the planning phase.
-
Bias corrections of climate forecasts are required to make them suitable for irrigation management.
Acknowledgements
To the project “Incorporação de previsões climáticas e hidrológicas nos horizontes sazonal e subsazonal visando orientar a gestão da alocação de água na bacia do rio São Francisco”, CAPES for the Master´s scholarship (process n. 88887.602657/2021-00) and CNPq for Research Productivity (PQ) grants No: 306541/2023-8 and 312742/2021-5.
Literature Cited
-
Althoff, D.; Dias, S. H. B.; Filgueiras, R.; Rodrigues, L. N. ETo‐Brazil: a daily gridded reference evapotranspiration data set for Brazil (2000-2018). Water Resources Research, v.56, e2020WR027562, 2020. https://doi.org/10.1029/2020WR02756
» https://doi.org/10.1029/2020WR02756 -
Althoff, D.; Rodrigues, L. N.; Silva, D. D. Addressing hydrological modeling in watersheds under land cover change with deep learning. Advances in Water Resources, v.154, e103965, 2021. https://doi.org/10.1016/j.advwatres.2021.103965
» https://doi.org/10.1016/j.advwatres.2021.103965 -
Andrade, R. G.; Lima, E. de P.; Teixeira, A. H. de C.; Leivas, J. F.; Victoria, D. de C.; Facco, A. G. Mapeamento espaço-temporal da evapotranspiração na bacia do rio Paracatu utilizando imagens MODIS e o algoritmo SAFER. Brazilian Journal of Animal and Environmental Research, v.3, p.1729-1739, 2020. https://doi.org/10.34188/bjaerv3n3-088
» https://doi.org/10.34188/bjaerv3n3-088 -
AppEEARS Team - Application for Extracting and Exploring Analysis Ready Samples. Ver. 3.1. NASA EOSDIS Land Processes Distributed Active Archive Center (LP DAAC), USGS/Earth Resources Observation and Science (EROS) Center, Sioux Falls, South Dakota, USA. Available on: <Available on: https://appeears.earthdatacloud.nasa.gov >. Accessed on: Apr. 2022.
» https://appeears.earthdatacloud.nasa.gov -
Avila-Diaz, A.; Abrahão, G.; Justino, F.; Torres, R.; Wilson, A. Extreme climate indices in Brazil: evaluation of downscaled earth system models at high horizontal resolution. Climate Dynamics. v.54, p.5065-5088, 2020. https://doi.org/10.1007/s00382-020-05272-9
» https://doi.org/10.1007/s00382-020-05272-9 -
Chou, S. C.; Dereszynski, C.; Gomes, J. L.; Pesquero, J. F.; Avila, A. M. H.; Resende, N. C.; Alves, L. F.; Ruiz-Cárdenas, R. R.; Souza, C. R. de; Bustamante, J. F. F. Ten-year seasonal climate reforecasts over South America using the Eta Regional Climate Model. Anais da Academia Brasileira de Ciências, v.92, e20181242, 2020. https://doi.org/10.1590/0001-3765202020181242
» https://doi.org/10.1590/0001-3765202020181242 -
EMBRAPA - Empresa Brasileira de Pesquisa Agropecuária. Arquivos compactados - Mapa de água disponível do solo (mm/cm) a 60-100 cm do Brasil na resolução espacial de 90 m - Versão 2021. Available on: <Available on: http://geoinfo.cnps.embrapa.br/documents/3475 >. Accessed on: Nov. 2022.
» http://geoinfo.cnps.embrapa.br/documents/3475 -
Ferreira, F. L. V.; Rodrigues, L. N.; Silva, D. D. Influence of changes in land use and land cover and rainfall on the streamflow regime of a watershed located in the transitioning region of the Brazilian Biomes Atlantic Forest and Cerrado. Environmental Monitoring and Assessment, v.193, p.1-17, 2021. https://doi.org/10.1007/s10661-020-08782-5
» https://doi.org/10.1007/s10661-020-08782-5 -
Gomes, W. de B.; Satyamurty, P.; Correia, F. W. S.; Chou, S. C.; Vergasta, L. A.; Lyra, A. de A. Intraseasonal scale ensemble forecasts of precipitation and evapotranspiration for the Madeira River basin using different physical parameterizations. Atmospheric Reserarch, v.270, p.1-16, 2022. https://doi.org/10.1016/j.atmosres.2022.106086
» https://doi.org/10.1016/j.atmosres.2022.106086 - Grigorieva, E.; Livenets, A.; Stelmakh, E. Adaption of Agriculture to Climate Change: A Scoping Review. Climate. v.11, p.1-37. 2023.
-
Lalić, B.; Firanj Sremac, A.; Eitzinger, J.; Stričević, R.; Thaler, S.; Maksimović, I.; Daničić, M.; Perišić, D.; Dekić, L. Seasonal forecasting of green water components and crop yield of summer crops in Serbia and Austria. The Journal of Agricultural Science, v.156, p.658-672, 2018. https://doi.org/10.1017/S0021859618000047
» https://doi.org/10.1017/S0021859618000047 -
Melo, M. C.; Santos, A. S. P.; Santos, N. A. P.; Araújo, B. M.; Oliveira, J. R. S.; Campos, A. R. Evaluation of potential use of domestic treated efluents for irrigation in areas subjected to conflicts over water use in Paracatu River Basin. Revista Caminhos da Geografia, v.21, p.52-63, 2020. http://doi.org/10.14393/RCG217550442
» http://doi.org/10.14393/RCG217550442 -
Moreto, V. B.; Rolim, G. S.; Esteves, J. T.; Vanuytrecht, E.; Chou, S. C. Sugarcane decision-making support using Eta Model precipitation forecasts. Meteorology and Atmospheric Physics, v.133, p.181-191, 2021. https://doi.org/10.1007/s00703-020-00738-1
» https://doi.org/10.1007/s00703-020-00738-1 -
Moon, S. H.; Kim, Y. H. An improved forecast of precipitation type using correlation-based feature selection and multinomial logistic regression. Atmospheric Research, v.240, e104928, 2020. https://doi.org/10.1016/j.atmosres.2020.104928
» https://doi.org/10.1016/j.atmosres.2020.104928 -
NASA - National Aeronautics and Space Administration. ASTER Global Digital Elevation Model V003. Available on: <Available on: https://search.earthdata.nasa.gov >. Accessed on: Apr. 2022.
» https://search.earthdata.nasa.gov -
Nobre, P.; Marengo, J. A.; Cavalcanti, I. F. A.; Obregon, G.; Barros, V.; Camilloni, I.; Campos, N.; Ferreira, A. G. Seasonal-to-Decadal Predictability and Prediction of South American Climate. Journal of Climate, v.19, p.5988-6004, 2006. https://doi.org/10.1175/JCLI3946.1
» https://doi.org/10.1175/JCLI3946.1 -
Pinheiro, F. D. S.; Santos, E. O. D.; Lyra, G. B.; Fisch, G. F.; Wanderley, H. S. Precipitação e temperatura do ar simuladas pelo modelo ETA/CPTEC-HADCM3 para o estado do Rio de Janeiro. Revista Brasileira de Geografia Física, v.13, p.2037-2052, 2020. https://doi.org/10.26848/rbgf.v13.5.p2037-2052
» https://doi.org/10.26848/rbgf.v13.5.p2037-2052 -
Pushpalatha, R.; Gangadharan, B. Assessing the influence of climate model biases in predicting yield and irrigation requirement of cassava. Modeling Earth Systems and Environment, v.7, p.307-315, 2021. https://doi.org/10.1007/s40808-020-01038-8
» https://doi.org/10.1007/s40808-020-01038-8 -
R Core Team. R: A language and environment for statistical computing. R Foundation for Statistical Computing, Vienna, Austria, 2022. Available on: <Available on: https://www.rproject.org/ >. Accessed on: Jan. 2022.
» https://www.rproject.org/ -
Reboita, M. S.; Kuki, C. A. C.; Ferreira, G. W. S.; Torres, F. L. R.; Lima, L. M. M.; Lima, J. W. M. “Drivers” da previsão climática sazonal: uma revisão da literatura. Revista Brasileira de Climatologia, v. 31, p. 1-25, 2022. https://doi.org/10.55761/abclima.v31i18.15235
» https://doi.org/10.55761/abclima.v31i18.15235 -
Rozante, J. R.; Moreira, D. S.; Gonçalves, L. G. G. de.; Vila, D. A. Combining TRMM and Surface Observations of Precipitation: Technique and Validation Over South America. Weather and Forecasting, v.25, p.885-894, 2010. https://doi.org/10.1175/2010WAF2222325.1
» https://doi.org/10.1175/2010WAF2222325.1 -
Shukla, J. Predictability in the midst of chaos: A scientific basis for climate forecasting. Science, v.282, p.728-731, 1998. https://doi.org/10.1126/science.282.5389.728
» https://doi.org/10.1126/science.282.5389.728 -
Silva, T. J. A. da; Santos, M. N. F. dos; Pacheco, A. P.; Bonfin-Silva, E. M.; Duarte, T. F. Avaliação de método alternativo e de condutivímetros na determinação da condutividade elétrica do solo. Revista Brasileira de Agricultura Irrigada, v.14, p.3987-3996, 2020a. https://doi.org/10.7127/RBAI.V14N101154
» https://doi.org/10.7127/RBAI.V14N101154 -
Silva, J. G.; Wanderley, H. S.; Santos, E. O.; Lyra, G. B. Avaliação e correção das simulações do modelo Eta/CPTEC-HADCM3 para o estado do Rio de Janeiro. Revista Brasileira de Geografia Física , v.13, p.350-363, 2020b. https://doi.org/10.26848/rbgf.v13.1.p350-363
» https://doi.org/10.26848/rbgf.v13.1.p350-363 -
Souza, S. A.; Rodrigues, L. N.; Cunha, F. F. Assessing the precision irrigation potential for increasing crop yield and water savings through simulation. Precision Agriculture, v.24, p.533-559, 2023. https://doi.org/10.1007/s11119-022-09958-4
» https://doi.org/10.1007/s11119-022-09958-4 -
United States. Soil Survey Staff. Keys to Soil Taxonomy (12th ed.) USDA NRCS. 2014. Available at: <Available at: http://www.nrcs.usda.gov/wps/portal/nrcs/main/soils/survey/ >. Accessed on: Sep 19, 2024.
» http://www.nrcs.usda.gov/wps/portal/nrcs/main/soils/survey/ -
Villani, G., Tomei, F.; Pavan, V.; Pirola, A.; Spisni, A.; Marletto, V. The iCOLT climate service: Seasonal predictions of irrigation for Italy. Meteorological Applications, v.28, p.1-16, 2021. https://doi.org/https://doi.org/10.1002/met.2007
» https://doi.org/https://doi.org/10.1002/met.2007 -
Zhao, T.; Wang, Q. J.; Schepen, A.; Griffiths, M. Ensemble forecasting of monthly and seasonal reference crop evapotranspiration based on global climate model outputs. Agricultural and Forest Meteorology, v.264, p.114-124, 2019. https://doi.org/10.1016/j.agrformet.2018.10.001
» https://doi.org/10.1016/j.agrformet.2018.10.001
Funding statement
There are no supplementary sources.