 Application of Mathematical Models to Evaluate Serological Monitoring in Breeders and Commercial Laying Hens
ABSTRACT
Mathematical models based on regression equations are an important tool for the interpretation of data generated by the serological monitoring of poultry flocks. The present study aimed to evaluate the serological monitoring of breeders and commercial laying hens by several poultry companies, and to develop mathematical models for seven different poultry diseases. Data from serological tests for seven diseases (chicken infectious anemia, infectious bronchitis, infectious bursal disease, Newcastle disease, avian encephalomyelitis, avian metapneumovirus, and avian reovirus) were selected for analysis in this study. The variables “age of birds at the time of blood collection” was considered as the independent variable (x), while “antibody titer” was set as the dependent variable (y). Analysis of variance and coefficient of multiple determination (R²) were used to select the model with the highest capacity to adequately describe the analyzed data. Data from serological monitoring generated 166 linear and non-linear regression equations, but only 1.2% of them yielded an R²≥0.8 and more than 25 serum collections. The low number of suitable models may be related to the lack of standardization of the sample collection. In summary, serological monitoring of breeders and commercial laying hen flocks can be performed using mathematical models, but the lack of standardization of sample collections may have led to limited results.
Keywords:
Amathematical models; monitoring; regression equations; serological tests
INTRODUCTION
To achieve food safety standards, quality control must be met throughout the production chain (FAO, 2019). Quality control is based on decision criteria and a specific operational framework that help determine the final product quality, procedures which must be effective in generating good results at low cost (Feigenbaum, 1983). Reducing costs is a challenge because, in addition to the construction and preparation of poultry facilities and the selection of supplies to be used in feed production, an effective vaccination program must also be implemented.
Quality control programs must provide a periodic review of strategies and the use of statistical control methodologies, which could be associated with additional metrology and reliability techniques (Feigenbaum, 1983). However, the data generated through poultry health measurement systems are often subject to empirical assessment, which can be justified by the difficulty in interpreting the results of the serological monitoring of flocks. As such, the data produced by serological monitoring are partially lost or underused (Silva, 2000; Salle et al., 2020).
To reduce health risks and financial costs, decisions associated with poultry production and health must meet the associated objective criteria (Salle et al., 2018). Previous studies conducted by our research group used artificial neural networks to evaluate and predict the productive performance of breeders, broilers, hatcheries, and slaughterhouses (Salle et al., 2001; Reali, 2004; Salle, 2005; Spohr, 2011; Tedeschi, 2019; Almeida et al., 2020; Oliveira et al., 2021). Furthermore, other studies used neural networks to predict the antimicrobial resistance of Escherichia coli strains of avian origin, and to evaluate lymphocyte depletion in the Bursa of Fabricius and thymus (Rocha, 2006; Moraes et al., 2010, Carvalho et al., 2016).
Mathematical models based on regression equations can aid in the interpretation of data generated by the serological monitoring of poultry flocks. These models allow the identification of patterns, explanation of variations, and prediction of future values (Pennstate, 2018). The establishment of interpretation and quality control criteria for serological results generated by poultry companies in southern Brazil using mathematical models was initially proposed by Salle et al. (1998, 1999). Both linear and non-linear regression equations have been proposed to describe the relationship between the animals’ age and antibody titers presented by the birds for Newcastle, infectious bursal disease, and infectious bronchitis of chickens.
In this context, the present study aimed to evaluate the serological monitoring of breeders and commercial laying hens by several poultry companies, and to develop mathematical models for seven different poultry diseases.
MATERIALS AND METHODS
Serological data
Serological tests were performed using an enzyme-linked immunosorbent assay (ELISA) by two accredited laboratories linked to the Ministry of Agriculture and Livestock (MAPA) of Brazil (Brasil, 2013). Seven diseases were selected for analysis in this study: chicken infectious anemia, infectious bronchitis, infectious bursal disease (Gumboro disease), Newcastle disease, avian encephalomyelitis (AE), avian metapneumovirus, and avian reovirus. The methodology followed the protocols described by the manufacturers of the commercial kits. The results were expressed in the form of geometric mean titles (GMT).
Flocks
Data from 147,009 serum samples were collected from breeders and laying hens aged 4-66 weeks from 42 poultry companies in southern Brazil. Serological tests were conducted between 2017 and 2023.
Mathematical models
The variables “age of birds at the time of blood collection” and “antibody titer” were selected for the construction of the mathematical models. Moreover, the variable “age of birds” was considered as the independent variable (x), while “antibody titer” was set as the dependent variable (y).
Linear regression analysis was applied to adjust the simple linear, quadratic, and cubic models. Cubic order was established as the limit, because higher-order models are not reliable for making predictions or may produce predictions with a greater chance of error (Machado, 2006). Non-linear regression analysis was further applied to select the logistic model.
Statistical analysis
All analyses were performed using the JMP software, and a 95% confidence interval was adopted. A minimum of 25 serum collections were determined for each disease to establish a generalized model. Assessment of the homogeneity of variances indicated the need to transform the original data, with logarithmic transformation selected as it is normally related to the antibody titer (Salle et al., 1999). Logarithmic transformation is also commonly used to simultaneously stabilize the variance and solve the problems of heteroscedasticity and non-normality of the data (Salle et al., 1999; Kleinbaum et al., 2007).
Analysis of variance and coefficient of multiple determination (R²) were used to select the model with the highest capacity to adequately describe the analyzed data. The R² value was calculated using the following equation:
Where MSS represents the model Sum of Squares (the sum of the differences between the mean of the observed points and the points predicted by the model, squared), and TSS represents the Total Sum of Squares (the sum of the differences between the mean of the observed points and these points, squared).
RESULTS AND DISCUSSION
The periodic collection of serum samples is primarily used to monitor vaccine responses. The generated data also supports objective judgment and decision making for the optimization of flock health and production (Liebhart et al., 2023). Immunoassays based on the evaluation of humoral immunity can provide easy and rapid results at low cost (Priyanka et al., 2016). The use of humoral immunity as an interpretation criterion for serological results is based on the specificity of the antibody response induced by vaccination or viral infection (Abbas et al., 2021).
Considering its high flexibility, the quick turnaround, and the large sample sizes that require simultaneous processing, ELISA has been routinely used to monitor flock health, with commercial systems available for many poultry diseases (Liebhart et al., 2023). The miniaturization of ELISA to a 96-well microtiter plate further allows for a higher throughput of the assay and reduced costs (Makarewicz et al., 2015). The use of different substrates in ELISA has a major advantage, as the substrates bind to the respective conjugates specifically, subsequently developing coloration that can be read by an ELISA reader in terms of wavelength (Priyanka et al., 2016).
Adequate interpretation of ELISA results is an essential tool to improve vaccination programs and understand the actions required to improve them. Thus, monitoring serological responses is essential for the success of vaccination programs. Monitoring antibody titers further allows to determine the quality of the vaccine application method, and the field challenges caused by pathogenic agents. Furthermore, monitoring can be used to determine the relationships between antibody titers and production parameters (Salle et al., 2020).
The immune response and antibody curves were dynamic (TECSA, 2024). Many variables may interfere with the immunological response, including the prevalence of the disease, intercurrent immunosuppressive diseases, presence of maternal antibodies, local variant strains, genetic lineage of the animals, the environment where the birds are raised, and the quality of labor (Salle et al., 2020). Furthermore, ELISA kits from different manufacturers may vary in terms of their specificity and/or sensitivity, resulting in conflicting titer profiles that must be considered when interpreting the results and supporting decision-making (Liebhart et al., 2023). As such, vaccination programs should be specific to each company, with respect to the characteristics of each region (Salle et al., 1999; Salle et al., 2020).
Differentiating between vaccine and pathogen challenge response antibodies is difficult, regardless of the clinical history of the flock. Currently, the interpretation criteria are subjective, and based only on the veterinarian’s experience (Salle et al., 2020). As such, it is not possible to determine the expected immunological response in animals using traditional methods. Furthermore, serological tests detect only one immunoglobulin type, and may underestimate others; particularly immunoglobulin A, which is important for local immunity against viruses that penetrate the respiratory and intestinal tracts (Abbas et al., 2021).
Data from serological monitoring carried out using ELISA for seven poultry diseases generated 166 linear and non-linear regression equations (Supplementary Material). Of these models, only 1.2% had an R² ≥ 0.8 and more than 25 collections. Two models with these characteristics were obtained, both for the AE in breeder flocks (Tables 1 and 2).
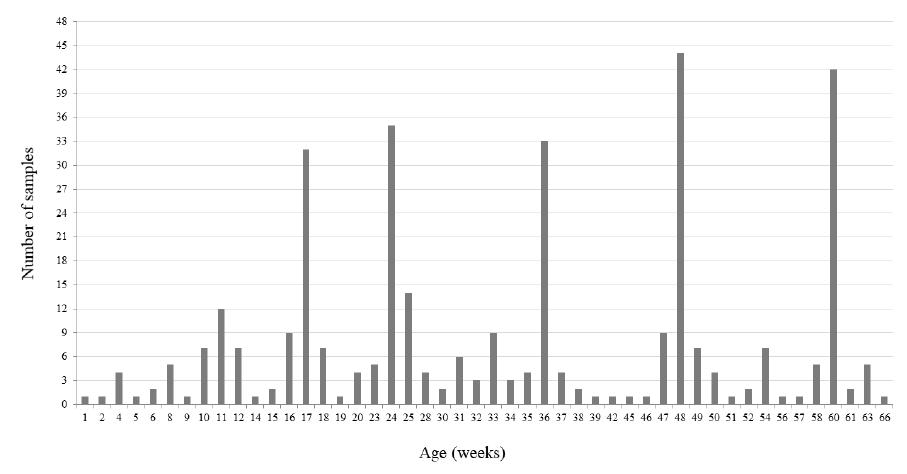
The low number of suitable models obtained in this study may be related to the lack of standardization of the sample collection. There are currently no criteria establishing a specific age for birds, and sampling for monitoring is generally performed simultaneously with sampling for diagnosis. For example, Figure 1 presents the number of serum samples collections for serological monitoring of flocks vaccinated against avian metapneumovirus in one of the poultry companies evaluated in this study, sorted by bird age.
Number of serum collections for serological monitoring of vaccination against avian metapneumovirus in one of the poultry companies evaluated in the study sorted by bird age.
In all cases, samples were collected at different ages in flocks with the same vaccination schedule, regardless of the disease and company evaluated. The lack of any standardization is reflected in the quality of the regression models generated for this poultry company (Table 3).
The lack of standardization in the collection and interpretation of results is reflected in the higher cost of monitoring. It is worth noting that, depending on the target disease, monitoring may not be necessary until the end of the flock life, which must be considered when organizing collection protocols. According to the guidelines of the Brazilian Ministry of Agriculture and Livestock, breeder sampling collections for specific diseases, such as salmonellosis, can be performed in the middle of the rearing phase, at the beginning of egg production, and every three months thereafter (Brazil, 2016). However, for other protocols, the periodicity of collections may vary between once a month and every six weeks during the egg production phase (Herdt et al., 2000). The costs of this monitoring include carrying out serological tests, the time spent on collection, possible zootechnical losses due to collection process, and the cost of logistics, packaging, and shipping of samples (Salle et al., 2020).
Some procedures or errors related to sample collection are practical errors that can hinder the careful evaluation of results, such as successive thawing and freezing of samples, and the transfer of hemolyzed or contaminated samples (Jacobson, 1998; Newberry & Colling, 2021). Furthermore, a representative collection of the flock must be obtained, ensuring that a minimum number of 20 samples are collected, and that birds are selected randomly (Swets, 1988; Jacobson, 1998; Koerich, 2009); even though this error is less frequent in poultry farming. Serological monitoring is essential to guarantee the health of batches, but protocols must comply with this goal clearly and objectively, leaving no room for inconclusive interpretations (Silva, 2000).
The coefficient of variation (CV) is one of the parameters used to evaluate the quality of the immune response to vaccination. This CV measures the uniformity of detected antibody titers, and is an indication of the effectiveness of a vaccination program. In general, CVs that are lower than 30% indicate good uniformity of immunization (TECSA, 2024). In the current study, 92.17% (153/166) of the equations presented CV within these values, regardless of the monitored disease. The uneven CVs observed may be caused by the incompetence of vaccinators, the presence of illnesses that could affect the immune system, infections caused by the field virus before vaccination, among other factors (Salle et al., 2020). CV was related to the antibody titers obtained. In general, titers above 1000, associated with a low CV, indicate good vaccination (TECSA, 2024).
The R² value represents the amount of variation in the result explained by the model in relation to the total amount of variation, or how much of the variation in the result could be predicted by the model. The closer the value is to 1, the greater the predictive capacity of the model. The selection of models with an R2 ≥ 0.8 was established in the current study (Salle et al., 2003). However, a high value of R2 does not necessarily indicate that the equation adequately predicts the results. This parameter is influenced by the fit of the regression line to the collected data, and mainly by the distribution and number of data points (Pennstate, 2023).
Other measures, such as the mean, mode, and median, also have disadvantages. These can be strongly influenced by extreme values, as well as the need to eliminate some of the collected data (Field, 2021). Nevertheless, the mean was used in the ELISA kit manufacturers’ own software to minimize the difficulty in understanding the results of serological monitoring. To better generalize the models, a minimum of 25 collections were conducted per company (Pennstate, 2023). Models were considered generalizable only if the data represented the population from which they were sampled. Furthermore, the small sample size of the serum collection had a greater impact on the accuracy of the model than obtaining a lower R² (Field, 2021).
CONCLUSION
Serological monitoring data allowed for the creation of 166 regression equations for the seven poultry diseases analyzed in this study. Serological monitoring of breeders and commercial laying hen flocks can be performed using mathematical models. However, the lack of standardization of sample collections may have had a negative impact on the number of models with desirable characteristics that were obtained.
REFERENCES
- Abbas AK, Lichtman AH, Pillai S. Cellular and molecular immunology. 10th ed. Elsevier: Amsterdam; 2021, 600 p.
-
Almeida LGB, Oliveira EB, FurianTQ, et al. Artificial neural networks on eggs production data management. Acta Scientiae Veterinariae 2020;48:1-7. https://doi.org/10.22456/1679-9216.101462
» https://doi.org/10.22456/1679-9216.101462 -
Brasil. Ministério da Agricultura e Pecuária. Instrução Normativa no 57, de 11 de dezembro de 2013. Estabelece os critérios e requisitos para o credenciamento e monitoramento de laboratórios pelo MAPA. Brasília; 2012 [cited 2023 Aug 10]. Available from: https://www.gov.br/agricultura/pt-br/assuntos/lfda/arquivos
» https://www.gov.br/agricultura/pt-br/assuntos/lfda/arquivos -
Brasil. Ministério da Agricultura e Pecuária. Instrução Normativa no 20, de 21 de outubro de 2016. Estabelece o controle e o monitoramento de Salmonella spp. nos estabelecimentos avícolas comerciais de frangos e perus de corte e nos estabelecimentos de abate de frangos, galinhas, perus de corte e reprodução, registrados no Serviço de InspeçãoFederal (SIF). Brasília; 2016 [cited 2023 Aug 30]. Available from: https://www.gov.br/agricultura/pt-br/assuntos/inspecao/produtos-animal/controle-de-patogenos/arquivos-controle-de-patogenos/SalmonellaIN202016Salmonella.pdf/view
» https://www.gov.br/agricultura/pt-br/assuntos/inspecao/produtos-animal/controle-de-patogenos/arquivos-controle-de-patogenos/SalmonellaIN202016Salmonella.pdf/view -
Carvalho D, Moraes LB, Chitolina GZ, et al. Evaluation of thymic lymphocyte loss of broiler using Digital Analysis of the Lymphoid Depletion System (ADDL). Pesquisa Veterinária Brasileira 2016;36(7):652-6. https://doi.org/10.1590/S0100-736X2016000700016
» https://doi.org/10.1590/S0100-736X2016000700016 - Feigenbaum AV. Total quality control. 3rd ed. New York: McGraw-Hill; 1983, 863 p.
- Field A. Descobrindo a estatística usando o SPSS. 5th ed, Porto Alegre: Penso; 2021. 1104p.
-
FAO - Food and Agriculture Organization. The future of food safety. Roma; 2019 [cited 2023 Aug 15]. Available from: https://www.fao.org/3/ca8386en/CA8386EN.pdf2019
» https://www.fao.org/3/ca8386en/CA8386EN.pdf2019 -
Herdt PD, Ducatelle R, Uyttebroek E, et al. Significance of Infectious Bursal Disease serology in an integrated quality control program under european epidemiologic conditions. Avian Diseases 2000;44(3):611-7. https://doi.org/10.2307/1593100
» https://doi.org/10.2307/1593100 -
Jacobson RH. Validation of serological assays for diagnosis of infectious diseases. Revue Scientifique et Technique 1988;17(2):469-86. https://doi.org/10.20506/rst.17.2.1119
» https://doi.org/10.20506/rst.17.2.1119 - Kleinbaum DG, Kupper LL, Nizam A, et al. Applied regression analysis and other multivariable methods. 4th ed. Belmont: Duxberry Press; 2007. 928 p.
- Koerich PKV. Aves: guia de coleta e envio de materiais para diagnóstico laboratorial. 2nd ed. Xanxerê: News Print; 2009. 198 p.
-
Liebhart D, Bilic I, Grafl B, et al. Diagnosing infectious diseases in poultry requires a holistic approach:a review. Poultry 2023;2:252-80. https://doi.org/10.3390/poultry2020020
» https://doi.org/10.3390/poultry2020020 - Machado NP. Modelos de regressão polinomial-problemas e soluções [dissertation]. São Paulo (SP): Universidade de São Paulo; 2006 [cited 2024 Abr 04]. Available from: https://teses.usp.br/teses/disponiveis/45/45133/tde-20210729-145308/fr.php
- Makarewicz O, Stein C, Pfister W, et al. Identification methods - an pverview. In: Popp J, Bauer M. Modern techniques for pathogen detection. Hoboken: Wiley; 2015, p.19-53.
-
Moraes LB, Osório FS, Salle FO, et al. Evaluation of folicular lymphoid depletion in the Bursa of Fabricius:an alternative methodology using digital image analysis and artificial neural networks. Pesquisa Veterinária Brasileira 2010;30(4):340-4. https://doi.org/10.1590/S0100-736X2010000400010
» https://doi.org/10.1590/S0100-736X2010000400010 -
Newberry KM, Colling A. Quality standards and guidelines for test validation for infectious diseases in veterinary laboratories. Revue Scientifique et Technique 2021;40(1):227-37. https://doi.org/10.20506/rst.40.1.3220
» https://doi.org/10.20506/rst.40.1.3220 -
Oliveira, EB, Almeida, LGB, Rocha, DT, et al. Artificial neural networks to predict egg-production traits in commercial laying breeder hens. Brazilian Journal of Poultry Science 2021;24(4):1-10. https://doi.org/10.1590/1806-9061-2021-1578
» https://doi.org/10.1590/1806-9061-2021-1578 - PennState. STAT 462 - Applied regression analysis. University Park: Eberly College of Science; 2018 [cited 2023 Aug 18]. Available from: https://online.stat.psu.edu/stat462/node/98/
-
Priyanka B, Rajashekhar KP, Sulatha D. A review on detection methods used for foodborne pathogens. Indian Journal of Medical Research 2016;144:327-38. https://doi.org/10.4103%2F0971-5916.198677
» https://doi.org/10.4103%2F0971-5916.198677 - Reali EH. Utilização de inteligência artificial (redes neurais artificiais) no gerenciamento da produção de frangos de corte [dissertation]. Porto Alegre (RS): Universidade Federal do Rio Grande do Sul; 2004 [cited 2022 Jun 06]. Available from: https://lume.ufrgs.br/handle/10183/6339
-
TECSA. Interpretação de resultados sorológicos através da metologia ELISA. Anais da Jornada de Conhecimento TECSA; 2024 [cited 2024 Mar 25]. Available from: https://www.tecsa.com.br/assets/pdfs/INTERPRETACAO%20DE%20RESULTADOS%20SOROLOGICOS%20ELISA%20EM%20AVICULTURA%281%29.pdf
» https://www.tecsa.com.br/assets/pdfs/INTERPRETACAO%20DE%20RESULTADOS%20SOROLOGICOS%20ELISA%20EM%20AVICULTURA%281%29.pdf - Rocha ACGP. Utilização de inteligência artificial para a classificação de patogenicidade de amostras de Escherichia coli isoladas de frangos de corte [thesis]. Porto Alegre (RS): Universidade Federal do Rio Grande do Sul; 2006 [cited 2022 jun 06]. Available from: https://lume.ufrgs.br/handle/10183/17363
- Salle CTP, Cé MC, Santos CHC, et al. Use of statistical technique on the interpretation of routine serologic data produced by poultry industry. Proceedings of 4th Asia-Pacific Poultry Health Conference; 1998. Melbourne, Australia; 1998.
-
Salle CTP, Cé MC, Wald VB, et al. Estabelecimento de critérios de interpretação de resultados sorológicos de matrizes de corte através de modelos matemáticos. Brazilian Poultry of Science 1999;1:61-5. http://doi.org/10.13140/2.1.1183.5847
» http://doi.org/10.13140/2.1.1183.5847 -
Salle CTP, Guahyba AS, Wald VB, et al. Use of artificial neural networks to estimate production parameters of broiler breeders in the breeding phase. British Poultry Science 2003;44:211-7. https://doi.org/10.1590/S1516-635X2001000300008
» https://doi.org/10.1590/S1516-635X2001000300008 - Salle FO. Utilização de inteligência artificial (redes neurais artificiais) no gerenciamento do incubatório de uma empresa avícola do sul do Brasil [dissertation]. Porto Algre (RS): Universidade Federal do Rio Grande do Sul; 2005 [cited 2022 Jun 06]. Available from: https://lume.ufrgs.br/handle/10183/5923
-
Salle CTP, Spohr A, Furian TQ, et al. Inteligência artificial: o futuro da produção avícola. Avicultura Industrial 2018;7:38-42. Available from: https://www.agrimidia.com.br/agronegocio/inteligencia-artificial-o-futuro-da-producao-avicola/
» https://www.agrimidia.com.br/agronegocio/inteligencia-artificial-o-futuro-da-producao-avicola - Salle CTP, Moraes HLS, Furian TQ, et al. Manejo profilático, prevenção de doenças e monitorização. In: Andreatti Filho RL, Bercheri Junior A, Silva EM, et al. Doenças das aves. 3rd ed. Campinas: FACTA; 2020. p.3-22.
- Silva, AB. Prevenção de doenças, manejo profilático, monitoração. In: Berchielli Júnior A, Macari M. Doença das aves. Campinas: FACTA; 2000.
- Spohr A. Gerenciamento através de redes neurais artificiais das atividades de produção de reprodutoras pesadas e de frangos de corte, de um incubatório e de um abatedouro avícola [dissertation]. ]. Porto Alegre (RS): Universidade Federal do Rio Grande do Sul; 2011 [cited 2022 Jun 06]. Available from: https://lume.ufrgs.br/handle/10183/36860
-
Swets JA. Measuring the accuracy of diagnostic systems. Science 1988;240(4857):1285-93. https://doi.org/10.1126/science.3287615
» https://doi.org/10.1126/science.3287615 -
Tedeschi LO. Mathematical modeling in ruminant nutrition:approaches and paradigms, extant models, and thoughts for upcoming predictive analytics. Journal of Animal Science 2019;97:1921-44. https://doi.org/10.1093/jas/skz092
» https://doi.org/10.1093/jas/skz092
-
FUNDING
None.
-
DATA AVAILABILITY STATEMENT
Data will be available upon request.
-
DISCLAIMER/PUBLISHER’S NOTE
The published papers’ statements, opinions, and data are those of the individual author(s) and contributor(s). The editor(s) disclaim responsibility for any injury to people or property resulting from any ideas, methods, instructions, or products referred to in the content.
APPENDIX
Supplementary material will be available upon request.
Data will be available upon request.