 Invariance measurement of Perfectionism among Brazil and Argentina undergraduate students
Abstract
This study aimed to investigate the cross-cultural invariance of perfectionism between Brazilian and Argentinian cultures, using the Almost Perfect Scale-Revised (APS-R). A series of multi-group exploratory structural equation modeling models were used to test configural, metric, and scalar measurement invariance. The total sample comprised 1589 undergraduate students, 835 Brazilians, and 754 Argentinians, mean age=25.03 (SD=6.58 years). Multi-group analyses revealed that configural and metric measurement invariance were achieved. Partial scalar invariance was found after constraints on the thresholds of items 2 and 10 were released. Minor differences were found in the high standards and order dimensions, although results should be interpreted cautiously due to non-invariance. Overall, the results suggest that the APS-R is mostly comparable between Brazilians and Argentinians. Possible differences in non-invariance specific to some of the scale items, and implications for cross-cultural research of perfectionism are discussed.
Keywords:
Perfectionism; validity; Cross-cultural; Undergraduate students; Latin-America
Resumo
O presente estudo investigou a invariância cultural do perfeccionismo entre a cultura brasileira e argentina usando a Almost Perfect Scale-Revised (APS-R). Uma série de análises com modelagem por equações estruturais exploratórias multigrupo foi realizada para testar a invariância configural, métrica e escalar. A amostra possuía 1589 estudantes de graduação, 835 brasileiros e 754 argentinos, idade média de 25,03 (DP=6,58) anos. As análises multigrupo indicaram que a invariância configural e métrica foram encontradas. Após a liberação dos limiares de resposta dos itens 2 e 10, foi encontrada invariância escalar parcial. Pequenas diferenças foram encontradas nas dimensões de ordem e padrões, entretanto, os resultados devem ser interpretados com cautela devido à invariância parcial. No geral, os resultados sugerem que a APS-R é comparável entre os países. São discutidas possíveis diferenças para a não invariância dos itens da escala, e implicações para a investigação transcultural do perfeccionismo.
Palavras-chave:
perfeccionismo; validade; transcultural; estudantes de graduação; américa latina
Resumen
Este estudio investigó la invarianza transcultural del perfeccionismo entre las culturas brasileña y argentina, utilizando la Almost Perfect Scale-Revised (APS-R). Se utilizó una serie de modelos exploratorios de ecuaciones estructurales multigrupo para probar la invarianza configural, métrica y escalar de la medida. La muestra total comprendió 1589 estudiantes universitarios, 835 brasileños y 754 argentinos, promedio de edad de 25,03 (DP=6,58) años. Los análisis multigrupos revelaron invarianza configural y métrica. Se encontró invarianza escalar parcial liberando las restricciones en los umbrales de los ítems 2 y 10. Se encontraron diferencias menores en las dimensiones de orden y estándares, aunque los resultados deben interpretarse con cautela debido a la invarianza parcial. En general, los resultados sugieren que la APS-R es mayormente comparable entre brasileños y argentinos. Se discuten las posibles diferencias en la no invarianza de los ítems de la escala, y las implicaciones para la investigación transcultural del perfeccionismo.
Palabras clave:
Perfeccionismo; validez; Transcultural; Estudiantes universitarios; Latinoamérica
Introduction
In the last 30 years, perfectionism has been the subject of broader empirical and conceptual investigations (Flett & Hewitt, 2020). Current definitions of this personality trait encompass its multidimensional aspects and association with both adaptive and maladaptive outcomes (Flett & Hewitt, 2020; Smith et al., 2022). Regarding its multidimensionality, the first theoretical models of perfectionism, which emerged between 1990 and 2000, emphasized different components (Smith et al., 2022). For example, the model proposed by Hewitt and Flett (1991) assumed that high personal standards and excessive perfectionist self-criticism could be directed at the self (self-oriented perfectionism), directed at others (other-oriented perfectionism) or associated with the individual’s belief in the existence of expectations and demands directed at the self, but coming from others (socially prescribed perfectionism). On the other hand, the Frost et al. (1990) model proposed six main aspects to be assessed: personal standards, doubts about actions, concern about mistakes, organization, criticism, and parental expectations. These last two are important elements for understanding developmental aspects of perfectionism. Slaney et al. (2001), in turn, proposed a model that included both personal standards and order/organization, present in Frost et al.’s (1990) proposal, and a dimension they called discrepancy, which would be associated with self-criticism related to not reaching these expectations or standards. All three models were accompanied by instruments to operationalize the construct. Subsequently, these models were refined, and more complex proposals emerged (for a review see Smith et al. 2022). The focus of our study will be on the Almost Perfect Scale (APS-R). This scale has 23 items and measures the three dimensions of the theoretical model proposed by Slaney et al. (2001), namely: standards, order, and discrepancy.
Although models vary with regard to the most central dimensions, there seems to be general agreement that perfectionism seems to be a result of a combination of establishing excessively high standards of performance (the so-called perfectionistic strivings) and the high levels of concerns about one’s adequacy in reaching those standards (the so-called perfectionistic concerns) (Flett & Hewitt, 2020; K. G. Rice et al., 2014; Stoeber et al., 2020; Stoeber & Otto, 2006). Perfectionism has been a hot topic in clinical and health psychology, mostly because of its transdiagnostic and public health implications (Flett & Hewitt, 2020; Smith et al., 2022). Perfectionism has also been linked to a variety of outcomes, such as educational (Madigan, 2019), sports (Hill et al., 2018), career development (Gnilka & Novakovic, 2017), clinical, therapeutical (Miller et al., 2017) and mental health outcomes (Ayearst et al., 2012).
Research into perfectionism has come a long way in the last decade, opening new possibilities for investigation. Understanding how perfectionism is expressed in different cultures and the relationships it establishes with different life outcomes in each environment is a field that has received attention from researchers in the area and, as a result, some cross-cultural studies have been carried out (Smith et al., 2022). For example, Chang et al. (2012) present evidence that self-criticism seems to be more common in Eastern cultures than in Western ones, although for both, high levels of self-criticism were associated with depressive symptoms. This result confirms what Hamamura and Heine (2008) had already pointed out, namely that perceptions of the self and the self as “good” vary between Western and Eastern cultures, and that in Asian cultures self-criticism seems to be associated with a view of the self as positive and therefore desirable. On one hand, Pietrabissa et al. (2020) point to higher levels of self-oriented perfectionism for European countries (e.g. Belgium, Spain, Italy), the USA, Canada, and Australia, when compared to Asian countries such as Japan and China. On the other hand, higher averages of socially prescribed perfectionism were observed for the Japanese when compared to participants from other Western countries and Australia, but not for the Chinese. It is important to emphasize that this study was carried out with adults from the general population and university students, and that the sample primarily consisted of female and undergraduate students.
However, as highlighted by Rice et al. (2019, p. 385), “much of the earlier conceptual and scale development work in the area of perfectionism was based on samples in Canada and the United States”. Also, Rice et al. (2019) asserts that the study of perfectionism has been strongly influenced by the English language and the presentation of perfectionism and its nomological network in developed Western and rich countries. When an instrument is created for a specific culture and language and is then adapted to others, it cannot be assumed that the two or more versions of this scale are equivalent (Chen, 2008; Hambleton & Kanjee, 1995). Evidence of cross-cultural invariance could be considered a prerequisite for establishing the equivalence of an instrument in different cultures or languages (Putnick & Bornstein, 2016). This concern regarding equivalent measures is also extended to the comparability of the adapted versions of a scale. Furthermore, Curran and Hill (2019) suggest that many cultural aspects, such as neoliberal and meritocratic ideas, can influence the development and presentation of perfectionism. Although Curran and Hill (2019) based their analysis only on rich, developed, and industrialized countries, they emphasize the importance of cultural values and practices, at their macro and micro levels, for a deep understanding of the manifestation of perfectionism in each society.
As mentioned in the previous paragraph, most studies aiming to identify APS-R invariance include only samples from Western, educated, industrialized, rich, and democratic (WEIRD) or developed countries, even if they are non-Western (for example, Rice et al., 2019; Rice et al., 2020; Spagnoli et al., 2022) or compare invariance between a sample from a developed country and another from a country considered to be developing, as is the case of Arana et al. (2018), Coelho et al. (2020), and Richardson and Datu (2020), including Brazilian and Argentinian samples. Results of all these studies point to, at least, full configural invariance (the two versions of a scale have the same pattern of relationship between items and latent dimensions in different countries) between all pairs of countries compared. However, in none of the studies were the three levels of invariance (configural, metric, and scalar) fully identified, indicating differences in item factor loadings between the compared samples or differences in item thresholds (item endorsement for different levels of perfectionism is not the same between the two countries). The studies by Arana et al. (2018), Coelho et al. (2020), Rice et al. (2019), and Rice et al. (2020) report partial scalar invariance. All these studies were performed comparing other countries with US samples.
To our knowledge, no study comparing APS-R measurement invariance has been performed with samples from two developing countries, both of which are non-English speakers. According to the definition and data from (International Monetary Fund, 2022), Argentina and Brazil are considered developing countries due to their low economic performance and extreme social inequalities. Furthermore, both countries occupy poor positions in the world ranking of perceptions of corruption (96th position, which is equivalent to a score of 38 out of 100 for both countries), according to data from (Transparency International, 2021). A corrupt and unequal environment may affect the presentation of perfectionism, in which individuals may be less encouraged to seek high-performance standards or develop the belief that no matter how much effort they put in, it will never be enough to achieve success or high personal goals.
Despite the similarities pointed out above, Argentina and Brazil have differences that may contribute to the total non-invariance of the APS-R, especially at the scalar level, for the sample of the present study, namely college students. Furthermore, the difference in the spoken language (Portuguese-speaking Brazil and Spanish-speaking Argentina) may affect the invariance of the scale, considering the peculiarities in the process of translation and adaptation of the instrument, initially developed in English, which may be different between Spanish and Portuguese.
In addition, the educational system and access to higher education are quite different across countries. In Brazil, most places available for higher education are private universities, while public universities offer the highest quality education (Ministério da Educação do Brasil, 2022). Few vacancies in public universities in a country with vast social inequality make the system extremely competitive. Also, the criterion for access to public universities is the grade in the National High School Exam, in which students from all over the country compete for places in the best universities by obtaining the highest grades (Ministério da Educação do Brasil, 2022). For some courses, such as medicine, dentistry, and computer science, the cut-off grades are incredibly high, which makes access even more complex and disputed (Ministério da Educação do Brasil, 2022).
On the other hand, most universities in Argentina are run by provincial or national states. Students do not pay for tuition, and admittance is free for all who have completed secondary studies. Therefore, access to top-class universities (e.g., Universidad de Buenos Aires) is independent of passing a national exam, obtaining a specific score, or graduating from secondary studies with high grades (Ministerio de Educación y Justicia de la Nación Argentina, 2023). Since the global average achieved in secondary education does not impact university admission, Argentine students feel free to achieve compared to Brazilian students. Hence, most Argentinian students are confident in being admitted to the university and staying there until graduation. Also, Brazil and Argentina are huge countries, but Argentina’s population is highly concentrated in a few cities, making access to university relatively easy; most students do not need to migrate to other cities to pursue a university degree. Considering that college students make up the samples of this study, the factors mentioned above may affect the results of the invariance of the perfectionism measure.
In this sense, the present study aims to contribute to the discussions about the presentation and dimensionality of perfectionism and the cross-cultural validity of their measures by comparing two non-English speaking and non-WEIRD countries. The Argentinean-Spanish and Brazilian-Portuguese of APS-R were compared in terms of structural, metric, and scalar invariance. In addition to traditional techniques (i.e., confirmatory factor analysis), we employed exploratory structural equation modelling (ESEM) models. Compared with Confirmatory Factor Analysis (CFA), ESEM enables item cross-loadings to be modeled and is recommended for personality data (Booth & Hughes, 2014; Soares et al., 2020). Consequently, the ESEM models will show better adjustment for the data than the traditional methods (CFA). Furthermore, considering the other results of other studies already carried out with the APS-R and the elements exposed in the previous paragraphs about the similarities and differences between Brazil and Argentina, we expect that the analyses will support at least configurable and metric invariance. In addition, possible endorsement differences (i.e., threshold non-invariance) will be investigated in terms of item meaning or construct manifestation.
Methods
Participants
The overall sample was composed of 1,589 participants (834 Brazilians and 751 Argentinians), with mean age of 25.03 (standard deviation [SD]=6.58 years). Considering the data collection, this was a convenience sample, and participants were assessed in a non-probabilistic manner. The Brazilian sample included undergraduate students from six private and state-run universities, the majority (91.9%) were psychology undergraduate students. Most participants were female (78.89% [n=654] vs. 21.11% [n=175] males, and 0.7% [n=6] who chose not to report their sex). The mean age was 24.62 years (SD=6.97), ranging from 17 to 60 years. All students were fluent in Portuguese. The Argentinian sample included undergraduate students at the Universidad de Buenos Aires, an institution run by the state of Argentina. In the Argentinian sample, all participants were psychology undergraduate students. All participants disclosed their sex, and the majority of the participants were female (70.8% [n=532] vs. 29.2% [n=219] males). The mean age was 25.48 years (SD=6.09), ranging from 18 to 63 years. Most participants were Argentinian (97.1%; n=732) and all students were fluent in Spanish. There were small but significant differences in age [t(1581.60)=2.60, p=.009 d=0.13] and sex [χ2(1)=13.12, p<.001, φ=.09] between the two countries.
Instruments
The Argentinian-Spanish (Arana et al., 2009) and Brazilian-Portuguese (Soares et al., 2020) versions of the Almost Perfect Scale-Revised (APS-R) (Slaney et al., 2001) were used in this study. Both versions include the original dimensions of the scale, with 23 items: HS, D, and O. Responses are presented on a Likert-type scale ranging from 1 (strongly disagree) to 7 (strongly agree). The HS (7 items) dimension encompasses strivings to achieve high standards of performance, an example of item content is “I have high standards for my performance at work or at school”. The D dimension (12 items) captures the differences between self-imposed high standards and self-evaluation of achievement, an example of item content is “I often feel frustrated because I can’t meet my goals”. The O dimension (four items) relies on preference for organization and order, an example of item content is “I am an orderly person”.
The scale was adapted for both the Argentinian and Brazilian samples. The Cronbach’s alpha coefficients for the Argentinian version were .75 (HS), .91 (D) and .74 (O) (Arana et al., 2009). For the Brazilian version, the reliability coefficients were .74 (HS), .91 (D), and .74 (O) (Soares et al., 2020). Table S1 in the supplementary information presents the original, Brazilian, and Argentinian versions of the APS-R items. Both scales reproduced adequate solutions for the three dimensions. Cronbach’s alpha coefficients were very similar in both countries.
Procedures
The procedures adopted for data collection were similar in both countries. In both Brazil and Argentina, the research was approved by the local ethical committees, and researchers followed the ethical principles of the Declaration of Helsinki regarding human experimentation. All participants signed an informed consent form containing relevant information on the research project. They also granted permission to store and process their data for further study. Perfectionism was assessed in person during the class. The participants took approximately 40 min to complete the scales and provide the requested information. All participants voluntarily participated in this study. Data were collected from 2008 to 2015 in Argentina and from 2016 to 2018 in Brazil.
Data from both countries were analyzed in the present study. All information needed, such as sex, age, and perfectionism scores, was then grouped by country. For Brazil, missing data were previously treated (Soares et al., 2020) and there were no missing cases in the present study. In Soares et al. (2020), missing cases were replaced with participants’ mean; thus, to maintain consistency, 31 Argentinian participants who skipped questions had their data replaced with their respective mean. These missing data were random [Little’s MCAR test χ2(415)=399 p=.701].
Data analysis
We investigated the APS-R latent structure using both ESEM (Asparouhov & Muthén, 2009) and confirmatory factor analysis (CFA). A CFA model assumes that items have factor loadings only in their theoretical dimensions (i.e., the independent cluster model). The ESEM model, however, is less restrictive and allows latent traits to load on non-target observable indicators. All models were calculated using APS-R items, assuming them to be an ordinal level of measurement; hence, the weighted least squares means and variance adjusted (WLSMV) was used as the estimator. For the ESEM models, we relied on a Target rotation, and non-target factor loadings were set as close to zero as possible (Marsh et al., 2014). We fitted models using the three-factor structure proposed for the APS-R in the overall sample, the Brazilian sample, and the Argentine sample. We then calculated the reliability of each factor for each solution. Model implied reliabilities using the polychoric correlation matrix (Green & Yang, 2009) were assessed using two indicators: McDonald’s ω and Cronbach’s α. The adequacy of these models was evaluated using common cutoff criteria for fit indices. Values for the comparative fit index (CFI) and Tucker-Lewis index (TLI) should be higher than .90, preferably .95. The root mean square of error approximation (RMSEA) and standardized root mean square residuals (SRMR) values should be lower than .08, or preferably .06 (Kline, 2015). The values of the chi-squared (χ2) difference test were considered with caution, since p-values always tend to be significant for large samples. The best-fitting approach (CFA or ESEM) was used in the subsequent analyses.
The invariance between the two cultures was tested in a hierarchical and sequential manner, starting with the least restrictive model and subsequently adding constraints to the most restrictive model. Specifically, three levels of invariance were investigated: configural (where the factorial organization is the same), metric (factor loadings are set to be equal), and scalar (item thresholds are set to be the same; Putnick & Bornstein, 2016). The differences between the nested models were tested using the χ2 test for robust estimators (ΔCFI and ΔRMSEA). The χ2 difference test should not be significant (although the same concerns regarding model fit are applied), ΔCFI should not decrease more than .01, and ΔRMSEA should not increase above .015 (Chen, 2007). Because full invariance is rarely achieved (Putnick & Bornstein, 2016), when our model comparisons indicated non-invariance in a step, partial invariance was tested. The constraints were released according to the high modification indices. This procedure was terminated when an equivalent fit was achieved. Factorial analyses were conducted using R (4.1.0) and the lavaan (Rosseel, 2012) and the semTools (Jorgensen et al., 2022) packages.
Finally, we compared the means of the APS-R dimensions between Argentina and Brazil, using a series of hierarchical regression models. In these analyses, the first step included age and sex and the second step included the country of the participants. The APS-R scores were the dependent variables. The models were checked for outliers, residual normality and additivity. For outlier exclusion, we adopted a multicriteria analysis of the Mahalanobis distance, leverage, and Cook’s distance. Participants who met two or more of these criteria were excluded. For additivity/multicollinearity, we calculated the variance inflation factor (VIF) and the tolerance (TOL). VIF values<5 and TOL higher than .20 were considered acceptable (James et al., 2021). To deal with residual non-normality, we adopted a bootstrap approach (2500 resampling). For these analyses, we used the emmeans (Lenth, 2021) and boot (Canty & Ripley, 2021) R packages.
Results
The fit indices for all models tested are presented in Table 1. The ESEM models presented a better fit for the three-factor solution than the CFA models. Therefore, we conducted the following analyses using the ESEM results: For the whole sample and the Brazilian subsample, a poor-to-moderate fit was observed, with high RMSEA values. By contrast, for the Argentinian subsample, the fit was acceptable. Factor loadings for Models 4, 5, and 6 (see Table 1) are presented in Table S2 in the supplemental material. The average factor loadings for the target items ranged from moderate to high, with values ranging from .54 to .72. Reliability was estimated using the fitted model in the final step of invariance testing. Internal consistency values were generally deemed acceptable for all dimensions, and the specific values are provided in Table S2.
We compared the independent sample correlations according to model implied correlation matrices. Using r to z tests, there was a significant difference in the correlation pattern between O and HS (.42 in Brazil, .33 in Argentina) and HS and D (.31 in Brazil, .13 in Argentina) across countries (p=.032 and p<.001, respectively). Corrected p-values using the Holm-Bonferroni procedure suggested that only the correlation between HS and D was still significantly different (p<.001).
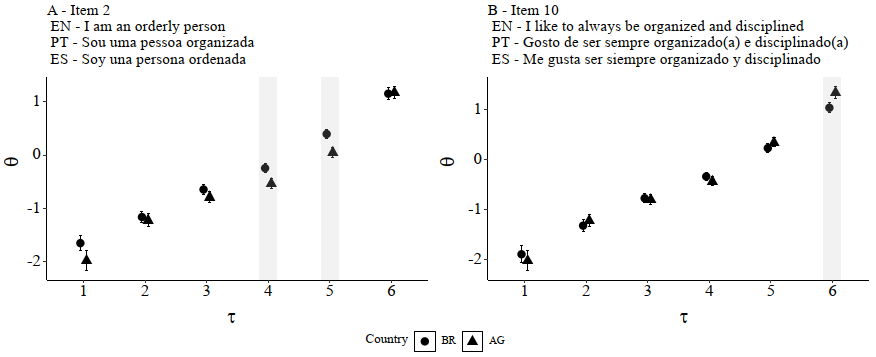
The results of the model fit for the multi-group analysis are shown in Table 1. It should be noted that the χ2 difference test was significant for all models at p<.001, indicating that the invariance assumption was not supported. However, as χ2 statistics tend to be oversensitive in large samples (Hair et al., 2014), we proceeded to analyze other fit indices. The first step (Model 7; see Table 1) was the least restrictive, testing configural invariance. Analysis of the CFI, TLI, and RMSEA values suggests that this model supports configural invariance and is arguably better than the fit for Models (4) and (5) (overall and Brazil, respectively). Model (8) constrained the factorial loadings to be the same across countries. Following the same pattern, the fit improved marginally in Model (8) when compared with that of Model (7), with a smaller RMSEA. Scalar invariance (equal item thresholds) was tested in Model (9), but it was not supported, ΔCFI=-.015. Because full scalar invariance was not achieved, we proceeded to investigate partial invariance. Based on the modification indices, we released the constraints for the thresholds of Item 2 (Model 10). This procedure resulted in a better fit compared to Models 10 to 9, but it did not support invariance when compared to Model 8 (metric invariance). We then released the thresholds for Item 10 (Model 11). Comparing the fit indices of Model 10 with Model 8, it could be argued that partial invariance was achieved, ΔCFI=-.004 and ΔRMSEA=-.004.
To comprehensively investigate possible differences between Items 2 (I am an orderly person-order) and 10 (I like to always be organized and disciplined. order), we examined the estimated threshold values for these items (see Figure 1). Threshold values suggest that Argentinians needed less order to endorse Item 2 (specifically for the fourth and fifth thresholds). On the other hand, Brazilians needed less order to endorse Item 10 (in the sixth threshold).

Finally, to compare the mean levels of perfectionism across the two countries, regression results were considered. Table 2 lists all coefficients. The final step for all the models was significant. In the first step, sex and age had a small association with APS-R scores (R 2 ranging from .000 in the HS and D models to .015 in the O model). Controlling for those covariates, there were significant mean differences only in the HS and O dimensions; however, Cohen’s d suggested small effects, -0.26 and 0.21, respectively. Brazillians showed lower HS scores and higher O scores than Argentinians. However, the results for O should be interpreted with caution due to the non-invariance of half of these dimension items.
Discussion
In the last few years, there has been a call for investigating the structure and generalizability of perfectionism in more diverse populations (Smith et al., 2022). Specifically for the APS-R, most studies, however, either focused on comparing only WEIRD countries (Rice et al., 2019; Rice et al., 2020; Spagnoli et al., 2022) or compared non-WEIRD with WEIRD nations (Arana et al., 2018; Coelho et al., 2020; Richardson & Datu, 2020). To our knowledge, no other study has attempted to compare the invariance of a perfectionism scale between two non-English-speaking, South American and non-WEIRD countries. Our study was designed to investigate the equivalence of the APS-R using Brazilian and Argentine versions. Latin American Spanish and Brazilian-Portuguese scales were compared for configural, metric, and scalar/threshold invariance.
Employing an analytical strategy that accounts for cross-loadings (e.g., ESEM), the results point to full configural and metric invariance between the Brazilian and Argentine APR-R versions. This type of analysis seems to be beneficial for perfectionism scales (Richardson & Datu, 2020; Soares et al., 2020). Nevertheless, full scalar invariance was not achieved, and this was in line with other studies exploring the cross-cultural invariance of the APS-R (Arana et al., 2018; Coelho et al., 2020; Rice et al., 2019; Rice et al., 2020; Richardson & Datu, 2020; Spagnoli et al., 2022). Partial scalar invariance was supported for two APS-R dimensions (High Standards and Discrepancy), but the findings regarding O were questionable. For half of the O items (Items 2 and 10), the results point to different threshold values between the two countries. These results suggest that the endorsement patterns for some of the O items were different for Brazilians and Argentinians. Some explanatory hypotheses can be raised.
First, the reliability coefficient of O was the lowest compared with the other two perfectionism dimensions (HS and D). In the Argentinian sample, the alpha estimate for the O dimension was not acceptable. This could indicate that the O scale is less consistent and stable than the other two dimensions or that the number of items in the O scale may not be sufficient to represent the complexity of the construct. Second, inconsistencies could emerge because of differences in the translations. As noted by the International Test Commission (ITC, 2017), throughout cultural adaptation, all terms in one culture should be equivalent to those in another culture. Although there might be comparable ideas regarding a construct in different cultural contexts, deficiencies in finding proper words could lead to differences conveyed by items attempting to measure the construct. Even in rigorous adaptation processes, as was the case in both countries, there may still be room for adjustments in some items. It is also important to note that the O items were developed to capture the expression of the trait in English speakers. The translations and adaptations made from the original English to Spanish and Brazilian Portuguese may have missed important manifestations of the construct in the latter two languages. In such cases, a solution would be to construct items that could capture idiomatic subtleties in the behavioral representation of the construct for comparison with the adapted version of the scale.
Regarding the partial scalar invariance between the two countries, the general tendency to endorse items regardless of their content (i.e., acquiescence Rammstedt et al., 2013) should also be emphasized. Acquiescence could be understood under the generic term response bias and is generally found in self-reports of personality questionnaires (Rammstedt et al., 2013). The lack of control over acquiescent responses may change the latent structure of a questionnaire and impair the comparability of constructs between cultures (Rammstedt et al., 2013). Rammstedt et al. (2013) compared the structure of a questionnaire based on a five-factor model (i.e., the Big Five personality factors) in adults from 18 countries. Their results suggest that correcting for acquiescence improves congruence between theoretical dimensional structures across countries (Rammstedt et al., 2013). However, in this study, we were not able to control acquiescence because the APS-R does not have negatively keyed items. Since the impact of acquiescence has been observed in both countries using big-five personality questionnaires (Zanon et al., 2018; Cupani et al., 2019), we suggest that future studies should try to correct for acquiescence in perfectionism cross-cultural comparisons. One relatively straightforward method for mitigating acquiescence is to incorporate negatively keyed items into the APS-R. Taking possible differences to endorse the Likert scales, the partial invariance found for Items 2 and 10 may be explained. To the best of our knowledge, no studies have compared differences in acquiescence between Argentinians and Brazilians, even though this general tendency is likely to vary among people with different socio-demographic characteristics (Rammstedt et al., 2013). Nevertheless, due to the translation of these items, their meanings might have been understood differently in the two versions of the APS-R presented in this study. An example of this can be found in the Turkish APS-R version, where items 3 and 16 loaded onto D along with items 15, 16, and 18, while other items from D loaded onto a third factor, dissatisfaction (Aydin, 2013). Nonetheless, besides acquiescence, other response biases, such as social desirability, could also explain the pattern of Likert ratings for some items. Consequently, response bias needs to be carefully studied further, as it may reflect cross-national comparisons.
We also compared the mean levels of perfectionism in the two countries. Comparisons of factor means revealed no substantial differences in D (perfectionistic concerns) between the two groups, but significant differences were found for HS and O. Brazilians had lower scores on HS and higher levels of O than Argentinian students. The results for O will not be interpreted because of the non-invariance of half of these dimension items. However, O is a controversial dimension of perfectionism. Several important scholars have argued that O is not a core component of perfectionism, but rather a correlate of perfectionism (Flett & Hewitt, 2020; Smith et al., 2021).
Contrary to what was expected, Argentinians showed higher scores in high standards (HS). Considering that the sample was composed of undergraduate students and the way of entering higher education in the two countries, one could have expected the opposite. However, data from the Ministry of Education of Argentina show that the graduation rate in the country is relatively lower than that of Brazil (Fundación Libertad, 2019). Thus, it can be understood that, even though the entrance process is relatively simpler, the university culture demands high performance from the students. Moreover, another fact that may assist in explaining the higher scores in Argentina may be related to a greater perception of equality, resulting in a perception that individual effort can yield greater results.
Despite there not being a consensus on the general pattern for mean differences between cross-cultural comparison studies, with some showing significant differences (Arana et al., 2018; Rice et al., 2020; Spagnoli et al., 2022) and others not (Coelho et al., 2020; Rice et al., 2019; Richardson & Datu, 2020), the overall results point towards higher means for participants from the US, regardless of dimension. One explanation commonly raised to explain differences in perfectionism is related to individualistic-collectivistic values. Using this approach, these differences might partially explain the differences found in HS between Brazilian and Argentinian students. On one hand, it seems that countries with higher levels of individualism tend to value and encourage high levels of performance and motivation for achievement and excellence, which would be directly associated with perfectionistic strivings (in our study, HS) (Arana et al., 2018). On the other hand, countries with cultures that are more collectivistic and strongly based on Christian values tend to perceive individualism as selfishness. In this sense, the pursuit of excellent results and individual success is morally disapproved and undesirable (Triandis, 2001). To illustrate, in the study conducted by Arana et al. (2018), Argentinians scored lower on HS than North Americans. The authors argued that Argentinians and Asians would be more collectivistic compared to North Americans, which would lead them to endorse the higher points of the Likert scale less, preferring midpoint response options. In the present study, Brazilians had lower levels of HS than Argentinians did. Brazilians are seen as more concerned about others and empathetic, in addition to being, on average, more religious than Argentinians among South American countries. To illustrate, Brazil and Argentina presented different individualism scores (36 and 46, respectively). The Argentine score was the highest in South America but much lower than that of the United States (96) (Hofstede et al., 2010).
In addition to individualism values, the characteristics of the study’s sample could also influence the differential use of the scale. While the countries included were not classified as WEIRD, it is important to note that the samples primarily comprised mostly psychology undergraduate students. Although the attendees of universities in both countries cannot be regarded as a homogeneous group, even though the majority is from public institutions, on average, they have more years of schooling than the general population in Brazil and Argentina (Ministério da Educação do Brasil, 2022; Ministerio de Educación y Justicia de la Nación Argentina, 2023). Thus, it is plausible that the levels of perfectionism and its manifestation may have been influenced by these characteristics (Curran & Hill, 2019). Hence, future studies comparing the cross-cultural manifestation of perfectionism should consider utilizing samples with greater variability not only for education, but also gender and social-economic status. Taking into account that perfectionism could be influenced by context (Curran & Hill, 2019), even if it has a similar factor structure, its expression may be distinct across cultures. Therefore, greater diversity in samples may elucidate potential differences or similarities between countries. One potential avenue for investigation is to examine potential interactions between these characteristics and measurement invariance. For instance, by achieving a more balanced gender distribution, it could be explored whether or not the equivalence of perfectionism scores depends on the gender of the respondent.
Regarding differences in correlations, not all countries seem to separate the dimensions of perfectionism in the same way (Rice et al., 2019). The results of this study suggested that the HS and D dimensions are not as well differentiated for Brazilian undergraduate students compared to Argentine students. The possible impacts of this lesser differentiation can be explored in future studies where the association between perfectionism and external criteria can be compared between the countries.
To the best of our knowledge, this was the first study to compare cross-cultural invariance between Portuguese and Spanish versions of the APS-R in Latin America. We used a comprehensive test to test the equivalence of these scales, thus adding to the current knowledge of the generalizability of perfectionism measures to non-WEIRD countries. Full configural and metric equivalence were achieved, whereas scalar equivalence was partially achieved. A closer look at the Likert scale endorsement of the partially equivalent items revealed different tendencies across Argentinians and Brazilians. A plausible explanation for this is the cultural values attributed to these items. Nevertheless, this assumption is yet to be tested in the future. The possibility of comparing at least some of the dimensions of perfectionism across these countries could aid clinical practice enabling cross-cultural research and knowledge transfer between countries. Beside our efforts, this study had several limitations, such as the timeline of assessments between the two countries, convenience sampling, and use of only undergraduate students. Therefore, results of this study can only be generalized to higher education students, and cannot be applied to the general population. Hence, other studies should further investigate the replicability of these results for the general population of both countries. Despite these limitations, this study highlights the importance of testing for measurement invariance before comparing two or more cultures. Comparing the equivalence of perfectionism measures across cultures may shed light on whether perfectionism dimensions are context-dependent (Smith et al., 2022; Stoeber, 2018). Finally, the results could also improve the understanding of perfectionism in non-WEIRD countries.
References
-
Arana, F. G., Keegan, E., & Rutsztein, G. (2009). Adaptación de una medida multidimensional de perfeccionismo: la Almost Perfect Scale-Revised (APS-R). Un estudio preliminar sobre sus propiedades psicométricas en una muestra de estudiantes universitarios argentinos. Revista Evaluar, 9(0). https://doi.org/10.35670/1667-4545.v9.n1.463
» https://doi.org/10.35670/1667-4545.v9.n1.463 -
Arana, F. G., Rice, K. G., & Ashby, J. S. (2018). Perfectionism in Argentina and the United States: Measurement Structure, Invariance, and Implications for Depression. Journal of Personality Assessment, 100(2), 219-230. https://doi.org/10.1080/00223891.2017.1296845
» https://doi.org/10.1080/00223891.2017.1296845 -
Asparouhov, T., & Muthén, B. (2009). Exploratory structural equation modeling. Structural Equation Modeling, 16(3), 397-438. https://doi.org/10.1080/10705510903008204
» https://doi.org/10.1080/10705510903008204 -
Aydin, K. B. (2013). Cross - cultural validity of the almost perfect scale-revised on the college students in the United States and Turkey. Educational Research and Reviews, 8(14), 1150-1157. https://doi.org/10.5897/ERR2013.1475
» https://doi.org/10.5897/ERR2013.1475 -
Ayearst, L. E., Flett, G. L., & Hewitt, P. L. (2012). Where is multidimensional perfectionism in DSM-5? A question posed to the DSM-5 personality and personality disorders work group. Personality Disorders: Theory, Research, and Treatment, 3(4), 458-469. https://doi.org/10.1037/A0026354
» https://doi.org/10.1037/A0026354 -
Booth, T., & Hughes, D. J. (2014). Exploratory Structural Equation Modeling of Personality Data. Assessment, 21(3), 260-271. https://doi.org/10.1177/1073191114528029
» https://doi.org/10.1177/1073191114528029 -
Canty, A., & Ripley, B. D. (2021). boot: Bootstrap R (S-Plus) Functions. https://cran.r-project.org/web/packages/boot/index.html
» https://cran.r-project.org/web/packages/boot/index.html -
Chang, E.C., Chang, R. & Sanna, L.J. A Test of the Usefulness of Perfectionism Theory Across Cultures: Does Perfectionism in the US and Japan Predict Depressive Symptoms Across Time?. Cogn Ther Res 36, 1-14 (2012). https://doi.org/10.1007/s10608-011-9376-9
» https://doi.org/10.1007/s10608-011-9376-9 -
Chen, F. F. (2007). Sensitivity of goodness of fit indexes to lack of measurement invariance. Structural Equation Modeling, 14(3), 464-504. https://doi.org/10.1080/10705510701301834
» https://doi.org/10.1080/10705510701301834 -
Chen, F. F. (2008). What happens if we compare chopsticks with forks? The impact of making inappropriate comparisons in cross-cultural research. Journal of Personality and Social Psychology, 95(5), 1005-1018. https://doi.org/10.1037/a0013193
» https://doi.org/10.1037/a0013193 -
Coelho, G. L. de H., Monteiro, R. P., Vilar, R., Hanel, P. H. P., Moizéis, H. C. B., & Gouveia, V. V. (2020). Psychometric Evidence of the Short Almost Perfect Scale (SAPS) in Brazil. The Counseling Psychologist, 49(1), 6-32. https://doi.org/10.1177/0011000020949146
» https://doi.org/10.1177/0011000020949146 -
Cupani, M., Lorenzo-Seva, U., Korzeniowski, C. G., & Azpilicueta, A. E. (2019). Development of a brief version of the personality inventory IPIP-revised: Control of the acquiescence response bias. Acta Colombiana de Psicologia, 22(1), 248-260. https://doi.org/10.14718/acp.2019.22.1.12
» https://doi.org/10.14718/acp.2019.22.1.12 -
Curran, T., & Hill, A. P. (2019). Perfectionism is increasing over time: A meta-analysis of birth cohort differences from 1989 to 2016. Psychological Bulletin, 145(4), 410-429. https://doi.org/10.1037/BUL0000138
» https://doi.org/10.1037/BUL0000138 -
Egan, S. J., Wade, T. D., & Shafran, R. (2011). Perfectionism as a transdiagnostic process: A clinical review. In Clinical Psychology Review (Vol. 31, Issue 2, pp. 203-212). Clin Psychol Rev. https://doi.org/10.1016/j.cpr.2010.04.009
» https://doi.org/10.1016/j.cpr.2010.04.009 -
Flett, G. L., & Hewitt, P. L. (2020). Reflections on Three Decades of Research on Multidimensional Perfectionism: An Introduction to the Special Issue on Further Advances in the Assessment of Perfectionism. Journal of Psychoeducational Assessment, 38(1), 3-14. https://doi.org/10.1177/0734282919881928
» https://doi.org/10.1177/0734282919881928 -
Frost, R. O., Marten, P. A., Lahart, C. M., & Rosenblate, R. (1990). The dimensions of perfectionism. Cognitive Therapy and Research, 14, 449-468. https://psycnet.apa.org/doi/10.1007/BF01172967
» https://psycnet.apa.org/doi/10.1007/BF01172967 -
Fundación Liberdad. (2019). Radiografía de las Universidades Argentinas. https://libertad.org.ar/web/wp-content/uploads/2019/09/CISE_Radiografia_Universidades.pdf
» https://libertad.org.ar/web/wp-content/uploads/2019/09/CISE_Radiografia_Universidades.pdf -
Gnilka, P. B., & Novakovic, A. (2017). Gender Differences in STEM Students’ Perfectionism, Career Search Self-Efficacy, and Perception of Career Barriers. Journal of Counseling & Development, 95(1), 56-66. https://doi.org/10.1002/JCAD.12117
» https://doi.org/10.1002/JCAD.12117 -
Green, S. B., & Yang, Y. (2009). Reliability of Summed Item Scores Using Structural Equation Modeling: An Alternative to Coefficient Alpha. Psychometrika, 74(1), 155-167. https://doi.org/10.1007/s11336-008-9099-3
» https://doi.org/10.1007/s11336-008-9099-3 - Hair, J. F., Black, W. C., Babin, B. J., & Anderson, R. E. (2014). Multivariate Data Analysis (new int. e). Pearson Education.
- Hamamura, T., & Heine, S. J. (2008). The role of self-criticism in self-improvement and face maintenance among Japanese. In E. C. Chang (Ed.), Self-criticism and self-enhancement: Theory, research, and clinical implications (pp. 105-122). Washington, DC: American Psychological Association.
-
Hambleton, R. K., & Kanjee, A. (1995). Increasing the Validity of Cross-Cultural Assessments: Use of Improved Methods for Test Adaptations. European Journal of Psychological Assessment, 11(3), 147-157. https://doi.org/10.1027/1015-5759.11.3.147
» https://doi.org/10.1027/1015-5759.11.3.147 -
Hewitt, P. L., & Flett, G. L. (1991). Perfectionism in the self and social contexts: Conceptual assessment, and association with psychopathology. Journal of Personality and Social, Psychology, 60, 456-47. https://psycnet.apa.org/doi/10.1037/0022-3514.60.3.456
» https://psycnet.apa.org/doi/10.1037/0022-3514.60.3.456 -
Hewitt, P. L., Flett, G. L., Mikail, S. F., Kealy, D., & Zhang, L. C. (2017). Perfectionism in the Therapeutic Context : The Perfectionism Social Disconnection Model. In The Psychology of Perfectionism. Routledge. https://doi.org/10.4324/9781315536255-20
» https://doi.org/10.4324/9781315536255-20 -
Hill, A. P., Mallinson-Howard, S. H., & Jowett, G. E. (2018). Multidimensional perfectionism in sport: A meta-analytical review. Sport, Exercise, and Performance Psychology, 7(3), 235-270. https://doi.org/10.1037/SPY0000125
» https://doi.org/10.1037/SPY0000125 -
Hofstede, G., Hofstede, G. J., & Minkov, M. (2010). Cultures and organizations: software of the mind: international cooperation and its importance for survival. (3rd ed., Vol. 1, Issue May). McGraw-Hill. https://e-edu.nbu.bg/pluginfile.php/900222/mod_resource/content/1/g.hofstede_g.j.hofstede_m.minkov-culturesandorganizations-softwareofthemind3rd_edition 2010.pdf
» https://e-edu.nbu.bg/pluginfile.php/900222/mod_resource/content/1/g.hofstede_g.j.hofstede_m.minkov-culturesandorganizations-softwareofthemind3rd_edition 2010.pdf - International Monetary Fund. (2022). Country rankings.
-
ITC. (2017). INTERNATIONAL TEST COMMISSION ITC Guidelines for Translating and Adapting Tests (Second Edition). http://www.intestcom.org
» http://www.intestcom.org - James, G., Witten, D., Hastie, T., & Tibshirani, R. (2021). An introduction to statistical learning (2nd ed., Vol. 102). Springer texts.
-
Jorgensen, T. D., Pornprasertmanit, S., Schoemann, A. M., & Rosseel, Y. (2022). semTools: Useful tools for structural equation modeling. https://cran.r-project.org/package=semTools
» https://cran.r-project.org/package=semTools - Kline, R. B. (2015). Principles and practice of structural equation modeling (4th ed.). The Guilford Press.
-
Lenth, R. V. (2021). emmeans: Estimated Marginal Means, aka Least-Squares Means. https://cran.r-project.org/package=emmeans
» https://cran.r-project.org/package=emmeans -
Madigan, D. J. (2019). A Meta-Analysis of Perfectionism and Academic Achievement. Educational Psychology Review, 31(4), 967-989. https://doi.org/10.1007/S10648-019-09484-2/TABLES/3
» https://doi.org/10.1007/S10648-019-09484-2/TABLES/3 -
Marsh, H. W., Morin, A. J. S., Parker, P. D., & Kaur, G. (2014). Exploratory structural equation modeling: An integration of the best features of exploratory and confirmatory factor analysis. Annual Review of Clinical Psychology, 10, 85-110. https://doi.org/10.1146/annurev-clinpsy-032813-153700
» https://doi.org/10.1146/annurev-clinpsy-032813-153700 -
Miller, R., Hilsenroth, M. J., & Hewitt, P. L. (2017). Perfectionism and Therapeutic Alliance: A Review of the Clinical Research. Research in Psychotherapy: Psychopathology, Process, and Outcome, 20(1), 19-26. https://doi.org/10.4081/RIPPPO.2017.264
» https://doi.org/10.4081/RIPPPO.2017.264 -
Ministério da Educação do Brasil. (2022). Relatórios de inscrições e notas de corte do Sistema de Seleção Unificado (SISU). https://sisu.mec.gov.br/#/relatorio
» https://sisu.mec.gov.br/#/relatorio -
Ministerio de Educación y Justicia de la Nación Argentina. (2023). Ley de educación superior. Derecho Fácil. Ley Simple. https://www.argentina.gob.ar/justicia/derechofacil/leysimple/ley-de-educacion-superior
» https://www.argentina.gob.ar/justicia/derechofacil/leysimple/ley-de-educacion-superior -
Pietrabissa, G., Gullo, S., Aimé, A., Mellor, D., McCabe, M., Alcaraz-Ibánez, M., ... & Fuller-Tyszkiewicz, M. (2020). Measuring perfectionism, impulsivity, self-esteem and social anxiety: cross-national study in emerging adults from eight countries. Body image, 35, 265-278. https://doi.org/10.1016/j.bodyim.2020.09.012
» https://doi.org/10.1016/j.bodyim.2020.09.012 -
Putnick, D. L., & Bornstein, M. H. (2016). Measurement invariance conventions and reporting: The state of the art and future directions for psychological research. Developmental Review, 41, 71-90. https://doi.org/10.1016/j.dr.2016.06.004
» https://doi.org/10.1016/j.dr.2016.06.004 -
Rammstedt, B., Kemper, C. J., & Borg, I. (2013). Correcting Big Five Personality Measurements for Acquiescence: An 18-Country Cross-Cultural Study. European Journal of Personality, 27(1), 71-81. https://doi.org/10.1002/per.1894
» https://doi.org/10.1002/per.1894 -
Rice, K. G., Park, H. J., Hong, J., & Lee, D. G. (2019). Measurement and Implications of Perfectionism in South Korea and the United States. Counseling Psychologist, 47(3), 384-416. https://doi.org/10.1177/0011000019870308
» https://doi.org/10.1177/0011000019870308 -
Rice, K. G., Richardson, C. M. E., & Tueller, S. (2014). The short form of the revised almost perfect scale. Journal of Personality Assessment, 96(3), 368-379. https://doi.org/10.1080/00223891.2013.838172
» https://doi.org/10.1080/00223891.2013.838172 -
Rice, S. P. M., Loscalzo, Y., Giannini, M., & Rice, K. G. (2020). Perfectionism in Italy and the USA: Measurement Invariance and Implications for Cross-Cultural Assessment. European Journal of Psychological Assessment, 36(1), 207-211. https://doi.org/10.1027/1015-5759/a000476
» https://doi.org/10.1027/1015-5759/a000476 -
Richardson, C. M. E., & Datu, J. A. D. (2020). Measurement invariance of the almost perfect scale-revised in the Philippines and the United States. Asia Pacific Journal of Counselling and Psychotherapy, 11(2), 220-228. https://doi.org/10.1080/21507686.2020.1808027
» https://doi.org/10.1080/21507686.2020.1808027 -
Rosseel, Y. (2012). lavaan: An R Package for Structural Equation Modeling. Journal of Statistical Software, 48(2), 1-36. https://doi.org/10.18637/jss.v048.i02
» https://doi.org/10.18637/jss.v048.i02 -
Slaney, R. B., Rice, K. G., Mobley, M., Trippi, J., & Ashby, J. S. (2001). The revised almost perfect scale. Measurement and Evaluation in Counseling and Development, 34(3), 130-145. https://doi.org/10.1080/07481756.2002.12069030
» https://doi.org/10.1080/07481756.2002.12069030 -
Slaney, R., Rice, K., Mobley, M., Trippi, J., & Ashby, J. (2001). The Revised Almost Perfect Scale. Measurement and Evaluation in Counseling and Development, 34, 130-145. https://doi.org/10.1080/07481756.2002.12069030
» https://doi.org/10.1080/07481756.2002.12069030 -
Smith, M. M., Sherry, S. B., Ge, S. Y. J., Hewitt, P. L., Flett, G. L., & Baggley, D. L. (2022). Multidimensional perfectionism turns 30: A review of known knowns and known unknowns. Canadian Psychology/Psychologie Canadienne, 63(1), 16-31. https://doi.org/10.1037/cap0000288
» https://doi.org/10.1037/cap0000288 -
Soares, F. H. dos R., Carvalho, A. V. de, Keegan, E., Neufeld, C. B., & Mansur-Alves, M. (2020). Adaptação e Validação da Escala de Perfeccionismo Almost Perfect Scale-Revised para o Português Brasileiro. Avaliação Psicológica, 19(3), 310-321. https://doi.org/10.15689/ap.2020.1903.17282.09
» https://doi.org/10.15689/ap.2020.1903.17282.09 -
Spagnoli, P., Rice, K., Scafuri Kovalchuk, L., Rice, F., Molinaro, D., & Carpentieri, S. (2022). The Two-Factor Perfectionism Model and Heavy Work Investment in Italy and the U.S. Journal of Personality Assessment, 104(5), 680-691. https://doi.org/10.1080/00223891.2021.1975724
» https://doi.org/10.1080/00223891.2021.1975724 -
Stoeber, J. (2018). The Psychology of Perfectionism: An introduction. In Joachim Stoeber (Ed.), The Psychology of Perfectionism: Theory, Research, Applications (pp. 3-16). Routledge/Taylor & Francis Group. https://doi.org/10.4324/9781315536255
» https://doi.org/10.4324/9781315536255 - Stoeber, J., & Otto, K. (2006). Positive conceptions of perfectionism: Approaches, evidence, challenges. Personality and Social Psychology Review, 10, 295-319.
-
Stoeber, J., Madigan, D. J., & Gonidis, L. (2020). Perfectionism is adaptive and maladaptive, but what’s the combined effect? Personality and Individual Differences, 161, 109846. https://doi.org/10.1016/j.paid.2020.109846
» https://doi.org/10.1016/j.paid.2020.109846 -
Transparency International. (2021). Corruptions Perception Index. https://www.transparency.org/en/cpi/2021
» https://www.transparency.org/en/cpi/2021 -
Triandis, H. C. (2001). Individualism-Collectivism and Personality. Journal of Personality, 69(6), 907-924. https://doi.org/10.1111/1467-6494.696169
» https://doi.org/10.1111/1467-6494.696169 -
Zanon, C., Lessa, J. P. A., & Dellazzana-Zanon, L. L. (2018). Aquiescência em autorrelatos de personalidade: uma comparação de métodos. Revista Avaliação Psicológica, 17(4), 428-438. https://doi.org/10.15689/ap.2018.1704.3.03
» https://doi.org/10.15689/ap.2018.1704.3.03
-
1
Data availability statement: data and codes are available upon reasonable request to the corresponding author
-
Funding sources: For Brazil, the project received financial support from the Coordination for the Improvement of Higher Education Personnel (Coordenação de Aperfeiçoamento de Pessoal de Nível Superior [CAPES]) and from National Council for Scientific and Technological Development (Conselho Nacional de Desenvolvimento Científico e Tecnológico [CNPq]), through scholarships. For Argentina data collection, the project received financial support from the Universidad de Buenos Aires, through successive grants of UBACyT P031 and 20020100100552, from 2008 up to 2014.