 Relationships between meteorological variables and the productive performance of soybean lines
Abstract
The objective of this work was to identify the relationships between meteorological variables capable of predicting the productive performance of soybean lines using stepwise regression and unsupervised machine learning. The used experimental design was of augmented blocks with interspersed controls. The following regular and irregular treatments were evaluated, respectively: 3 F4 lines (87.5% homozygous), 138 F5 lines (93.75% homozygous), and 88 F8 lines (99.22 homozygous) of soybean, totaling 230 segregating lines; and four commercial cultivars in three replicates, totaling 242 experimental units. The weather data were obtained from the NASA POWER and SISDAGRO platforms. Positive linear associations were observed between maximum temperature and vapor pressure deficit and vapor saturation pressure curve (r = 0.9), as well as a negative correlation between relative humidity and potential evapotranspiration (r = -0.7). These associations had a direct influence on the dynamics of soil water storage capacity and modulated all other correlations between meteorological variables. Stepwise regression and unsupervised machine learning are effective in identifying relationships between meteorological variables that predict the productive performance of soybean lines.
Index terms:
Glycine max; correlation; genetic breeding; Kohonen; stepwise.
Resumo
O objetivo deste trabalho foi identificar as relações entre variáveis meteorológicas capazes de predizer o desempenho produtivo de linhagens de soja, com uso da regressão stepwise e do aprendizado de máquina não supervisionado. O delineamento experimental utilizado foi o de blocos aumentados com controles intercalares. Os seguintes tratamentos regulares e irregulares foram avaliados, respectivamente: 3 linhagens F4 (87,5% homozigotas), 138 linhagens F5 (93,75% homozigotas) e 88 linhagens F8 (99,22 homozigotas) de soja, totalizando 230 linhagens segregantes; e quatro cultivares, com três repetições, totalizando 242 unidades experimentais. Os dados meteorológicos foram obtidos das plataformas Nasa Power e Sisdagro. Foram observadas associações lineares positivas entre temperatura máxima e déficit de pressão de vapor e curva de pressão de saturação de vapor (r = 0,9), bem como correlação negativa entre umidade relativa e evapotranspiração potencial (r = -0,7). Estas associações influenciaram diretamente a dinâmica da capacidade de armazenamento de água no solo e modularam todas as outras correlações entre as variáveis meteorológicas. A regressão stepwise e o aprendizado de máquina não supervisionado são eficazes na identificação de relações entre variáveis meteorológicas que predizem o desempenho produtivo de linhagens de soja.
Termos para indexação:
Glycine max; correlação; melhoramento genético; Kohonen; stepwise.
Introduction
Soybean [Glycine max (L.) Merr.] is an important global commodity due to its high nutritional value and wide use (Loro et al., 2021). The agronomic performance of this crop is determined by genetic and environmental effects, as well as by genotype x environment interactions (Cruz et al., 2014). The main elements responsible for these interactions are abiotic factors such as climate, with notable impacts caused by thermal variations and water deficit (Gava et al., 2015; Silva et al., 2018; Cavalcante et al., 2020).
In addition to a constant search for an increased productivity and quality in breeding programs, it is also essential to select progenies, lines, populations, and cultivars that are resilient to the environments to which the crops are most adapted. For this, it is necessary to understand the relationships between the agronomic performance of genotypes and meteorological variables. For soybean, several studies have shown such associations between the yield components of the crop and weather or soil variables (Gusso et al., 2017; Reis et al., 2020; Von Bloh et al., 2023). Dellagostin et al. (2021), for example, reported interrelationships between soybean performance and the magnitude of maximum, minimum, and mean air temperatures, as well as of relative humidity, radiation, and precipitation. This allows genotypes to be evaluated based on the variables that determine productivity during genetic improvement, making the process more efficient (Barbosa et al., 2021).
Once the aforementioned associations are determined, it is also key to develop techniques capable of predicting the productive potential of genotypes. New genotypes should exhibit the agronomic ideotype, with an adequate plant height, biomass, resilience to diseases and insect pests, and grain quality and productivity. However, fewer environmental resources should be used for this, ensuring that there are adequate direct and indirect relationships with mainly climatic and meteorological attributes (Bigolin & Talamini, 2024).
The relationships between meteorological variables can be evaluated using different methodologies. Linear correlation coefficients are numerical values that define the behavior of two possibly associated variables, although they do not always have a real biological significance (Cargnelutti Filho et al., 2016). In contrast, when fitting a model based on a stepwise regression, only significant predictor variables are used for the dependent variable (Suarez et al., 2023), making it possible to estimate biological processes more assertively. Furthermore, machine-learning techniques can reveal trait patterns in genotypes, especially under adverse conditions (Bustos-Korts et al., 2022). In this case, self-organizing maps, defined as a two-dimensional unsupervised neural network, assign synaptic weights to neurons, with each data sample being mapped to the neuron that best represents it (Santos et al., 2019). Biometric models are prioritized in genetic improvement programs to elucidate meteorological interrelationships and apply them to selection, linking the best genotypes with relationships and variables to be considered in the process (Kehl et al., 2022; Loro et al., 2022).
The objective of this work was to identify the relationships between meteorological variables capable of predicting the productive performance of soybean lines using stepwise regression and unsupervised machine learning.
Materials and Methods
The study was carried out from December 2021 to May 2022 at the farm school of Universidade Regional do Noroeste do Rio Grande do Sul, located in the municipality of Augusto Pestana, in the state of Rio Grande do Sul, Brazil (28°26’25’’S, 54°00’07’’W). The climate is type Cfa according to Köppen’s classification, characterized as subtropical with a hot summer, an average temperature above 22°C, and the occurrence of frosts at negative temperatures (<0°C) during the cold season (Dubreuil et al., 2018). The soil in the experimental area is classified as a Latossolo Vermelho distroférico (Santos et al., 2018), equivalent to an Oxisol.
The experiment was conducted in an augmented block design with interspersed controls, with regular and irregular treatments. The regular treatments comprised 3 F4 (87.5% homozygous), 138 F5 (93.75% homozygous), and 88 F8 (99.22% homozygous) soybean lines, totaling 230 segregating lines. The irregular treatments consisted of cultivars BRS 284, BMX Valente 6968 RSF RR, BMX Raio 50I52 RSF IPRO, and M 5710 I2X45, as a control, in three replicates, totaling 242 experimental units. The experimental units (total area of 4.5 m2) consisted of two 5.0 m rows, with a spacing of 0.45 m per row.
Sowing took place in the second half of November 2021, using 12 seeds per linear meter. Base fertilization consisted of 300 kg ha-1 of an organomineral fertilizer with an N-P-K ratio of 20-05-20. The control of insect pests and diseases was preventive through scheduled applications of chemical fungicides and insecticides every 15 days after stage V4 (Fehr & Caviness, 1977), aiming to minimize biotic effects on the results of the experiment.
The following meteorological data were obtained from the NASA POWER platform of National Aeronautics and Space Administration (NASA, 2022): mean air temperature (°C), minimum air temperature (°C), maximum air temperature (°C), precipitation (mm), relative humidity (%), incident radiation (MJ per m2 per day), accumulation of growing degree-days (ºC day), light hour (hours), dew point, extraterrestrial radiation (MJ per m2 per day), long-wave radiation (MJ per m2 per day), slope of the saturation vapor pressure (kPa °C-1), and vapor pressure deficit (kPa). Other variables were obtained from the Sistema de Suporte à Decisão na Agropecuária (SISDAGRO) database of Instituto Nacional de Meteorologia (INMET, 2022), as follows: potential evapotranspiration (mm), real evapotranspiration (mm), reference evapotranspiration (mm), wind speed (m s-1), soil water storage (mm), and water deficit (mm). All data were analyzed for normality and homogeneity of variances using the Shapiro-Wilk and Bartlett tests, respectively.
The agronomic variables were measured in five randomly selected plants per experimental unit based on the following criteria: level of heterozygosity (12.5, 6.25, and 0.78%); source of the F2 population (IRC001, IRC002, IRC004, IRC005, IRC007, IRC008, IRC011, IRC012, IRC013, IRC016, IRC017, IRC023, IRC025, IRC026, IRC028, IRC031, IRC032, IRC033, IRC034, IRC038, IRC039, IRC040, IRC042, IRC044, IRC045, and IRC050); number of plants per linear meter, by counting the number of established plants in one linear meter, defined using a measuring tape; number of seeds per plant (unit), by threshing manually and individually the collected plants and measuring the total number of seeds in their pods; and seed weight per plant (grams), by weighing the seeds of each plant on a scale.
Afterwards, descriptive analyzes were computed to determine the following parameters: coefficient of variation (%), maximum and minimum values, mean, median, sample standard deviation, standard error of the mean, and confidence interval. Pearson’s linear correlation coefficients were estimated with significance based on the t-test, at 5% probability. Subsequently, the stepwise multiple regression predictive model was used, considering the variables seed weight per plant and number of seeds per plant as dependent variables and all others as explanatory variables of the statistical model, based on the principle of selecting predictive meteorological variables by defining which of these are determining for the phenotypic manifestation of the agronomic ideotype. The use of the stepwise selection method allows inferring which independent variables show the greatest influence on a dependent variable, in order to discard those with a lower relevance (Alves et al., 2013). This method allows evaluating the model with each inclusion and exclusion of variables (Ribon et al., 2014).
The unsupervised machine learning method was used to build lineage patterns through agronomic attributes via the Kohonen map technique in a hexagonal topology, which defines the central tendencies and gathers them into centroids that contain the information expressed in each neuron obtained through the measurements of the variables (Sá et al., 2022). All analyzes were carried out in the R software using the readxl, metan, ggplot2, rio, cowplot, dly, pvclust, ape, and kohonen packages (R Core Team, 2023).
Results and Discussion
The maximum temperature during the experimental period varied between 30 and 40°C, with a peak between January and February (Figure 1 and Table 1). The ideal growing temperature for soybean is between 20 and 30°C, with minimum temperatures above 13°C during flowering, considering that high temperatures and humidity can affect grain quality at maturation, while a low humidity can cause mechanical damage (Tecnologias…, 2013). Throughout the cycle, the water deficit was accentuated between March and May, which can affect the critical stages of grain filling (R1 to R8). Moreover, precipitation was insufficient for water storage, only meeting the needs of the crop.
Descriptive analysis of meteorological factors obtained from December 2021 to May 2022 as to their influence on the productive performance of soybean (Glycine max) lines.

Descriptive analysis of temperature, evapotranspiration, and water supply from December 2021 to May 2022.
Strong Pearson’s linear correlations were observed between meteorological factors (Table 2). Maximum temperature was negatively correlated with relative humidity, explaining the shape of the curve of saturation vapor, vapor pressure deficit, light hour, accumulation of growing degree-days, and minimum air temperature. Minimum temperature had positive effects on the shape of the curve of saturation vapor, accumulation of growing degree-days, long-wave radiation, and dew point, but negative effects on relative humidity. Relative humidity showed a negative correlation with potential evapotranspiration, reference evapotranspiration, vapor pressure deficit, light hour, and incidence radiation. These results are in alignment with those of Silva et al. (2021), who concluded that the thermal stimulus, although directly influenced by solar radiation, also depends on factors such as relative humidity.
Estimates of Pearson’s linear correlation between meteorological factors and soybean (Glycine max) productivity components(1).
Dew point showed a positive trend with long-wave radiation (Table 2). In addition, long-wave radiation exhibited a positive linear correlation with the shape of the curve of saturation vapor and accumulation of growing degree-days. Incident radiation positively influenced vapor pressure deficit and light hour. Reis et al. (2020) found that relative humidity regulates temperatures by absorbing infrared radiation, which increases atmospheric water demand and reduces soil moisture. In the present study, linear associations were maintained even when sowing was carried out at a non-preferred time (December) for soybean crops in Southern Brazil. According to Cargnelutti Filho et al. (2016), high-magnitude positive correlations indicate that, as a certain character increases or decreases, the expression of another is influenced in the same proportion.
The accumulation of growing degree-days showed a positive correlation with the shape of the curve of saturation vapor, vapor pressure deficit, and light hour (Table 2). The accumulation of growing degree-days is linked to the leaf area index of plants, which may result in an increase or decrease in leaf area (Teixeira et al., 2015). The number of light hours revealed a positive effect when related to the shape of the curve of saturation vapor and vapor pressure deficit. Vapor pressure deficit had a positive influence on potential evapotranspiration, reference evapotranspiration, and the shape of the curve of saturation vapor.
Reference evapotranspiration correlated positively with potential evapotranspiration, but negatively with soil water storage (Table 2). Furthermore, potential evapotranspiration showed a positive correlation with vapor pressure deficit, whereas soil water storage expressed a negative correlation with water deficit. Although the number of seeds per plant had a positive effect on seed weight per plant, as expected, no strong linear association was observed between yield components and weather variables.
According to the linear correlation, the number of seeds per plant is correlated with the increase in seed weight per plant. Based on the stepwise multiple regression, seed weight per plant is determined by the meteorological factors maximum air temperature, precipitation, and vapor pressure deficit, with a negative influence of the last two (Table 3). Therefore, the ideal scenario would be an increase in precipitation and vapor pressure deficit to minimize the effects of maximum air temperature. For number of seeds per plant, the prediction model revealed that the determining meteorological attributes are maximum temperature, precipitation, wind speed, light hour, vapor pressure deficit, extraterrestrial radiation, reference evapotranspiration, and potential evapotranspiration.
Predictive model based on multiple linear regression (stepwise) for the dependent variables seed weight per plant (SWP) and number of seeds per plant (NSP) of soybean (Glycine max) lines(1).
The populations of the studied lines were grouped into 25 centroids in a hexagonal topology based on similarity via unsupervised machine learning, taking into account population characteristics, heterozygosity, number of plants per linear meter, number of seeds per plant, and seed weight per plant (Figure 2). Santos et al. (2019) observed that the hexagonal topology allows for better arrangements of neurons and, consequently, for a greater efficiency in unveil patterns. This is reflected in the identification of genotypes that responded favorably to the meteorological variables adjusted by stepwise regression (Table 3).

Kohonen map using 25 centroids based on five variables measured in 230 segregating soybean (Glycine max) lines. HET, heterozygosity; PLM, plants per linear meter; SWP, seed weight per plant; POP, population; and NSP, number of seeds per plant.
Among the similar characteristics used to classify the lines into a same group (Figure 2), heterozygosity was a determining factor for centroids 1, 4, 6, 8, 11, 13, 15, 16, 17, 19, 20, and 24, while population had a high influence on centroids 5, 6, 7, 8, 9, 12, 13, 16, 17, 20, 22, 24, and 25. However, as the distance between these groupings was not the same and lines with a high productive potential may have different levels of heterozygosity and come from different populations, but still be grouped together, it can be inferred that these variables were not in fact explanatory. Conversely, the variable plants per linear meter weighted the clustering in centroids 6, 9, 11, 16, and 21, being more specific than heterozygosity and population. Likewise, number of seeds per plant and seed weight per plant were of major importance for centroids 2 and 4.
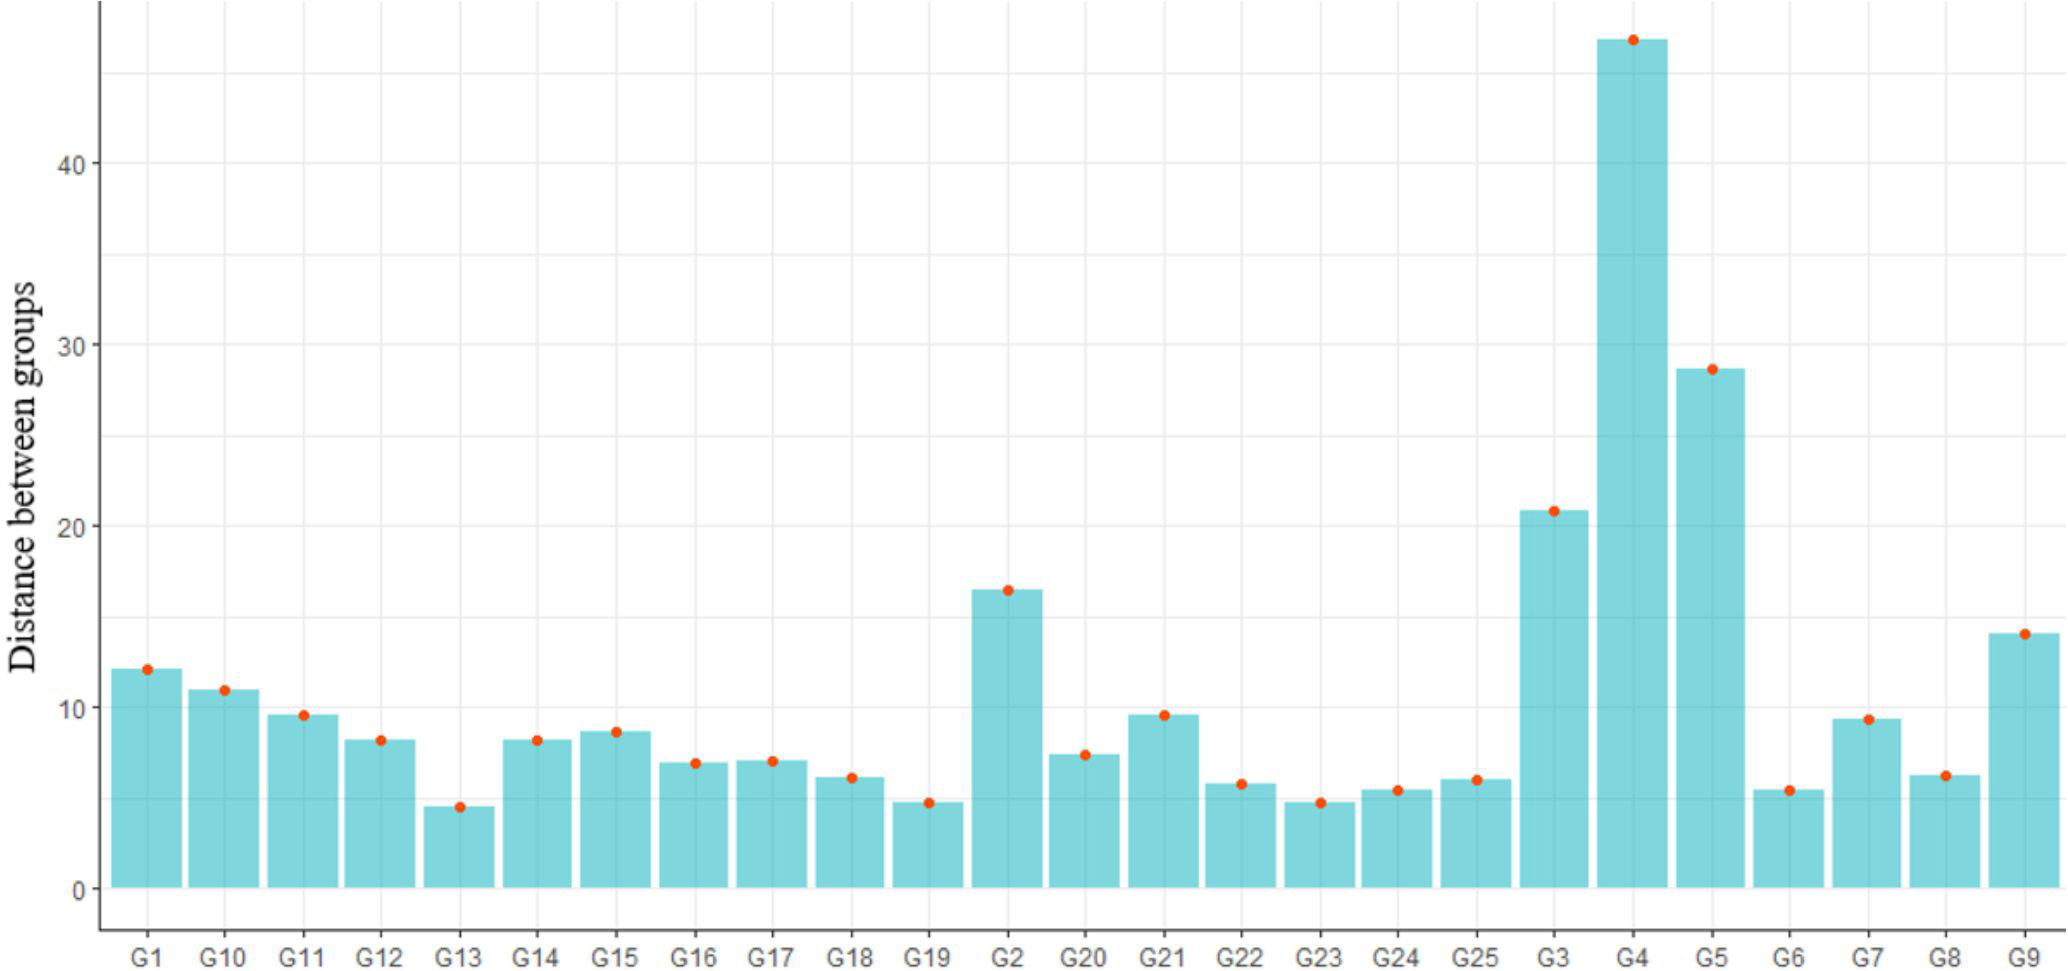
Considering the obtained clusters, the greatest distances were assigned to centroids 4, 5, 3, and 2 (Figure 3). With the exception of centroid 3, none of the others clustered a line with more than 14 g of seed weight per plant. Moreover, the most productive line was L85 in centroid 3, with 18.85 g per plant, while L849, in centroid 2, produced only 3.57 g per plant. This shows that the centroids with the greatest distance grouped together lines with a low productive potential and, therefore, with a lower resilience to challenging environmental conditions.

Distance between 25 centroids based on the variables heterozygosity, plants per linear meter, seed weight per plant, population, and number of seeds per plant, measured in 230 segregating soybean (Glycine max) lines. G1 to G25, formed groups.
The top-performing lineages were found at centroids 22 (L14 from IRC034), 6 (L122 from IRC034), 10 (L859 from IRC012; L2, L165, and L169 from IRC017; L176 from IRC001; L7 from IRC031; L232 from IRC040; and L869 from IRC017), and 16 (L10 from IRC002). These lines showed similar distances, with values for number of seeds per plant varying from 156 to 337 units and seed weight per plant from 29.34 to 52.54 g (Figure 3). Therefore, these genotypes presented the greatest ability to adapt to adverse climatic conditions (Bustos-Korts et al., 2022).
Understanding that number of seeds per plant is influenced by meteorological variables, as maximum temperature, precipitation, and wind speed, can guide decisions about genotype selection. Furthermore, identifying factors, such as air temperature, precipitation, and vapor pressure deficit, as determinants of grain weight can help adjust management practices, including irrigation and choice of planting period, aiming to optimize crop productivity.
Conclusions
-
1. Stepwise regression and unsupervised machine learning are effective in identifying relationships between meteorological variables that predict the productive performance of soybean (Glycine max) lines.
-
2. Air temperature, precipitation, and vapor pressure deficit are determining factors for soybean grain weight.
-
3. Maximum air temperature, precipitation, wind speed, light hour, vapor pressure deficit, extraterrestrial radiation, reference evapotranspiration, and potential evapotranspiration are determining factors for the expression of number of seeds per plant.
Declaration of use of AI technologies
No generative artificial intelligence (AI) was used in this study.
Acknowledgments
To Conselho Nacional de Desenvolvimento Científico e Tecnológico (CNPq), for financial support.
Disclaimer/Publisher’s note:
The statements, opinions, and data contained in all texts published in Pesquisa Agropecuária Brasileira (PAB) are solely those of the individual author(s) and not of the journal’s publisher, editor, and editorial team, who disclaim responsibility for any injury to people or property resulting from any referred ideas, methods, instructions, or products.
The mention of specific chemical products, machines, and commercial equipment in the texts published in this journal does not imply their recommendation by the publisher.
Data availability statement
Data available upon request: research data are only available upon reasonable request to the corresponding author.
References
-
ALVES, M.F.; LOTUFO, A.D.P.; LOPES, M.L.M. Seleção de variáveis stepwise aplicadas em redes neurais artificiais para previsão de demanda de cargas elétricas. Proceeding Series of the Brazilian Society of Computational and Applied Mathematics, v.1, p.010144-1-010144-6, 2013. DOI: https://doi.org/10.5540/03.2013.001.01.0144
» https://doi.org/10.5540/03.2013.001.01.0144 -
BARBOSA, M.H.; CARVALHO, I.R.; SILVA, J.A.G. da; MAGANO, D.A.; SOUZA, V.Q. de; SZARESKI, V.J.; LAUTENCHLEGER, F.; HUTRA, D.J.; MOURA, N.B.; LORO, M.V. Contribution of the additive genetic effects in soybean breeding aiming at the agronomic ideotype. Functional Plant Breeding Journal, v.3, p.1-9, 2021. DOI: https://doi.org/10.35418/2526-4117/v3n1a1
» https://doi.org/10.35418/2526-4117/v3n1a1 -
BIGOLIN, T.; TALAMINI, E. Impacts of climate change scenarios on the corn and soybean double-cropping system in Brazil. Climate, v.12, art.42, 2024. DOI: https://doi.org/10.3390/cli12030042
» https://doi.org/10.3390/cli12030042 -
BUSTOS-KORTS, D.; BOER, M.P.; LAYTON, J.; GEHRINGER, A.; TANG, T.; WEHRENS, R.; MESSINA, C.; de la VEGA, A.J.; VAN EEUWIJK, F.A. Identification of environments types and adaptation zones with self-organizing maps; applications to sunflower multi-environment data in Europe. Theoretical and Applied Genetics, v.135, p.2059-2082, 2022. DOI: https://doi.org/10.1007/s00122-022-04098-9
» https://doi.org/10.1007/s00122-022-04098-9 -
CARGNELUTTI FILHO, A.; ALVES, B.M.; KLEINPAUL, J.A.; NEU, I.M.M.; SILVEIRA, D.L.; SIMÕES, F.M.; WARTHA, C.A. Relações lineares entre caracteres de linho. Bragantia, v.75, p.257-262, 2016. DOI: https://doi.org/10.1590/1678-4499.474
» https://doi.org/10.1590/1678-4499.474 -
CAVALCANTE, W.S. da S.; SILVA, N.F. da; TEIXEIRA, M.B.; CABRAL FILHO, F.R.; NASCIMENTO, P.E.R.; CORRÊA, F.R. Eficiência dos bioestimulantes no manejo do déficit hídrico na cultura da soja. Irriga, v.25, p.754-763, 2020. DOI: https://doi.org/10.15809/irriga.2020v25n4p754-763
» https://doi.org/10.15809/irriga.2020v25n4p754-763 - CRUZ, C.D.; CARNEIRO, P.C.S.; REGAZZI, A.J. Modelos biométricos aplicados ao melhoramento genético 3.ed. Viçosa: UFV, 2014. v.2, 668p.
- DELLAGOSTIN, S.M.; CARVALHO, I.R.; SZARESKI, V.J.; DEMARI, G.H.; MENEGUZZO, M.R.R.; LAUTENCHLEGER, F.; PELEGRINI, A.J. de; TOSO, J.O.; ZIMMER, P.D.; VILLELA, F.A.; BOLLER, W.; AUMONDE, T.Z. Interrelations of climatological and physiological attributes and components of soybean seeds yield. Revista Brasileira de Agropecuária Sustentável (RBAS), v.11, p.173-184, 2021.
- DUBREUIL, V.; FANTE, K.P.; PLANCHON, O.; SANT’ANNA NETO, J.L. The types of annual climates in Brazil: an application of the classification of Köppen from 1961 to 2015. Revue Franco-Brésilienne de Géographie/Revista Franco-Brasilera de Geografia, v.37, 2018.
- FEHR, W.R.; CAVINESS, C.E. Stages of soybean development Ames: Iowa State University, 1977. 12p. (Special Report, 80).
-
GAVA, R.; FRIZZONE, J.A.; SNYDER, R.L.; JOSE, J.V.; FRAGA JUNIOR, E.F.; PERBONI, A. Estresse hídrico em diferentes fases da cultura da soja. Revista Brasileira de Agricultura Irrigada, v.9, p.349-359, 2015. DOI: https://doi.org/10.7127/rbai.v9n600368
» https://doi.org/10.7127/rbai.v9n600368 -
GUSSO, A.; ARVOR, D.; DUCATI, J.R. Model for soybean production forecast based on prevailing physical conditions. Pesquisa Agropecuária Brasileira, v.52, p.95-103, 2017. DOI: https://doi.org/10.1590/S0100-204X2017000200003
» https://doi.org/10.1590/S0100-204X2017000200003 -
INMET. Instituto Nacional de Meteorologia. SISDAGRO: Sistema de Suporte à Decisão na Agropecuária. 2022. Available at: <http://sisdagro.inmet.gov.br/sisdagro/app/index>. Accessed on: Apr. 25 2025.
» http://sisdagro.inmet.gov.br/sisdagro/app/index -
KEHL, K.; CARVALHO, I.R.; SACON, D.; RIZZARDI, M.A.; LANGARO, N.C.; LORO, M.V.; MOURA, N.B.; LAUTENCHLEGER, F. Strategic positioning of soybeans based on the agronomic ideotype and on fixed and mixed multivariate models. Brazilian Agricultural Research, v.57, e02702, 2022. DOI: https://doi.org/10.1590/S1678-3921.pab2022.v57.02702
» https://doi.org/10.1590/S1678-3921.pab2022.v57.02702 -
LORO, M.V.; CARVALHO, I.R.; SILVA, J.A.G. da; MOURA, N.B.; HUTRA, D.J.; LAUTENCHLEGER, F. Artificial intelligence and multiple models applied to phytosanitary and nutritional aspects that interfer in the physiological potential of soybean seeds. Brazilian Journal of Agriculture, v.96, p.324-338, 2021. DOI: https://doi.org/10.37856/bja.v96i1.4258
» https://doi.org/10.37856/bja.v96i1.4258 -
LORO, M.V.; CARVALHO, I.R.; SILVA, J.A.G. da; SFALCIN, I.C.; PRADEBON, L.C. Decomposition of white oat phenotypic variability by environmental covariates. Brazilian Journal of Agriculture, v.97, p.279-302, 2022. DOI: https://doi.org/10.37856/bja.v97i3.4316
» https://doi.org/10.37856/bja.v97i3.4316 -
NASA. National Aeronautics and Space Administration. NASA Prediction of Worldwide Energy Resources (POWER) 2022. Available at: <https://power.larc.nasa.gov/>. Accessed on: Apr. 25 2025.
» https://power.larc.nasa.gov/ - R CORE TEAM. R: a language and environment for statistical computing. Vienna: R Foundation for Statistical Computing, 2023.
-
REIS, L.; SILVA, C.M.S. e; BEZERRA, B.; MUTTI, P.; SPYRIDES, M.H.; SILVA, P.; MAGALHÃES, T.; FERREIRA, R.; RODRIGUES, D.; ANDRADE, L. Influence of climate variability on soybean yield in MATOPIBA, Brazil. Atmosphere, v.11, art.1130, 2020. DOI: https://doi.org/10.3390/atmos11101130
» https://doi.org/10.3390/atmos11101130 -
RIBON, A.A.; TAVARES FILHO, J.; FERNANDES, K.L.; HERMÓGENES, V.T.L. Seleção de método estatístico para modelos de estimativa da qualidade física de solos argilosos. Revisa de Agricultura, v.89, p.29-40, 2014. DOI: https://doi.org/10.37856/bja.v89i1.100
» https://doi.org/10.37856/bja.v89i1.100 -
SÁ, L.G. de; AZEVEDO, A.M.; ALBUQUERQUE, C.J.B.; VALADARES, N.R.; BRITO, O.G.; FERNANDES, A.C.G.; ASPIAZÚ, I. Kohonen’s self-organizing maps for the study of genetic dissimilarity among soybean cultivars and genotypes. Pesquisa Agropecuária Brasileira, v.57, e02722, 2022. DOI: https://doi.org/10.1590/S1678-3921.pab2022.v57.02722
» https://doi.org/10.1590/S1678-3921.pab2022.v57.02722 - SANTOS, H.G. dos; JACOMINE, P.K.T.; ANJOS, L.H.C dos; OLIVEIRA, V.Á. de; LUMBRERAS, J.F.; COELHO, M.R.; ALMEIDA, J.A. de; ARAÚJO FILHO, J.C. de; OLIVEIRA, J.B. de; CUNHA, T.J.F. Sistema brasileiro de classificação de solos 5.ed. rev. e ampl. Brasília: Embrapa, 2018.
-
SANTOS, I.G. dos; CARNEIRO, V.Q.; SILVA JUNIOR, A.C. da; CRUZ, C.D.; SOARES, P.C. Self-organizing maps in the study of genetic diversity among irrigated rice genotypes. Acta Scientiarum. Agronomy, v.41, e39803, 2019. DOI: https://doi.org/10.4025/actasciagron.v41i1.39803
» https://doi.org/10.4025/actasciagron.v41i1.39803 -
SILVA, A.V. da; SILVA, C.M. da; PAVAN, B.E.; PESSOA, W.R.L.S.; MIELEZRSKI, F. Época de semeadura x grupos de maturação nos componentes de rendimentos de soja. Cultura Agronômica, v.27, p.44-56, 2018. DOI: https://doi.org/10.32929/2446-8355.2018v27n1p44-56
» https://doi.org/10.32929/2446-8355.2018v27n1p44-56 -
SILVA, E.S. da; CARVALHO, M.A.C. de; DALLACORT, R. Cultivares de soja em função de elementos climáticos nos municípios de Tangará da Serra e Diamantino, MT. Nativa, v.8, p.157-164, 2020. DOI: https://doi.org/10.31413/nativa.v8i2.8382
» https://doi.org/10.31413/nativa.v8i2.8382 -
SILVA, T.R.G. da; COSTA, M.L.A. da; FARIAS, L.R.A.; SANTOS, M.A. dos; ROCHA, J.J. de L.; SILVA, J.V. Fatores abióticos no crescimento e florescimento das plantas. Research, Society and Development, v.10, e19710413817, 2021. DOI: https://doi.org/10.33448/rsd-v10i4.13817
» https://doi.org/10.33448/rsd-v10i4.13817 -
SUAREZ, F.; BRUNO, C.; GIANNINI, F.K.; GIMÉNEZ PECCI, M.P.; PARDINA, P.R.; BALZARINI, M. Marriage between variable selection and prediction methods to model plant disease risk. European Journal of Agronomy, v.151, art.126995, 2023. DOI: https://doi.org/10.1016/j.eja.2023.126995
» https://doi.org/10.1016/j.eja.2023.126995 - TECNOLOGIAS de produção de soja - Região Central do Brasil 2014. Londrina: Embrapa Soja, 2013. 265p.
-
TEIXEIRA, G.C. da S.; STONE, L.F.; HEINEMANN, A.B. Eficiência do uso da radiação solar e índices morfofisiológicos em cultivares de feijoeiro. Pesquisa Agropecuária Tropical, v.45, p.9-17, 2015. https://doi.org/10.1590/1983-40632015v4528297
» https://doi.org/10.1590/1983-40632015v4528297 -
VON BLOH, M.; NÓIA JÚNIOR, R. de S.; WANGERPOHL, X.; SALTIK, A.O.; HALLER, V.; KAISER, L.; ASSENG, S. Machine learning for soybean yield forecasting in Brazil. Agricultural and Forest Meteorology, v.341, art.109670, 2023. DOI: https://doi.org/10.1016/j.agrformet.2023.109670
» https://doi.org/10.1016/j.agrformet.2023.109670
-
Chief editor:
Edemar Corazza
-
Edited by:
Maria José dos Reis