
 Offshore wave climate of the Pará-Maranhão Basin, Amazonian continental shelf
Abstract
This study assesses the offshore wave climate of the Pará-Maranhão Basin on the Amazonian continental shelf, a crucial region for its environmental and economic activities, including fishing and extractive activities, potential oil exploration, and complex landscape marked by extensive mangrove systems comprising protected areas and touristic coastal cities in an accelerated stage of development that face significant challenges with coastal erosion. Despite the region’s relevance, studies on wave climate are scarce. To address this gap, this research provides a detailed assessment of the offshore wave climate of the North Brazilian Coast, particularly the Pará-Maranhão sector. This quantitative assessment allowed a comprehensive characterization of the wave climate in the region. Such detailed understanding is essential for various stakeholders involved in coastal management, marine transportation and environmental protective initiatives. To do so, long-term (27-year) datasets of wave parameters (Hs, Tp, DirTp) were analyzed by bivariate histograms, using WAVERYS model, which after an in-depth comparison with ERA-5 and WW3 was found to represent local wave conditions most accurately. The study’s results also showed the greatest joint occurrence of waves is observed when peak periods vary between six and eight seconds, predominantly originating from the east-northeast (ENE) to the east-southeast (ESE) directions (local wind-generated waves associated with trade winds), accounted for approximately 41% of occurrences, with higher occurrences from E (25%). Additionally, waves with peak periods longer than 20 seconds predominantly originate from directions spanning north-northeast (NNE) to east-northeast (ENE) (swell waves from the Northern Hemisphere). Moreover, this study holds the promise for replication in other regions with similar data constraints and can contribute to the future implementation of a refraction-diffraction model, essential for the design of coastal infrastructures. Thus, subsidizing informed decision-making for sustainable coastal development in the Amazon littoral.
Keywords:
Wave climate; Global wave models; Amazonian coast; Brazilian equatorial margin
INTRODUCTION
Understanding the wave climate in the North of Brazil is crucial for various socio-economic and environmental reasons. The coastal areas of this region are vulnerable to the impacts of changing wave patterns, including coastal erosion, flooding, and habitat alteration. Additionally, the wave climate directly influences activities such as fisheries, tourism, and coastal infrastructure development. The wave climate is also important to solve ocean and coastal engineering issues, such as protection from coastal erosion and coastal restoration, damaging the structures in the shoreline and in the offshore region, preventing coastal flooding, and protection of the natural ecosystems. Wave climate studies are crucial for both engineering and scientific purposes, including the design of oil platforms, piers, and harbors, as well as analyzing coastal dynamics. The latter is especially important for developing effective nature-based solutions in coastal areas, as it informs strategies to enhance ecosystem resilience and adaptation to changing wave patterns due to climate change.
Wave climate information can be obtained from different sources, such as numerical models, in situ or satellite observations, and even visual observations conducted on the coast or in the ocean, on ships.
Several studies related to wave climatology are based on global numerical models properly validated. It can be validated using in situ data collected from wavemeters or radar altimeters from satellites (Young, 1999; Gorman et al., 2003a, 2003b; Alves, 2006; Cotrim, et al. 2022; Lionello et al., 2008; Rusu et al., 2008; Waters et al., 2009; Dodet et al., 2010; Coggins et al., 2016; Jiang, 2020; Kong et al., 2024; Salimbeni et al., 2024).
Studies on wind-generated gravity waves have been reported in the Brazilian Equatorial Margin and surrounding areas, most of them using global models (Branco, 2005; Gratiot et al., 2007; Ribeiro et al., 2009; Pianca, et al., 2010; Guerreiro et al., 2020, Reis et al., 2024). Most studies using observed data were done in the Ceará State (Silva et al., 2011; Farias et al. 2012; Fisch, 2008; Candella, 2019). Fisch (2008) developed a classification of three main types of sea states for the Ceará coast, namely: sea states associated with local winds; sea states associated with trade wind regimes, which are divided into SE and NE trade winds; and sea states associated with long distance storms (dispersive arrivals).
Guerreiro et al. (2020) studied the temporal variation of wave spectra using 38 years modeled dataset generated by the ERA-Interim model, off the coast of the Pará State, for a water depth of 70 meters, and performed in situ measurements along the coast. The authors proposed the Brazilian Equatorial Margin region is influenced by three different wave systems which have well-defined spectral characteristics: swell field originated in the Northern Hemisphere with N-NE direction, combined with waves generated by local wind that occurs from January to May; wave systems are associated only with the local wind with NE-E-SE direction that occurs during the Northern Hemisphere (NH) summer and fall (June to December); and bimodal wave field (wind sea and swell), in which the swells from NNW and NNE are more energetic between October and December. Spring (NH fall, from September to December) has the influence of the local wind with the North swell, also shown by Branco (2005). During the NH spring and summer, the swell decreases and the local wind intensifies.
Eleven years datasets from the reanalysis of the NWW3 operational model were used to analyze the wave climate along the whole Brazilian coast (Pianca et al., 2010). The wave climate of the Brazilian continental shelf edge was divided into six distinct sectors and the statistics of the wave in the North of Brazil, in deep water, were showed in a directional histogram format. The bivariate histograms of the significant height versus direction (Hs x Dir) and peak period of the wave versus direction (Tp x Dir) are on the lab website (http://ldc.io.usp.br/waves) with 45-degree directional resolution. However, the modelled data is validated using measured data only for the southern region of Brazil, where the wave generation processes are related to meteorological systems that occur in the South Atlantic. The waves in the Brazilian Equatorial Margin have no influence from the South Atlantic and are over influence of the North Atlantic systems. Model validation remains necessary due to the limited observational data available for the Pará-Maranhão Basin.
The bivariate histograms of significant wave height versus peak direction (Hs x DirTp) and peak period versus peak direction (Tp x DirTp) have not been thoroughly studied for the Pará-Maranhão Basin. Precision of wave origin is limited because current wave studies in this region utilized only eight directional intervals (Branco, 2005; Gratiot et al., 2007; Ribeiro et al., 2009; Pianca, et al., 2010; Guerreiro et al., 2020), requiring more detailed directional resolution for accurate identification.
This paper contributes to the understanding of wave climate in the northern region of Brazil by providing validated long-term hourly time series of modelled sea state parameters. Additionally, it identifies the global wave model that best represents the wave conditions in this specific region. By doing so, the research enhances our knowledge of the oceanic dynamics in this area.
Study area
The Northeastern coast of the Pará State, located in the Northern Brazilian coast, is locally known as Salgado Paraense, and the Northwest of the Maranhão State is known as Reentrâncias Maranhenses. This coastline, situated in the equatorial region, is highly indented due to large tidal ranges. It is characterized by a unique set of incised valleys that give a jagged characteristic to the coastline. Within this coastal zone lies the world’s largest continuous mangrove forest, which has approximately 7,500 km2 (Souza-Filho, 2003) in addition to extensive macrotidal sandy beaches. It also hosts the touristic cities of Salinópolis-PA and Bragança-PA (Figure 1), both of which are vulnerable to intense erosional processes (Braga et al., 2019; Souza-Filho and Paradella, 2003). Recent studies on these erosive processes have been conducted by the Environmental Hydraulics Laboratory – HIDROLAB team at the Federal University of Pará, Campus Salinópolis.
To better understand and address these erosional processes, and for the possible installation of infrastructure for oil production, it is essential to analyze the wave climate along the Equatorial Margin, off the coast of Pará-Maranhão. Investigating this wave climate is essential to understand the mechanisms driving coastal erosion in the region and can play a key role in developing strategies for its prevention, mitigation, and protection.
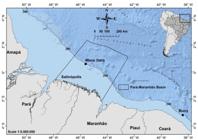
Location of the Ceara buoy for comparisons with different wave modeled datasets, as well as the selected point for the intended characterization, in front of Salinópolis.
The waves in the Ceará coast, northeast of Brazil, are generated by four distinguished wind sources (Candella, 2019). This author found the southeast direction is the most frequent one, mainly from June to November due to the intensification of the Southeast trade wind system. However, long waves arrivals from the north of the North Atlantic were also identified.
Alves (2006) showed a method to define oceanic storm generation areas using historical data combined with tracking atlases of extratropical storms, hurricanes, and tropical cyclones between 1971 and 2000. The former study defined three distinct storm generation areas for the Atlantic Ocean that directly influence the wave climate of the Brazilian Equatorial Margin: Tropical North Atlantic (TNAO), Tropical South Atlantic (TSAO), and Extratropical North Atlantic (ETNA) (Figure 2).
This study aims to describe the wave climate in the Brazilian Equatorial Margin, more specifically for the region located off the coasts of Pará and Maranhão States (Figure 1), using time series of the WAVERYS model. First, the paper presents the results of the statistical analyses used to define the best model to represent the wave climate of the region via comparison against the wave data from the Ceará buoy. Then, to characterize the offshore region of Pará and Maranhão States, 27 years of wave data were grouped into bivariate histograms of significant height (Hs), peak period (Tp) and peak direction (DirTp). The results were then analyzed considering the wind regime that influences the wave generation in the region.

Storm generation areas that influence on the wave climate in Brazilian Equatorial Margin: Tropical North Atlantic (TNAO), Tropical South Atlantic (TSAO), and Extratropical North Atlantic (ETNA) (adapted from Alves, 2006).
METHODS
The first part of this study compares wave data measured by the Ceará buoy and three sets of wave data for the same location. Table 1 details the characteristics generated by the best-known models: WAVERYS, from Copernicus, European Union’s Earth Observation Program; ERA-5, from European Environmental Agency (European Center for Medium-Range Weather Forecast -ECMWF); and WAVEWATCH III, from NOAA’s National Centers for Environmental Prediction (NCEP).
The Ceará buoy is part of the National Buoy Plan, PNBOIA, conducted by the Brazilian Navy. This is a 3M Axis buoy (Argos ID: 146448; WMO ID: 31229) operating at coordinates 3° 12.6’ S and 38° 26.4’ W, over 200 meters water depth, gathering each three hours. The time series obtained from January 1st to December 4th, 2017 were used in this study.
As the only wave measurement is more than 1,000 km apart from the area of interest, it was decided to evaluate which most used global wave model best represents the sea states in the region, by validating the model for the Ceará position with data from the Ceará buoy, assuming the waves in Pará-Maranhão Basin, in deep waters, are somewhat similar, since they are generated by the same wind regimes.
Figures 3, 4, 5 show the time series used, Hs, Tp, and DirTp measured by the Ceará buoy over 2017, from January to November. Time series of these parameters were also obtained from the NWW3, ERA5, and WAVERYS models for the grid node closest to the buoy location. The aim was to evaluate which model has statistically more consistent results with those of the buoy. The comparison process is based on statistical evaluation of similarity between the simultaneous wave parameters obtained by the buoy and by the three models.
The statistical analyses were made via the equations one to seven showed above, in which corresponds to the instantaneous values of the variables measured by the Ceará buoy, and, is the modeled values while, is the total number of observations. The is the mean over the entire time series of each wave parameter measured by the buoy (Equation 2) and the by the model (Equation 1). (Equation 3) is the mean of the error in which a value close to zero indicates better results. Negative mean values indicate the model underestimates the measured parameters, and positive values, the opposite. Equation 4 shows the Root Mean Square Error (). This is the standard deviation of the simulation errors or residuals. It indicates how widespread they are. The Scatter Index () is a normalized measure of error (Equation 5). Lower values are an indication of better model performance. The term (Equation 6) is Pierson’s Correlation Coefficient and the higher correlation is 1 or −1. The term (Equation 7), proposed by Hanna and Heinold (1985) (apud Mentaschi et al., 2013), indicates that when the Bias (which can assume both positive and negative values) approaches to zero, HH assumes minimum values and the simulation is more accurate.
The analysis of the wave climate at the Pará Maranhão Basin point used a long-term time series, from 1993 to 2019, of wave parameters (Hs, Tp, and DirTp) generated by the best-fit model. The information was grouped as bivariate histograms of Tp x DirTp, Hs x DirTp, and Hs x Tp.
RESULTS
This section is divided in subtopics. First, it shows the statistical results of the best fit global wave model for the region. Then, the results of the regional offshore wave climate and the wind fields are shown.
Best fit model
Figures 3, 4, 5 show the time series of Hs, Tp, and DirTp measured by the Ceará buoy and WAVERYS model. They were compared with similar series generated by the WAVERYS, ERA5, and NWW3 models for the same location. Table 2 shows the statistical parameters to validate the models.
All models had values of Hs (Bias 0.02m to 0.08m) and Tp (Bias 0.60s to 0.81s) slightly higher than those measured by the buoy (Table 2). Regarding the direction of the peak period, the WAVERYS and ERA5 models showed mean values towards the East compared to the buoy ones (Bias 1.68o and 6.57o, respectively). However, NWW3 had the opposite behavior, the simulated peak direction values by this model indicated more waves came from the North (Bias −10.12o) when compared to the buoy data.
Overall, the results of the WAVERYS model (also plotted in Figures 3, 4, 5) had better performance when compared with the parameters measured by the Ceará buoy. The Scatter Index (SI) of Hs and DirTp series simulated by the WAVERYS model were significantly lower than those of ERA5 and NWW3 (Table 2). Only the SI of the peak period series was slightly higher in WAVERYS than in ERA5 (0.21 versus 0.20, respectively). However, the correlation coefficients (r) between the series measured by the buoy and those modeled by WAVERYS were significantly higher than the others. For Hs and DirTp, they were 0.92 and 0.97 respectively, which configures high similarity between the series.

Time series of significant height (Hs) measured by the Ceará Buoy (black) and WAVERYS modeled (red).

Time series of peak period (Tp) measured by the Ceará Buoy (black) and WAVERYS modeled (red).

Time series of peak direction (DirTp) measured by the Ceará Buoy (black) and WAVERYS modeled (red).
Statistical comparison between measured wave parameters from the Ceará buoy and modelled from WAVERYS, ERA5, and NWW3.
The correlation between the peak period of the wave estimated by WAVERYS and the buoy is r=0.85, although it is the model that best represents this parameter. The issue may not be the quality of the information itself but in the way that the peak frequency is calculated. In multimodal sea states, for example, the Tp can change instantaneously if the energy of a peak exceeds another just as a function of the degrees of freedom adopted in the smoothing of the spectrum. Therefore, this lower correlation between the measured and modeled Tp, observed in all three models, is expected.
The HH coefficient showed consistency with the other parameters (Table 2). The values for the WAVERYS model were the lowest for Hs and DirTp, indicating the superiority of this model to reproduce the wave field in study area. For Tp, the ERA5 model had similar HH to the WAVERYS model.
Based on the overall evaluation of the performance indicators above, the best fit model is the WAVERYS model. Thus, the use of this database is recommended as boundary conditions for future coastal modelling studies.
Offshore Wave Climate of Pará-Maranhão States, Brazilian Equatorial Margin
Once the WAVERYS model had better correlation with the parameters measured by the Ceará buoy, its long-term time series (27 years, from 1993 to 2019) of wave parameters (Hs, Tp, and DirTp) were used for the analysis of the wave climate at the Pará Maranhão Basin point. The information was grouped as bivariate histograms of Tp x DirTp, Hs x DirTp, and Hs x Tp (Tables 3, 4, 5, respectively).
Table 3 shows the bivariate histograms of peak period (Tp) and direction (DirTp) of waves for 27 years of the simulated data at the study area. The waves with the longest peak periods (Max Tp), greater than 20 seconds, came from directions ranging from N to ENE, with a maximum of 23.0 seconds coming from NNE and 1.3 meters height (Table 5).
The highest occurrence between Tp and DirTp occurred with peak periods varying between six and seven seconds (Table 3), with the peak period direction from E (15.55%), followed by waves between seven and eight seconds, also from E (9.55%). The peak direction distribution shows that 33.70% of the waves came from E, followed by ENE with 20.25%.
The distribution of peak direction shows that waves coming from NNW and N have longer periods, mean of 16.0 and 13.7 seconds respectively, than waves coming from E Quadrant, mean of 7.1 seconds (Table 3).
Peak period, Tp (s), versus peak direction, DirTp (o), bivariate histograms of waves for 27 years simulated data using WAVERYS model at the location shown in Figure 1.
The distribution of the peak periods shows waves with six to seven seconds predominated (23.04%), with an average direction of 91o (Table 3). However, waves with peak periods ranging from seven to ten seconds were also significant, with mean directions tending to NE as the peak period increased. About 70% of the waves had peak periods between six and ten seconds. Waves longer than 10 seconds vary from NE to NNE as the peak period increased.
Table 5 shows the peak period (Tp) versus significant wave height (Hs) bivariate histograms of waves for the 27 years of simulated data. The highest occurrence of significant height and peak period occurred between 1.5 and 2.0 meters in height and a period between six and seven seconds (17.165%).
Significant height, Hs (m), versus peak direction, DirTp (o), bivariate histograms of waves for 27 years simulated data at the location.
Table 4 shows the significant height (Hs) versus peak direction (DirTp) bivariate histograms for 27 years simulated records at the location. The waves are relatively low, about 85.38% of the waves have a significant height between 1.0 and 2.0 meters, with more than half (52.03%) between 1.5 and 2.0 meters. The highest occurrence was 1.5 to 2.0 meters high, coming from E (19.99%).
The distribution (Table 5) shows that the mean wave periods varied from nine to ten seconds in most of the ranges of significant height. The waves with a significant height of 3.0 meters had peak periods from eight to nine seconds and from 18 to 19 seconds. Likewise, the distribution of Tp shows the mean significant height in all period ranges varied from 0.8 to 1.8 meters.
Regarding the mean wind fields, the results showed that over the less rainy (dry) season (Sep - Oct), the mean trade wind speed of 6.8 m/s from ENE (67.5°−90°) direction prevails as the ITCZ reaches its northern position. However, over the rainy season (Mar – Apr), the mean trade wind speed of 5.3 m/s from NE (45°−67.5°) direction prevails as the ITCZ moves to its southern position.
Peak period, Tp (s), versus significant height, Hs (m), bivariate histogram of waves for 27 years of simulated records at the location.
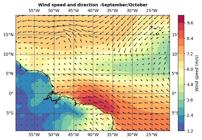
Mean wind field in the Equatorial Region of the Atlantic Ocean for September and October 2017, in which the ITCZ is further north (ERA Interim dataset, ECMWF).

Mean Wind Field in the equatorial region of the Atlantic for March and April 2017, periods in which the ITCZ is further south (ERA Interim dataset, ECMWF).
DISCUSSION
The study analyzed three widely used global wave models, WAVERYS, ERA5, and WAVEWATCH III, to identify which model best represents wave conditions in the Pará-Maranhão Basin. Among these, the WAVERYS model emerged as the best fit, showing superior performance across key statistical parameters (Bias, RMSE, SI, R, HH) when compared to the Ceará buoy (Table 1). Furthermore, WAVERYS provides high spatial resolution and the same temporal resolution as the Ceará buoy.
In terms of wave climatology, our results indicated maximum peak periods of 23.0 seconds originating from the NNE, whereas Pianca et al. (2010) reported maximum peak periods of 18 seconds for waves coming from the North. Differences in the peak direction results may be attributed to the earlier study using only eight directional intervals, whereas this study employs a more detailed approach with 16 intervals. The maximum peak period, however, was significantly shorter than what is showed here. A total of 226 waves (0.28%) had periods greater than 18 seconds in the simulation.
This study shows that approximately 10% of the waves originate from ESE and SE, differing from the findings of Pianca et al. (2010), which indicate a higher percentage of waves (28.87%) coming from SE. This discrepancy may suggest that one of the models (NWW3 or WAVERYS) was unable to accurately reproduce the wave field from that direction. Another difference is that the largest waves in this study originated from N to ESE, with heights ranging between 2.8 and 3.0 meters. In contrast, Pianca et al. (2010) reported significantly higher maximum wave heights of 3.5 to 4.0 meters from N and NE. Despite the differences in directional range, the overall results align with the wave climate previously described for the studied area by Pianca et al. (2010).
The results for the distribution of peak wave directions, with waves originating from NNW and N with longer mean periods of 16.0 and 13.7 seconds, respectively, are consistent with the observed by Candella (2019). The study analyzed swells in the Equatorial Atlantic during the NH winter and spring, which were generated by storms and hurricanes in the Northern Hemisphere.
Extratropical North Atlantic (ETNA) swells are predominantly restricted to northern latitudes during the Northern Hemisphere (NH) summer (Alves, 2006). Tropical storms originating in the Tropical North Atlantic Ocean (TNAO) rarely propagate extensively across the ocean during this season, resulting in minimal impact on the Brazilian Equatorial Margin. During the NH winter, intense storms can develop near the pronounced surface temperature gradients along the Gulf Stream. The eastward-propagating storms occur in the northern TNAO, generating waves that travel southward and southeastward across the North Atlantic. The TNAO has its maximum storm activity increasing from fall to winter (Branco, 2005). These swells result from the occasional displacement of the extratropical storms from higher latitudes, which are generally in the final stages of their life cycle. Such waves reach the entire Brazilian Equatorial Margin with significant heights varying 1.5 to 2.0 meters and peak periods from six to seven seconds at the studied area (Table 5).
The peak periods of the waves, during the NH spring and summer, are lower compared to the NH fall and winter (Figure 4). The highest swells originating from the ETNA in the TNAO occur during the HN winter. During this season, ETNA contributes to a mean significant wave height (Hs) of 1.0 meter along the Brazilian Equatorial Margin. In contrast, during the NH summer, the area influenced by ETNA-generated storms decreases, along with the significant wave heights reaching the Brazilian Equatorial Margin. In the NH fall and winter, the mean peak wave period reaches approximately 14 seconds. Conversely, during the NH spring and summer, the mean peak periods reduce to 11 and 10 seconds, respectively (Branco, 2005).
The ESE and E-trade winds from the TSAO generated waves that propagate to the Brazilian Equatorial Margin. During the Southern Hemisphere (SH) winter and spring seasons (dry in the Brazilian Equatorial Margin) the Intertropical Convergency Zone (ITCZ) remains in the Northern Hemisphere. Persistent ESE (90°-112°) winds produce the wind sea waves that arrive frequently in the Brazilian Equatorian margin (Figure 6). The winds are more intense and constant during the SH winter and spring (Alves, 2006; Branco, 2005). The same occurs with waves generated in the TNAO region, considering the most frequent NNE, NE, and ENE trade winds during the SH summer and fall (Figure 7). The HN winter and spring, coincide with the rainy season along the Brazilian Equatorial Margin, the Intertropical Convergence Zone (ITCZ) remains positioned in the Southern Hemisphere. During this period, persistent winds from the NNE, NE, and ENE generate wind seas and swells that frequently impact the Pará-Maranhão coast (Echevarria et al., 2019; Guerreiro et al., 2020; Lobeto et al., 2022; Young, 1999).
Tropical Atlantic warmer Sea Surface Temperature (SST) over the TNAO, and cooler over the TSAO, in the Brazilian Equatorial Margin are associated with weaker northward trade winds (Nobre and Shukla, 1996). Conversely, when cooler and warmer SST are observed over TNAO and TSAO, respectively, the trade winds are stronger, and the Brazilian Equatorial Margin experiences a southward wind direction. However, it is suggested that the northward displacement of the Intertropical Convergence Zone (ITCZ) is linked to a strengthening of the southeast trade winds and a weakening of the northeast trade winds. Such changes are correlated with an increase in rainfall in the Sahel region and a decrease in the northern and northeastern parts of Brazil. Conversely, a southward shift in the ITCZ results in the opposite effects. This behavior is widely recognized and indicates the interannual fluctuations in the SST signal in the Eastern Tropical Atlantic Ocean, referred to as the Equatorial Margin, are directly linked to a significant amount of interannual variability in the wind signal in the western region (Servain and Legler, 1986).
CONCLUSIONS
This study contributes significantly to understand the wave climate of the Pará-Maranhão Basin in northern Brazil, providing a detailed and unprecedented analysis of a region that is still relatively underexplored in terms of wave climatology. The region not only attracts interest from oil companies due to its exploration potential but also faces critical challenges, such as coastal erosion.
This research is particularly significant as it aids in understanding wave climatology in areas in which observational data is scarce, yet crucial for generating design parameters in ocean and coastal engineering and other related endeavors. It also underscores the importance of implementing continuous wave monitoring systems in the region.
The identification of WAVERYS as the best fit model for representing local wave conditions strengthens the reliability of the findings and provides a robust foundation for future research in the area, such as the development of wave refraction-diffraction models.
Via the analysis of 27 years’ worth of wave data from the WAVERYS model, we employed bivariate histograms of significant height, peak period, and peak direction. Based on the analysis of the wave time series, several significant conclusions can be drawn. Firstly, the highest joint occurrence of waves occurs when peak periods vary between six and eight seconds, predominantly originating from the east-northeast to the east-southeast directions, comprising approximately 41% of the occurrences, predominating the east direction (25%). These findings indicate that waves in this region are primarily influenced by trade winds, which locally assume east and east-northeast directions. Furthermore, the analysis reveals that a substantial majority, approximately 85%, of the waves have significant heights ranging between 1.0 and 2.0 meters, which indicates a consistent wave height regime within this range.
Additionally, waves with peak periods longer than 20 seconds predominantly originate from directions ranging from north to east-northeast. The longest peak period observed was 23 seconds, originating from the north-northeast direction, with a corresponding wave height of 1.3 meters.
Such findings have substantial practical applications, since the detailed wave climate information can guide the design of structured and unstructured coastal defenses, such as seawalls, breakwaters and/or coastal nature-based solutions, among others. Especially in areas that are prone to erosion, such as some beaches from Salinópolis-PA and Bragança-PA. Furthermore, the results are important information for various maritime and coastal activities, including navigation, water sports, and risk assessment.
Therefore, by offering a comprehensive description of the prevailing wave patterns in the Brazilian Equatorial Margin region, this study lays the groundwork for informed decision-making and supports the sustainable development of the Amazonian coastal cities.
Data availability statement
Ceará Buoy
ERA5
https://cds.climate.copernicus.eu/datasets/reanalysis-era5-land?tab=download
WAVERYS
WAVEWATCH III
https://polar.ncep.noaa.gov/waves/ensemble/download.shtml
Supplementary material
This article does not include any supplementary materials.
Funding
The authors are grateful to the Fundação Amazônia de Amparo a Estudos e Pesquisas (FAPESPA) for the financial support and to the Fundação de Amparo e Desenvolvimento da Pesquisa (FADESP) for the management of the research Project “Subsidies for the Execution of Coastal Restoration Works and Infrastructure Implementation for the Sustainable Tourism Development of Salinópolis, PA” (Proc. 2019/307839; Agreement 015/2019) developed by HIDROLAB’s team.
Acknowledgments
The authors are grateful to the Brazilian Navy for providing the buoy data.
REFERENCES
-
Alves, J. H. G. M. 2006. Numerical Modelling of Ocean Swell Contributions to the Global Wind-Wave Climate. Ocean Modelling, 11, 98–122. DOI: https://doi.org/10.1016/j.ocemod.2004.11.007
» https://doi.org/10.1016/j.ocemod.2004.11.007 -
Branco, F. V. 2005. Contribuições de Swell Gerado em Tempestades Distantes para o Clima de Ondas na Costa Brasileira (Dissertation). São Paulo: Universidade de São Paulo. 137p. Available in: https://repositorio.usp.br/item/001503271 . Access date: 2023 May 30.
» https://repositorio.usp.br/item/001503271 -
Braga, R. C., Pimentel, M. A. S., Coelho, C., Szlafsztein, C. F. & Rollnic, M. 2019. Vulnerabilidade diante da ação energética do mar: Estudo de caso no Município de Salinópolis, Zona Costeira Amazônica. Revista de Gestão Costeira Integrada, 19(4), 245–264. DOI: https://doi.org/10.5894/rgci-n219
» https://doi.org/10.5894/rgci-n219 -
Camus, P., Cofiño, A. S., Méndez, F. J. & Medina, R. 2011. Multivariate wave climate using self-organizing maps. Journal of Atmospheric and Oceanic Technology, 28(11), 1554–1568. DOI: https://doi.org/10.1175/JTECH-D-11-00027.1
» https://doi.org/10.1175/JTECH-D-11-00027.1 -
Candella, R. N. 2019. Characteristics of ocean waves off Fortaleza, CE, Brazil, extracted from 1-year deep-water measured data. Ocean Dynamics, 69, 1239–1251. DOI: https://doi.org/10.1007/s10236-019-01293-z
» https://doi.org/10.1007/s10236-019-01293-z -
Coggins, J. H. J., Parsonsa, S. & Schielb, D. 2016. An assessment of the ocean wave climate of New Zealand as represented in Kidson’s synoptic types. International Journal of Climatology, (36), 2481–2496. DOI: https://doi.org/10.1002/joc.4507
» https://doi.org/10.1002/joc.4507 -
Cotrim, C. d. S., Semedo, A. & Lemos, G. 2022. Brazil Wave Climate from a High-Resolution Wave Hindcast. Climate, 10, 53. DOI: https://doi.org/10.3390/cli10040053
» https://doi.org/10.3390/cli10040053 -
Dodet, G., Bertin, X. & Taborda, R. 2010. Wave climate variability in the North-East Atlantic Ocean over the last six decades. Ocean Modelling, 31, 120–131. DOI: https://doi.org/10.1016/J.OCEMOD.2009.10.010
» https://doi.org/10.1016/J.OCEMOD.2009.10.010 -
Echevarria, E. R., Hemer, M. A. & Holbrook, N. J. 2019. Seasonal Variability of the Global Spectral Wind Wave Climate. Journal of Geophysical Research: Oceans, 124 (4), 2924–2939. DOI: ( https://doi.org/10.1029/2018JC014620 )
» https://doi.org/10.1029/2018JC014620) -
Farias, E. G. G. & Souza, J. M. A. C. 2012. Chegada Dispersiva de Campos de Ondas Swell na Costa Oeste do Estado Ceará – Brasil. Arquivos de Ciências do Mar, 45(1), 69–74. DOI: https://doi.org/10.32360/acmar.v45i1.145
» https://doi.org/10.32360/acmar.v45i1.145 -
Fisch, C. L. 2008. Caracterização do Clima de Ondas na Costa do Ceará (Dissertation). Rio de Janeiro: Federal University of Rio de Janeiro. 118p. Available in: https://minerva.ufrj.br/F/?func=direct&doc_number=000699242&local_base=UFR01 , Access Date: 2023 Apr. 05.
» https://minerva.ufrj.br/F/?func=direct&doc_number=000699242&local_base=UFR01 -
Gorman, R. M., Bryan, K. R. & Laing, A. K. 2003. Wave hindcast for the New Zealand region: Nearshore validation and coastal wave climate. New Zealand Journal of Marine and Freshwater Research, (37) 567–588. DOI: 10.1080/00288330.2003.9517190
» https://doi.org/10.1080/00288330.2003.9517190 -
Gorman, R. M., Bryan, K. R. & Laing, A. K. 2003. Wave hindcast for the New Zealand region: Deep‐water wave climate. New Zealand Journal of Marine and Freshwater Research, (37) 589–612. DOI: https://doi.org/10.1080/00288330.2003.9517191
» https://doi.org/10.1080/00288330.2003.9517191 -
Gratiot, N., Gardel, A. & Anthony, E. 2007. Trade-wind waves and mud dynamics on the French Guiana coast, South America: input from ERA-40 wave data and field investigations. Marine Geology, (236), 15–26. DOI: https://doi.org/10.1016/J.MARGEO.2006.09.013
» https://doi.org/10.1016/J.MARGEO.2006.09.013 -
Guerreiro, J. S., Souza, E. B. & El-Robrini, M. 2020. Variability of Wave Spectra Conditions in the Amazon Barrier Coast. Journal of Coastal Research, 95, 1411–1415. DOI: https://doi.org/10.2112/SI95-273.1
» https://doi.org/10.2112/SI95-273.1 - Hanna, S. & Heinold, D. 1985. Development and application of a simple method for evaluating air quality. In: API Pub. No. 4409, Washington, DC.
-
Jiang, H. 2020. Wave Climate Patterns from Spatial Tracking of Global Long-Term Ocean Wave Spectra. Journal of Climate, (33), 3381–3393. DOI: https://doi.org/10.1175/JCLI-D-19-0729.1
» https://doi.org/10.1175/JCLI-D-19-0729.1 -
Lionello, P., Cogo, S., Galati, M. B. & Sanna, A. 2008. The Mediterranean surface wave climate inferred from future scenario simulations. Global and Planetary Change, (63), 152–162. DOI: https://doi.org/10.1016/J.GLOPLACHA.2008.03.004
» https://doi.org/10.1016/J.GLOPLACHA.2008.03.004 - Lobeto, H., Menendez, M., Losada, I. J. & Hemer, M. 2022. The effect of climate change on wind-wave directional spectra. Global and Planetary Change, 213.
-
Mentaschi, L., Besio, G., Cassola, F., Mazzino, A. 2013. Problems in RMSE-based wave model validations. Ocean Modelling, 72, 53–58. DOI: https://doi.org/10.1016/j.ocemod.2013.08.003
» https://doi.org/10.1016/j.ocemod.2013.08.003 -
Nobre, P. & Shukla, J. 1996. Variations of Sea Surface Temperature, Wind Stress, and Rainfall over the Tropical Atlantic and South American. Journal of Climate, 9, 2464–2479. DOI: ( https://doi.org/10.1175/1520-0442(1996)009%3c2464:VOSSTW%3e2.0.CO;2 )
» https://doi.org/10.1175/1520-0442(1996)009 -
Pianca, C., Mazzini, P. L. F. & Siegle, E. 2010. Brazilian Offshore Wave Climate Based on NWW3 Reanalysis. Brazilian Journal of Oceanography, 58(1), 53–70. DOI: https://doi.org/10.1590/S1679-87592010000100006
» https://doi.org/10.1590/S1679-87592010000100006 -
Reis, B. L. R., Parise, C. K., Correia, G. S., LIMA, L. G., Perotto, H., BOSE, N. A. & Mendionça, L. F. 2024. The bimodal regime of ocean waves and winds over the continental shelf of Maranhão. Regional Studies in Marine Science, 77. DOI: https://doi.org/10.1016/j.rsma.2024.103629
» https://doi.org/10.1016/j.rsma.2024.103629 - Ribeiro, E. O., Andrioni, M., Martins, R. P. & Grossmann-Matheson, G. 2009. Climatologically Modeled Wave Field Analyses in the Western South Atlantic. Proceedings of the ASME 28th International Conference on Ocean, Offshore and Arctic Engineering, OMAE2009. May 31- June 5, 2009, Honolulu, Hawaii.
-
Rusu, L., Pilar, P. & Guedes Soares, C. 2008. Hindcast of the wave conditions along the west Iberian coast. Coastal Engineering, (55), 906–919. DOI: https://doi.org/10.1016/j.coastaleng.2008.02.029
» https://doi.org/10.1016/j.coastaleng.2008.02.029 -
Salimbeni, A., Dragani, W. & Alonso, G. 2024. Ocean waves in the southwestern Atlantic Ocean: An evaluation of global wave models. International Journal of Climatology, 44(I), 899–841. DOI: https://doi.org/10.1002/joc.8477
» https://doi.org/10.1002/joc.8477 - Servain, J. & Merle, J. 1993. Interannual Climate Variations Over the Tropical Atlantic Ocean BT - Prediction of Interannual Climate Variations. Berlin: Springer. p. 153–172.
-
Servain, J., Clauzet, G. & Wainer, I. C. 2003. Modes of tropical Atlantic climate variability observed by PIRATA. Geophysical Research Letters, 30(5). DOI: ( http://doi.org/10.1029/2002GL015124 )
» https://doi.org/10.1029/2002GL015124) -
Servain, J. & Legler, D. M. 1986. Empirical orthogonal function analyses of tropical Atlantic sea surface temperature and wind stress: 1964–1979. Journal of Geophysical Research: Oceans, 91(C12), 14181–14191. DOI: https://doi.org/10.1029/JC091iC12p14181
» https://doi.org/10.1029/JC091iC12p14181 -
Silva, A. C., Façanha, P., Bezerra, C., Araujo, A. & Pitombeiras, E. 2011. Características das Ondas “Sea” e “Swell” Observadas no Litoral do Ceará-Brasil: Variabilidade Anual e Inter-Anual. Tropical Oceanography, 39(2), 123–132. DOI: https://doi.org/10.5914/TROPOCEAN.V39I2.5182
» https://doi.org/10.5914/TROPOCEAN.V39I2.5182 -
Souza-Filho, P. W. & Paradella, W. R. 2003. Use of synthetic aperture radar for recognition of coastal morphological features, land-use assessment and shoreline changes in Bragança coast, Northern Brazil. Anais da Academia Brasileira de Ciências, 75(3), 341–356. DOI: https://doi.org/10.1590/S0001-37652003000300007
» https://doi.org/10.1590/S0001-37652003000300007 -
Waters, R., Engström, J., Isberg, J. & Leijon, M. 2009. Wave climate off the Swedish west coast. Renewable Energy, (34), 1600–1606. DOI: https://doi.org/10.1016/j.renene.2008.11.016
» https://doi.org/10.1016/j.renene.2008.11.016 -
Young, I. R. 1999. Seasonal variability of the global ocean wind and wave climate. International Journal of Climatology, 19(9), 931–950. DOI: ( https://doi.org/10.1002/(SICI)1097-0088(199907)19:9%3c931: :AID-JOC412%3e3.0.CO;2-O)
» https://doi.org/10.1002/(SICI)1097-0088(199907)19:9 -
Wai, K., Ching-chi, L., Dick-shum, L., Chi-kin, C., Sze-ning, C., Pak-wai, C. & Ngo-ching, L. 2024. Model validation and applications of wave and current forecasts from the Hong Kong Observatory’s Operational Marine Forecasting System. Ocean Modelling, 190. DOI: https://doi.org/10.1016/j.ocemod.2024.102393
» https://doi.org/10.1016/j.ocemod.2024.102393
-
Funding
The authors are grateful to the Fundação Amazônia de Amparo a Estudos e Pesquisas (FAPESPA) for the financial support and to the Fundação de Amparo e Desenvolvimento da Pesquisa (FADESP) for the management of the research Project “Subsidies for the Execution of Coastal Restoration Works and Infrastructure Implementation for the Sustainable Tourism Development of Salinópolis, PA” (Proc. 2019/307839; Agreement 015/2019) developed by HIDROLAB’s team.
Edited by
-
Editor:
Rubens Lopes


