Analysis of self-reported discard information in Uruguayan industrial trawl fisheries
Abstract
Discarding unwanted catches is a significant issue arising from marine fishing activities, with far-reaching socioeconomic and ecological consequences. Uruguayan fishery regulations fail to penalize discarding but mandate self-reporting, providing an opportunity to analyze the discard from the two Uruguayan industrial bottom trawl fleets (shelf and coastal). By examining fishing logs, discard was estimated at 3,268 tons/year, accounting for 6.5% of the total catch (9.1% for the shelf fleet and 3.7% for the coastal fleet), with no discernible temporal trends for 2016, 2017, 2019, and 2020 nor significant seasonal variations in discard magnitude. Diversity, species richness, and evenness of the discard varied between fishing seasons and years. The most discarded species were Bassanago albescens in the shelf fleet and Brevoortia aurea in the coastal fleet. Both species showed magnitudes indicating a potential for exploitation development. Discard per unit of effort was mapped by fleet, enhancing the potential for discard information reconstruction for the area and thereby facilitating its inclusion in ecological and economic assessments. Discard reports have proven to be a valuable source of information that should be integrated into fisheries conservation and management initiatives.
Keywords:
Fishing log; Eco-systemic approach; Best practices; Hairy conger; Brazilian menhaden
INTRODUCTION
Discard is the portion of the catch not kept on board during fishing operations that is returned to the sea, either dead or dying (Catchpole et al., 2005 ). This practice, a significant issue resulting from marine fishing activities (Zeller et al., 2018 ), has substantial socioeconomic and ecological impacts. Discarding is a widespread practice in many fisheries, and it is estimated to total from 10 to 20% of the world’s landed catch (Davies et al., 2009 ; Zeller et al., 2018 ), with high composition and variability of magnitude in both space and time (Kennelly and Broadhurst 2002 ; Mendo et al., 2022 ). Discard patterns are shaped by catch compositions and environmental and social factors, heavily influenced by landing restrictions and economic dynamics (Catchpole et al., 2005 ). Furthermore, discarding behavior varies based on prevailing market conditions and national regulations (Da Rocha et al., 2021 ).
Fishers might discard protected species, over-quota, or high-grade their catch by discarding lower-value species to make space for a more valuable catch, especially toward the end of a trip when hold space is limited (Gilman et al., 2020 ). Discard estimates not only facilitate studying the processes and drivers behind this practice (Rochet et al., 2002 ), but are also crucial for assessing the impact of fisheries on non-commercial species and the overall ecosystem (Punt et al., 2006 ; Damiano and Lercari, 2022 ).
International guidelines advocate for discard reduction to contribute to United Nations Sustainable Development Goal 14, which aims “to conserve and sustainably use the oceans, seas and marine resources for sustainable development.” Various strategies for reducing discard have been evaluated, including direct fishing effort limitations, gear-based selectivity measures, spatial management, and discard bans (Catchpole et al., 2005 ). Most of these regulatory strategies involve subsidizing or overseeing the fishing sector to ensure that measures are implemented (Rochet et al., 2002 ; Catchpole et al., 2005 ; Feekings et al., 2013 ; Johnsen and Eliasen, 2011 ). Discard bans, defined as the mandatory landing of all fish, are constrained by the capacity for administrative control (i.e., the extent of onboard fleet observation) and the potential to subsidize fishers landing lower-value catch. These approaches are typically unavailable or ineffective in their implementation in underdeveloped contexts as a discard ban may theoretically exist but fail to occur in practice (Catchpole et al., 2005 ).
Uruguay is presently experiencing one of the most severe crises in its fishing sector, evinced by symptoms of overexploitation in primary fishing stocks, the lowest catch rates in four decades, market shrinkage, the closure of fishing companies, and the aging of fishing vessels (Gianelli and Defeo, 2017 ; Marín et al., 2020 ). Additionally, the Southwest Atlantic encompasses one of the most extensive and most intense warming hotspots in the global ocean (Hobday and Pecl, 2014 ), with demonstrated impacts on catch composition (Gianelli et al., 2019 ). Since 1990, the Uruguayan industrial fishery primarily consists of two categories of bottom trawlers, a shelf fleet, and a coastal fleet, each targeting different species. The shelf fleet, fluctuating around 12 freezer ships, primarily targets the Argentine hake ( Merluccius hubbsi ), fishing at depths from 50 to 300 m. This fleet operates year-round, reporting higher catches in colder seasons, with temporal and spatial closures in hake juvenile aggregation areas that change annually following scientific evaluation (Marín et al., 2020 ). The coastal fleet comprises 30 smaller bottom trawlers operating in pairs from 2 to 50m depth, mainly in brackish waters, targeting whitemouth croaker ( Micropogonias furnieri ) and stripped weakfish ( Cynoscion guatucupa ). This fleet also operates year-round with higher catches in colder seasons and no spatial or temporal closures, except for a seven-mile coastal exclusion area (Marín et al., 2020 ). Both fleets are managed by national regulations concerning the number of vessels, mesh size, and spatial restrictions. Trawling exclusion zones and maximum quotas for some target species are established annually in co-management with Argentina.
Information on the magnitude or composition of discards for this fishery is limited and fragmented. In 1999, an indirect discard estimate for the coastal fleet was obtained by mimicking the behavior of the fleet using a research vessel over three consecutive months (August to October). It was assumed that both the coastal fleet and the research vessel had the same catch rates, and any differences noted between the coastal fleet landings and the catch of the research vessel were considered discards by the fleet (Rey et al., 2000 ). More recently, based on a compilation of reported commercial catch statistics (Lorenzo et al., 2015 ), information on species composition and magnitude of discards were consolidated (Rey et al., 2000 ; Kelleher, 2005 ), and a discard rate of 9% was applied to landings from all fleets for the 2001-2010 period.
This lack of information and reconstruction efforts stands in contrast with the Uruguayan management model, which mandates a legally binding obligation to declare all fishing discards and imposes no penalty for this practice in industrial fisheries (Uruguayan Parliament, 2013 ). This offers an opportunity to assess the magnitude and composition of industrial discards, analyze temporal and spatial trends, identify high biomass species with commercial potential, and improve parameter estimates for stock assessment by working directly with fishing logs. Furthermore, it also contributes to global information on fish discarding in an understudied area and exemplifies alternative regulations regarding this globally significant practice. To assess the magnitude and composition of discards on the Uruguayan industrial bottom trawl fleets for 2016, 2017, 2019, and 2020, we explored intra- and inter-annual variations, identified species with high discarded biomass, and discussed the potential impact of this information on management.
METHODS
Discard assessment relied on the fishing log data of the Uruguayan shelf and coastal fleets for 2016, 2017, 2019, and 2020. Each vessel is assigned to a fleet based on its specific license, which depends on its target species. Fishing captains are required to submit a handwritten fishing log declaration for each fishing haul when unloading the catch. This self-reported information has several data quality issues and has been extensively curated following semi-automated local standards. If a haul was located on land or too distant from adjacent hauls, its geographical position was recalculated as a straight line from the previous and subsequent hauls. The start and finish dates and times of these fishing hauls were used to calculate fishing time and check coherence with adjacent hauls. Hauls exceeding seven hours of fishing time were flagged and manually checked for coherence with adjacent haul time information. Hauls with discards exceeding 2400 kg were flagged, and the retained catch was checked to assess if the total catch was consistent with net capacities according to the fleet. Hauls with incomplete information, or when incoherent results were obtained from curation, were removed from the database.
Digitalizing and curating information is a significant bottleneck in this fishery management, and discard is rarely prioritized. Consequently, information from 2018 is yet unavailable and was excluded from this analysis. From an initial 45,580 reported hauls, 36,576 fishing hauls were analyzed after curation by fleet, year, and season: summer (January to March), autumn (April to June), winter (July to September), and spring (October to December). To provide a perspective of magnitude, discard biomass was compared with landings by year, considering seasonal variations for each fleet and the entire fishery.
To analyze discard composition, information was classified to the highest possible level of taxonomic resolution (order, family, genus, or species) in consultations with local experts on fishing operations based on the common species name provided in the fishing logs. To describe the structure of the discard, a series of statistics evaluating species richness, diversity, and evenness were calculated (Murawski, 1996 ). Richness (S) was estimated as the number of species in the discard during the period. Diversity was calculated using the Shannon-Wiener index (H’), and evenness was determined using Pielou’s J (Soykan et al., 2019 , Stergiou et al., 1997 ).
A ranking of discarded species by biomass and fleet was constructed for the entire period to identify the most discarded one. The top five discarded species remained at this aggregation level, whereas the less common species were grouped at the order or family level for display and discussion purposes. The annual discard values of the most significant species and unclassified discards were visualized to detect emerging patterns and trends. A proportional taxonomic breakdown of the discard for each fleet and the entire fishery was compared with previous information (Lorenzo et al., 2015 ). To encourage the inclusion of discard estimates in future studies in the area and facilitate more accurate reconstructions of discards from catch values, a nominal discard per unit of effort (DPUE) was calculated. Information was aggregated in squares of 0.5 degrees of latitude and longitude, and total discard was divided by total trawling hours for each fleet over the entire period.
Due to the potential bias inherent in self-reported data, statistical procedures were kept as simple as possible to support major trends while minimizing influence on result interpretation. Changes in discard composition and magnitude by year and season were evaluated by the Kruskal-Wallis test with a Mann-Whitney post hoc pairwise comparison that tested differences in S, H’, J, and biomass. Temporal trend analysis or further statistical analysis was limited by the short period of the data. Statistical tests were performed using the open software PAST (Hammer et al., 2001 ), and data processing and graphical representations were done using the open statistical software R (R Core Team, 2022 ).
RESULTS
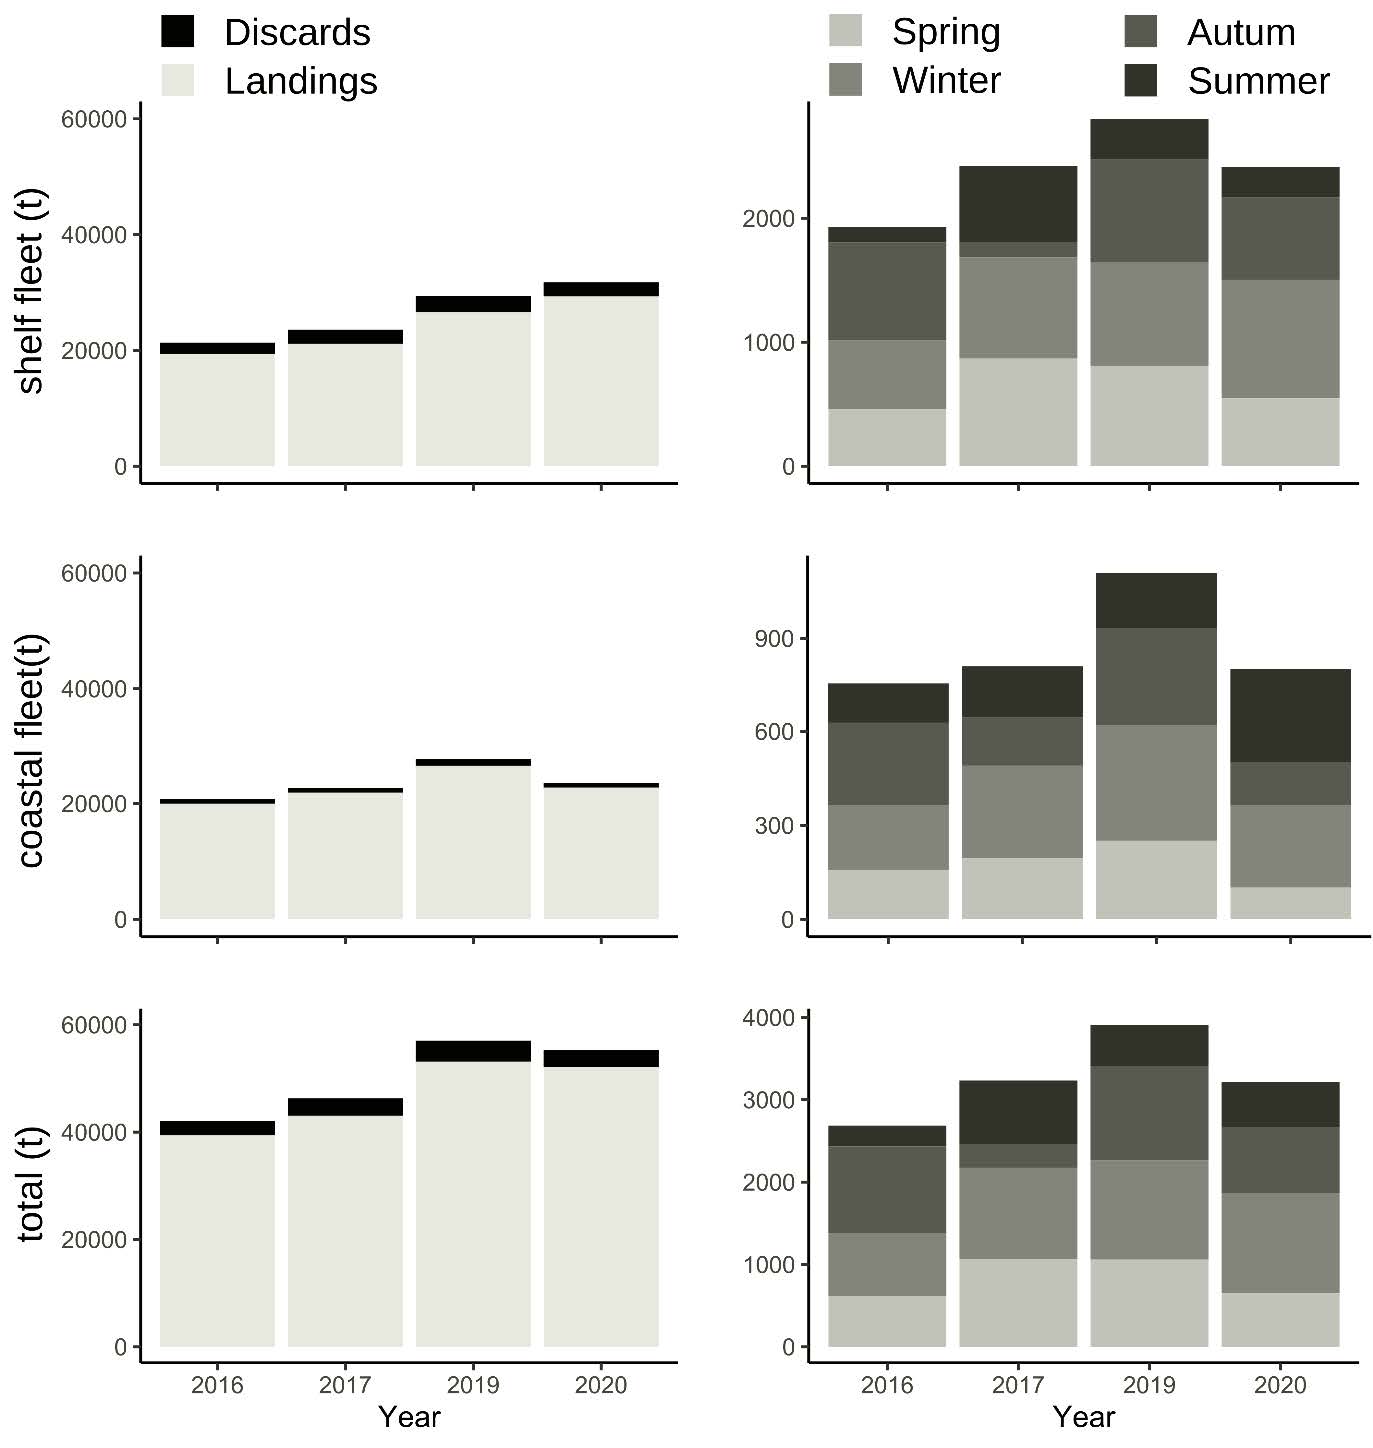
The Uruguayan bottom trawl fishery discarded an average of 3,268 (± 505) tons per year, which represents approximately 6.5% of the total catch per year. The discard area encompasses the entire geographic operation area of each fleet ( Figure 1 ). No significant differences were found in discards or landings between years for both fleets ( Figure 2 ) (shelf landings: K-W H = 1.963, P = 0.58; shelf discards: K-W H = 1.853, P = 0.60; coastal landings: K-W H = 0.375, P =0 .94; coastal discards: K-W H = 2.934, P = 0.40). Discards in the shelf fleet accounted for 9.1% (± 1.1%) of the total catch, whereas, in the coastal fleet, 3.7% (± 0.3%) of the catch was discarded. No significant seasonal variations in discard magnitude were detected for either fleet (shelf discards: K-W H = 5.78, P = 0.12; coastal discards: K-W H = 3.86, P = 0.28) ( Figure 2 ). However, the biomass of the landings showed intra-annual differences, with colder seasons (autumn and winter) showing significantly higher values than summer for the shelf fleet (shelf landings: K-W H = 9.60, P = 0.02). This pattern repeated itself for the coastal fleet with the addition of significant differences between spring and winter (coastal landings: K-W H = 13.26, P = 0.004) ( Figure 2 ).
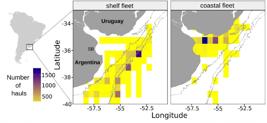
Study area and geographic position of fishing hauls considered in this analysis (period 2016, 2017, 2019, and 2020) aggregated in squares of 0.5 degrees of latitude and longitude. SB indicates the Samborombón bay. Grey lines indicate isobaths 50, 100, and 200m from the coast.
A comparison of shelf fleet discard diversity between years showed significant differences in the Shannon-Wiener index (K-W shelf H’ H = 10.39, P = 0.015). The post hoc comparison indicated that significant differences occurred between the last year of the study (2020) and the first two years (2016, 2017), as well as between 2017 and 2019, with lower H’ values during 2019 and 2020. Evenness showed a similar pattern with lower J values in the last two years (K-W shelf J: H = 10.92, P = 0.012), whereas species richness showed no significant differences between years (K-W shelf S: H = 2.236, P = 0.52). For the coastal fleet, no significant differences were found in diversity between years for the three indices (K-W coastal H’: H = 7.08, P = 0.07; K-W coastal S: H = 2.982, P = 0.39; K-W coastal J: H = 5.162, P = 0.16) ( Supplementary Table 1 ). Differences in diversity indicators between seasons showed no significant intra-annual variation (K-W shelf H’: H = 3.29, P = 0.35; K-W shelf S: H = 3.18, P = 0.34; K-W shelf J: H = 2.49, P = 0.48) (K-W coastal H’: H = 3.73, P = 0.29; K-W coastal S: H = 1.84, P = 0.60; K-W coastal J: H = 4.13, P = 0.25). However, the H’ index indicated the lowest discard diversity during winter for both fleets ( Supplementary Table 2 ).

Yearly values of total landings and discards declared on fishing logs (left column) and total discard per season and year (right column). Data are shown for the total catch and both shelf and coastal fleets in thousands of tons.
The most discarded species in the shelf fleet included the hairy conger ( Bassanago albescens ), the blackbelly rosefish ( Helicolenus dactylopterus ), the Argentine hake ( Merluccius hubbsi ), castaneta ( Nemadactylus bergi ), and the Brazilian sand perch ( Pinguipes brasilianus ) ( Figure 3 ). In the coastal fleet, the most discarded species was the Brazilian menhaden ( Brevoortia aurea ), followed by unclassified discards, white sea catfish ( Genidens barbus ), rays (Batoidea), Patagonian redfish ( Sebastes oculatus ), and the king weakfish ( Macrodon ancylodon ) ( Figure 3 ). Annual trends indicated an increase in the presence of hairy conger in the shelf fleet, exceeding 1,500 tons in 2020. The Brazilian menhaden showed a mean yearly discard of 420 tons in the coastal fleet with no significant trend. The proportional taxonomic breakdown of the discard for the entire fishery ( Table 1 ) showed B. albescens to be the most discarded species (35.7% of the total discard), followed by B. aurea (13.7%), H. dactylopterus (11.5%), and M. hubbsi (4.43%). The proportion of unclassified species was also high (6.54%).

Bar charts showing biomass for different discarded taxa. The A and C panels show tons of discarded biomass for the shelf and coastal fleet, respectively. The top five discarded species retained this level of aggregation, whereas the rest were grouped by taxonomic order and the unclassified discard was highlighted. The B and D panels show yearly discards in tons for the top five species and unclassified discard for shelf and coastal fleet, respectively.
The nominal DPUE in the shelf fleet showed a median of 0.139 tons/hr. The values are estimated for each square, with minimums of 0.01 tons/hr. and maximums of 1.31 tons/hr. Squares with high DPUE were associated with the shelf break ( Figure 4 ). In the coastal fleet, the median was 0.087 tons of discard per fishing hour, with a minimum of 0.014 tons/hr. and a maximum of 0.41 tons/hr. Squares with higher DPUE were located near the Samborombón Bay and the outer shelf ( Figure 4 ).
A taxonomic breakdown showing the percentage contribution of the top 10 species discarded for each fleet analyzed in this study to the total discard quantities and their combination to enable comparisons with previous information (Lorenzo et al., 2015 ).

Discard per unit of effort (DPUE) as tons of discarded catch per hour of trawling aggregated in squares of 0.5 degrees of latitude and longitude. A: Shelf fleet; B: Coastal fleet. Grey lines indicate isobaths 50, 100, and 200m from the coast
DISCUSSION
Discards in the Uruguayan industrial fleet constituted 6.5% of the catch, a figure considerably lower than the previously estimated 9% for this fishery (Rey et al., 2000 ; Lorenzo et al., 2015 ). A consistent interannual pattern was observed in the biomass of landings and discards for both fleets. The biomass of discards remained stable across seasons, but landings increased during the colder months, consistent with higher catches of the target species for both fleets (Marín et al., 2020 ). This aligns with the minimal discard diversity observed during the winter, suggesting a greater abundance of the target species of each fleet during this part of the year.
Self-reported discard information strongly depends on the perception and will of the person filling the declarations (e.g., the captain). Discard information obtained this way should be considered as an estimation and the stable pattern of discarded biomass can be a result of these biases. Likewise, a tendency to subreport magnitudes could explain the discard rate differences between this study and previous estimations that ignored declarations. However, as these declarations are independent, the general patterns that emerge from the large data set are considered valid. Moreover, due to the intrinsic value of local information over reconstructions, it is essential to acknowledge and validate this source of information and estimate the accuracy of self-reported data by contrast with independent sources, such as observer programs.
The shelf fleet showed lower diversity and evenness of discards in 2019 and 2020, potentially linked to the high bycatch of hairy conger ( Bassanago albescens ). An increase in the biomass of a single species impacts both H’ and J indices without affecting species richness. The coastal fleet showed a stable pattern with no significant intra- or interannual variation in discard biomass or diversity detected. This stability works as a constant subsidy across the food web. Trophic simulations suggest that discard in the Rio de la Plata area has a low impact on trophic flows, growth, and food web development (Damiano and Lercari, 2022 ). However, it was identified as a significant factor for apex predators, with potential substantial effects of discard variation for sea lions ( Otaria flavescens ) and Brazilian codling ( Urophycis brasiliensis ) (Damiano and Lercari, 2022 ). Additionally, a discard-associated trophic subsidy has been reported for eight seabird species, with significant importance in the diet of three albatross species (Jiménez et al., 2017 ). Although discards can represent a relatively small subsidy to the food web, the cascading indirect effect can be considerable (Heath et al. 2014 ).
Discarding is a misuse of living resources and an unwanted result of fishing activity (Punt et al., 2006 ). Finding a way to use the mostly discarded species can act as a way to minimize discarded biomass and increase revenues (Kruse et al., 2024 ). Analyzing the total annual biomass of the primary discarded species can more effectively evaluate the costs and benefits of commercially exploiting these resources. The discards of hairy conger by the shelf fleet have increased in recent years, from approximately 740 t in 2017 to over 1,700 t in 2020. Given that congeneric species are fished to produce smoked eel products (Smith et al., 2008 ), this could represent a commercial development opportunity. This demersal-benthic species, which primarily preys on cephalopods, resides at an average depth of 400 m and shares a sympatric distribution with two commercial species: the Argentine hake ( M. hubbsi ) and the Argentine squid ( Illex argentinus ) (Reyes, 2007 ). Changes in environmental conditions, coupled with competitive release, could be driving the increased bycatch of this species. The reduced biomass of M. hubbsi due to overexploitation (Lorenzo and Defeo, 2015 ; Gianelli and Defeo, 2017 ) could have lessened competition for habitat and forage (i.e., I. argentinus ) increasing Hairy conger availability.
In the coastal fleet over the entire period, the Brazilian menhaden ( Brevoortia aurea ) was discarded eight times more than the following species ( Genidens barbus ). The Brazilian menhaden has a low market value due to its bones, which hinder direct consumption and lead the species to be closely linked with discard in industrial and artisanal fisheries in the region (Acha and Macchi, 2000 ; Pennisi Forell, 2013 ). This species spawns and resides in estuarine waters connected with the salinity front of the Río de la Plata estuary (Acha and Macchi, 2000 ). Despite this, it has been reported as a safe food source with excellent nutritional quality, rich in polyunsaturated fatty acids and suitable for developing fish products (Pennisi Forell, 2013 ). Researching products to add value to discarded species is an appropriate use for discarded biomass, in addition to creating additional job opportunities for the community and enhancing the overall resilience of the fishery (Karkal and Kudre, 2020 ; Duta et al., 2021 ).
Information on target species discards can also be crucial for stock assessment (Punt et al., 2006 ; Breen and Cook, 2002 ). In the case of the Argentine hake, the target for the shelf fleet, discard was found to be, on average, 6.04% of the total discard and 1.11% of the Argentine hake disembarks. Even though the magnitude appears insignificant, the information could contribute to an assessment model differentiating between retained and discarded fish. Assuming target species discards are due to minimum length disembark regulations (i.e., juveniles), this information could improve the ability to detect strong year classes before their recruitment to the fishery (Punt et al., 2006 ). Identification of high DPUE areas could also better evaluate trawl exclusion areas for juvenile protection. Overall, it is somewhat incomprehensible that this valuable information continues to be neglected when the only barrier, in this case, is additional data analysis to better and more robustly assess renewable resources.
As stated before, spatially explicit discard information can find the areas with high concentrations of discarded species. The DPUE map for the shelf fleet indicates a region of increased discard near the shelf break (in which this fleet operates with greater intensity) and in coastal areas where fishing hauls are rare. The coastal fleet shows a high DPUE in its western region, close to the riverine inputs of the estuary and the Samborombón Bay. Both areas are linked with high concentrations of the whitemouth croaker and Brazilian menhaden (Militelli et al., 2013 ). High DPUE is also connected with coastal vessels fishing at greater depths in its eastern region. By contrasting DPUE with catch per unit effort, low-efficiency areas could be detected and the fleet could be informed to optimize its operation.
The taxonomic breakdown of the discard by fleet provides an update and adds resolution to information previously grouped as “industrial” (Lorenzo et al., 2015 ). When the data are aggregated, significant differences emerge with prior references. Notably, target species ( M. hubbsi , M. furnieri, and C. guatucupa ) are no longer significant in discard. This aligns with the historical analysis of the fishery (Gianelli and Defeo 2017 ). The stabilization-diversification phase (1980-2000) is associated with a discard of primarily target species, presumed to be of inadequate size (Lorenzo et al. 2015 ). This phase is succeeded by declining fishery yields of traditional and non-traditional species, with discard dominated by species currently without market value. The mapping of DPUE, combined with the taxonomic breakdown, can more accurately reconstruct discard from fishery information, more thoroughly analyzing the impacts of this practice.
It is widely acknowledged that self-reporting discard provides an opportunity to cover a more significant portion of the fleet at lower costs than observer programs (Starr, 2010 ). Frameworks that establish economic or regulatory disincentives face increased challenges with discard accountability and self-reporting verification (Plet-Hansen et al., 2017 ; Karp et al., 2019 ). The presence of landing obligations without actual enforcement in underdeveloped contexts is often a response to market demands and compliance with international regulations and constitutes a form of greenwashing. Regulatory frameworks that combine no penalties for discarding with mandatory self-reporting may provide the necessary information to properly assess discard while recognizing and considering local conditions (Sigurðardóttir et al., 2015 ). This study exemplifies the potential knowledge that can be gained by information on discarding stemming from this regulatory framework. However, the quality of the information on discarding on fishing logs in this fishery is considered low, with a high presence of unclassified species in the coastal fleet and a lack of incentives to report accurate information. An appropriate program that promotes a collective understanding of discard-related challenges involving fishers and stakeholders in policy formulation and implementation (Kraan et al., 2013 ; Mendo et al., 2022 ) is urgently needed to ensure high-quality self-reported discard information in the Uruguayan fishery. Practical strategies may include incentivizing accurate reporting and sanctions for misreporting. However, as the declaration ultimately relies on fishers’ will, a positive approach based on incentives is preferable.
Technology offers alternatives and complements to self-reports. Remote electronic monitoring via cameras, electronic logbooks, and AI-based real-time data analysis can reduce misreporting and improve observance of regulations, increasing overall transparency (Willette et al., 2023 ). Although an economic investment is required, higher quality traceability would increase consumer trust and improve market access, ultimately benefiting fishers. Progressive digital transition and integrated data exchanges can improve fisheries management (Willette et al., 2023 ), and should be part of every serious management plan, especially in contexts of low economic resources, such as the one in this review, in which improving information quality implies an opportunity of increasing revenues.
If communication and feedback with fishers are improved and maintained in a participatory manner, the discard regulation currently in place in Uruguay could evolve into a discard co-management approach, serving as a model for future research with global relevance. Social-ecological constraints and unforeseen climate change impacts will determine the sustainability of existing fisheries (Kruse et al., 2024 ). This study analyzed one of the critical factors that determine the adaptive capacity of a fisheries complex at a national scale. However, transdisciplinary approaches and strong cross-border collaboration are required. The shown results could foster collaboration with national or international organizations and researchers working on similar issues, bringing new opportunities to a depressed fishery system.
CONCLUSION
In conclusion, varying fishing contexts require different approaches as discard characteristics are heavily influenced by local social-ecological conditions. The existing Uruguayan regulation (i.e., no penalty for discarding and mandatory reporting) provides valuable information that has enabled the estimation of total discard at 6.5% of the catch (9.1% for the shelf fleet and 3.7% for the coastal fleet) and seasonal and yearly trends in discard magnitude and diversity. These trends have shown stability, with differences in the shelf fleet driven by the increase in B. albescens discards. The identification of the most discarded species and the DPUE map by fleet enhances the possibilities of discard information reconstruction for the area, thereby facilitating its inclusion in ecological and economic assessments.
ACKNOWLEDGMENTS
The authors express their gratitude to Dr. Gertrudis Australis for her continuous support, Dr. Leonardo Ortega for his kind review of this manuscript, and all anonymous reviewers for their critical comments and suggestions. We especially thank Lic. Ernesto Chiesa for his help in identifying the common names of the species. This study is a product of the project “Capacity Building in the National Directorate of Aquatic Resources” (URU 17/001, UNDP-DINARA). Moreover, both authors received support from the Uruguayan system of researchers (SNI-ANII).
REFERENCES
- Acha, E. M. & Macchi, G. J. 2000. Spawning of Brazilian menhaden, Brevoortia aurea, in the Río de la Plata estuary off Argentina and Uruguay. Fishery Bulletin, 98(2), 227–235.
- Breen, M. & Cook, R. 2002. Inclusion of discard and escape mortality estimates in stock assessment models and its likely impact on fisheries management. ICES CM, 27(15).
- Catchpole, T. L., Frid, C. L. & Gray, T. S. 2005. Discards in North Sea fisheries: causes, consequences and solutions. Marine Policy, 29(5), 421–430.
- Da Rocha, J. M., García-Cutrín, J., Gutiérrez, M. J., Prellezo, R. & Sanchez, E. 2021. Dynamic integrated model for assessing fisheries: discard bans as an implicit value-added tax. Environmental and Resource Economics, 80, 1–20.
- Damiano, G. & Lercari, D. 2022. Using trophic modeling: evaluating fisheries discard effect on the Río de la Plata Estuary and coastal shelf. Latin American Journal of Aquatic Research, 50(3), 397–416.
- Davies, R. W. D., Cripps, S. J., Nickson, A. & Porter, G. 2009. Defining and estimating global marine fisheries bycatch. Marine Policy, 33(4), 661–672.
- Duta, L., Dorcioman, G., & Grumezescu, V. 2021. A review on biphasic calcium phosphate materials derived from fish discards. Nanomaterials, 11(11), 2856.
- Feekings, J., Lewy, P. & Madsen, N. 2013. The effect of regulation changes and influential factors on Atlantic cod discards in the Baltic Sea demersal trawl fishery. Canadian Journal of Fisheries and Aquatic Sciences, 70(4), 534–542.
- Gianelli, I. & Defeo, O. 2017. Uruguayan fisheries under an increasingly globalized scenario: long-term landings and bioeconomic trends. Fisheries Research, 190, 53–60.
- Gianelli, I., Ortega, L., Marín, Y., Piola, A. R. & Defeo, O. 2019. Evidence of ocean warming in Uruguay’s fisheries landings: the mean temperature of the catch approach. Marine Ecology Progress Series, 625, 115–125.
- Gilman, E., Perez Roda, A., Huntington, T., Kennelly, S. J., Suuronen, P., Chaloupka, M. & Medley, P. A. H. 2020. Benchmarking global fisheries discards. Scientific reports, 10(1), 14017.
- Hammer, Ø., Harper, D. A. & Ryan, P. D. 2001. PAST: Paleontological statistics software package for education and data analysis. Palaeontologia Electronica, 4(1), 9.
- Heath, M. R., Cook, R. M., Cameron, A. I., Morris, D. J. & Speirs, D. C. 2014. Cascading ecological effects of eliminating fishery discards. Nature communications, 5(1), 3893.
- Hobday, A. J. & Pecl, G. T. 2014. Identification of global marine hotspots: sentinels for change and vanguards for adaptation action. Reviews in Fish Biology and Fisheries, 24, 415–425.
- Jiménez, S., Xavier, J. C., Domingo, A., Brazeiro, A., Defeo, O., Viera, M., Lorenzo, M. I. & Phillips, R. A. 2017. Inter-specific niche partitioning and overlap in albatrosses and petrels: dietary divergence and the role of fishing discards. Marine Biology, 164, 1–21.
- Johnsen, J. P. & Eliasen, S. 2011. Solving complex fisheries management problems: What the EU can learn from the Nordic experiences of reduction of discards. Marine Policy, 35(2), 130–139.
- Karkal, S. S. & Kudre, T. G. 2020. Valorization of fish discards for the sustainable production of renewable fuels. Journal of Cleaner Production, 275, 122985.
- Karp, W. A., Breen, M., Borges, L., Fitzpatrick, M., Kennelly, S. J., Kolding, J., Nielsen, K. N., Viðarsson, J. R., Cocas L., & Leadbitter, D. 2019. Strategies used throughout the world to manage fisheries discards–Lessons for implementation of the EU Landing Obligation. In: Uhlmann, S. S., Ulrich, C. & Kennelly S. J. (Eds.). The European landing obligation: reducing discards in complex, multi-species and multi-jurisdictional fisheries (pp. 3-26). Berlin: Springer.
- Kelleher, K. (2005). Discards in the world’s marine fisheries: an update. In: FAO Fisheries Technical Paper 470; FAO: Rome, Italy, 2005.
- Kennelly, S. J. & Broadhurst, M. K. 2002. By‐catch begone: changes in the philosophy of fishing technology. Fish and Fisheries, 3(4), 340–355.
- Kraan, M., Uhlmann, S., Steenbergen, J., Van Helmond, A. T. M. & Van Hoof, L. 2013. The optimal process of self‐sampling in fisheries: lessons learned in the Netherlands. Journal of Fish Biology, 83(4), 963–973.
- Kruse, M., Letschert, J., Cormier, R., Rambo, H., Gee, K., Kannen, A., Schaper, J., Möllmann, C. & Stelzenmüller, V. 2024. Operationalizing a fisheries social-ecological system through a Bayesian belief network reveals hotspots for its adaptive capacity in the southern North sea. Journal of Environmental Management, 357, 120685.
- Lorenzo, M. I. & Defeo, O. 2015. The biology and fishery of hake (Merluccius hubbsi) in the Argentinean–Uruguayan Common Fishing Zone of the Southwest Atlantic Ocean. In: Arancibia H. (Ed.). Hakes: biology and exploitation (pp. 185-210). Hoboken: Wiley Blackwell
- Lorenzo, M. I., Defeo, O., Moniri, N. R. & Zylich, K. 2015. Fisheries catch statistics for Uruguay. Fisheries Centre-The University of British Columbia Working Paper, 25, 1-6.
-
Marín, Y. H., Horta, S., Chocca, J. F. & Defeo, O. 2020. Historical expansion and diversification of Uruguayan fisheries in the Río de la Plata and the Atlantic Ocean: The concept of “métier” and the identification of high-intensity fishing areas. Ocean & Coastal Management, 184, 104919. DOI: https://doi.org/10.1016/j.ocecoaman.2019.104919
» https://doi.org/10.1016/j.ocecoaman.2019.104919 - Mendo, T., Mendo, J., Ransijn, J. M., Gomez, I., Gil-Kodaka, P., Fernández, J., Delgado R., Travezaño A., Arroyo R., Loza K., Mccann P., Crowe S., Jones E. L. & James, M. A. 2022. Assessing discards in an illegal small-scale fishery using fisher-led reporting. Reviews in Fish Biology and Fisheries, 32(3), 963-974.
- MILITELLI, M. I., MACCHI, G. J., & RODRIGUES, K. A. (2013). Comparative reproductive biology of Sciaenidae family species in the Río de la Plata and Buenos Aires Coastal Zone, Argentina. Journal of the Marine Biological Association of the United Kingdom, 93(2), 413-423.
- Murawski, S. A. 1996. Factors influencing by-catch and discard rates: analyses from multispecies/multifishery sea sampling. Journal of Northwest Atlantic Fishery Science, 19, 31-39.
- Pennisi Forell, S. C. 2013. Alternativas tecnológicas que permitan la elaboración de productos conformados ricos en ácidos grasos poli-insaturados, a partir de una especie marina grasa sub-explotada (SARACA, Brevoortia aurea) (Tesis de Doctorado). La Plata: Universidad Nacional de La Plata.
- Plet-Hansen, K. S., Eliasen, S. Q., Mortensen, L. O., Bergsson, H., Olesen, H. J., & Ulrich, C. 2017. Remote electronic monitoring and the landing obligation–some insights into fishers’ and fishery inspectors’ opinions. Marine Policy, 76, 98–106.
-
Punt, A. E., Smith, D. C., Tuck, G. N. & Methot, R. D. 2006. Including discard data in fisheries stock assessments: two case studies from south-eastern Australia. Fisheries Research, 79(3), 239–250. DOI: https://doi.org/10.1016/j.marpol.2016.11.028
» https://doi.org/10.1016/j.marpol.2016.11.028 -
R Core Team. 2022. R: A language and environment for statistical computing. R. Foundation for Statistical Computing. Available from: https://www.R-project.org/
» https://www.R-project.org/ - Rey M., Lorenzo M. I. & Páez E. 2000 Cálculo indirecto del descarte costero. Inf. Téc. Nº 48. Montevideo, Instituto Nacional de Pesca.
-
Reyes, P. R. 2007. Abyssal fishes of “Triple Union”, join point of Antarctic, South America and Nazca plates (northwestern Patagonic archipelago). Revista de Biologia Marina y Oceanografia, 42(1), 37–47. DOI: http://dx.doi.org/10.4067/S0718-19572007000100005
» https://doi.org/10.4067/S0718-19572007000100005 -
Rochet, M. J., Péronnet, I. & Trenkel, V. M. 2002. An analysis of discards from the French trawler fleet in the Celtic Sea. ICES Journal of Marine Science, 59(3), 538–552. DOI: https://doi.org/10.1006/jmsc.2002.1182
» https://doi.org/10.1006/jmsc.2002.1182 -
Sigurðardóttir, S., Stefánsdóttir, E. K., Condie, H., Margeirsson, S., Catchpole, T. L., Bellido, J. M., Eliasen, S. Q., Goñi, R., Madsen, N., Palialexis, A., Uhlmann, S. S., Vassilopoulou, V., Feekings, J. & Rochet, M. J. 2015. How can discards in European fisheries be mitigated? Strengths, weaknesses, opportunities and threats of potential mitigation methods. Marine Policy, 51, 366–374. DOI: https://doi.org/10.1016/j.marpol.2014.09.018
» https://doi.org/10.1016/j.marpol.2014.09.018 - Smith, P. J., Mcveagh, S. M. & Steinke, D. 2008. DNA barcoding for the identification of smoked fish products. Journal of Fish Biology, 72(2), 464–471.
- Soykan, O., Bakir, K. & Kinacigil, H. T. 2019. Demersal trawl discards with spatial and bathymetric emphasis in the Turkish coast of the Aegean Sea. Marine Biology Research, 15(1), 113–123.
-
Starr, P. 2010. Fisher-collected sampling data: lessons from the New Zealand experience. Marine and Coastal Fisheries, 2(1), 47–59. DOI: https://doi.org/10.1577/C08-030.1
» https://doi.org/10.1577/C08-030.1 -
Stergiou, K. I., Politou, C. Y., Christou, E. D. & Petrakis, G. 1997. Selectivity experiments in the NE Mediterranean: the effect of trawl codend mesh size on species diversity and discards. ICES Journal of Marine Science, 54(5), 774–786. DOI: https://doi.org/10.1006/jmsc.1997.0231
» https://doi.org/10.1006/jmsc.1997.0231 -
Uruguayan Parliament. 2013. Ley n. 19.175. Montevideo, Poder legislativo. Available from: http://archivo.presidencia.gub.uy/sci/leyes/2013/12/cons_min_806.pdf Access date: 2024 jul. 29
» http://archivo.presidencia.gub.uy/sci/leyes/2013/12/cons_min_806.pdf -
Willette, D. A., Ababouch, L., Barber, P. H., Bunje, P. M., Cauzac, J. P., Conchon, A. & Trenkel, V. M. 2023. Emerging monitoring technologies to reduce illegal fishing activities at sea and prevent entry of fraudulent fish into markets. Frontiers in Sustainable Food Systems, 7, 1166131. DOI: https://doi.org/10.3389/fsufs.2023.1166131
» https://doi.org/10.3389/fsufs.2023.1166131 - Zeller, D., Cashion, T., Palomares, M. & Pauly, D. 2018. Global marine fisheries discards: A synthesis of reconstructed data. Fish and Fisheries, 19(1), 30–39.
Edited by
-
Editor:
Rubens Lopes