Erosion vulnerability and risk on Amazon estuarine beaches (Marajó Island, Brazil)
Abstract
As the coastal zone is dynamic and subject to change from both natural and anthropogenic drivers, coastal vulnerability assessment is an essential tool for marine spatial planning, adaptation and mitigation of impacts. The eastern coastal environments of Marajó Island, the largest river-estuarine island in the world, are partially anthropized and vulnerable to erosion due to global (changes in sea level) and local (high-energy conditions on a tide-dominated coast) processes. It hosts diverse traditional communities which rely on the ecosystem services provided by the coast, as well as growing touristic activity and urbanization on the east coast. Here, vulnerability to erosion (Low: 0 to 5; Moderate: 6 to 10; High: 11 to 16) and risk level was assessed on two distinct estuarine beaches on the eastern coast of Marajó Island: Praia Grande and Barra Velha. A semi-quantitative analysis considered human occupation and natural parameters using remote sensing and in situ data collection techniques. Results indicated that Barra Velha beach has moderate vulnerability to erosion (value 10) in the northwestern sector and high vulnerability (value 11) in the southeastern sector, due to high erosion rates. These results were more evident by a shoreline analysis over a 16-year period (2003 to 2019: ~10 m/year). Praia Grande has moderate vulnerability to erosion (value 9) and is a more stable beach. Coastal risk to property and infrastructure was low at Praia Grande and at the southeastern sector of Barra Velha, where urbanization is incipient (15% to 17%; and absent, respectively). Moderate coastal risk was detected for the northwestern sector of Barra Velha where coastal development takes the form of controlled occupation (7% occupancy) due to its location in an environmental conservation area.
Keywords:
Coastal erosion; Geoprocessing; Amazon coast; Marine spatial planning; Ocean decade
INTRODUCTION
The coastal zone comprises a diverse and highly productive geographic space. Its current definition has arisen from a system which includes the interactions between the atmospheric and terrestrial environments, as well as the adjacent marine environment (Szlafsztein, 2009; Lins-de-Barros and Milanés, 2020). Coastal zones are also defined as complex ecological, economic, and social systems that result from the interactions between natural and anthropogenic activities (Lloyd et al., 2013). Traditional, coastal and urban communities must therefore be considered to ensure human safety, health, and maintenance of socioeconomic activities (Elliott et al., 2014).
Monitoring the coastal zone through integrated coastal management is required to mitigate impacts such as erosion and its consequences, which might be detected and assessed by analyzing natural or anthropogenic factors (Nascimento and Dominguez, 2009; Silva et al., 2013). Monitoring coastal hazards and vulnerability is thus necessary for a proper marine spatial planning, considering the multiple uses of the coastal areas, and to achieve the Ocean Decade goals, such as the fifth outcome: “A safe ocean where life and livelihoods are protected from ocean related hazards” and the sixth challenge “Increase community resilience to ocean hazards” (Pearlman et al., 2021; IOC, 2023).
A coastal system’s vulnerability to a particular phenomenon is defined as the potential for a certain area to be harmed by the impacts derived from that phenomenon, and it is quantified by comparing the magnitude of the impact with the system’s adaptation capacity (Gouldby et al., 2009; Bosom and Jiménez, 2011). Vulnerability has been addressed in several studies since the 1940s, leading to a multidisciplinary research field dedicated to investigating human populations exposed to environmental risks (Iwama et al., 2016).
Several methods and parameters have been developed to assess coastal vulnerability to different hazards in a wide spectrum of spatial and temporal scales, e.g., by analyzing climate changes (Abuodha and Woodroffe, 2006; Nguyen et al., 2016), sea level rise (Gornitz et al., 1994; Pendleton et al., 2010), the resulting coastal erosion (Alexandrakis and Poulos, 2014; Parthasarathy and Natesan, 2015; Andrade et al., 2019), coastal floods (Perini et al., 2016), and associated high energy events (Bosom and Jiménez, 2011).
According to Cutter (2011), erosive coasts in less developed places are aggravated by the fact that certain populations occupying these coasts are often left unsupported by coastal management, at risk from natural events. Thus, it is important to monitor erosion and the risks associated with it, even in sparsely populated areas.
Risk is understood as the probability of direct or indirect negative impacts caused by phenomena considered dangerous to humans or their property (Lins-de-Barros et al., 2018), and involves the imminence of harmful events for populations. In vulnerability, this event may not involve pollution. Studies show that an area occupied and under the effect of coastal erosion is not only susceptible or vulnerable, but also at risk.
The eastern coast of Marajó Island presents erosion caused by coastal retrogradation processes, according to palynological and morphodynamic studies (França and Souza Filho, 2003, 2006; França et al., 2007; França et al., 2012, El-Robrini et al., 2018). This part of the island has two cities with different characteristics. Soure is on the coastal plain, and Salvaterra is mostly on the coastal plateau. Consequently, both locations have distinct sedimentary deposits (extensive mangroves in Soure and an extensive cliff area in Salvaterra), as well as different types of human occupation (closer to the shoreline in Salvaterra). Additionally, we see a trend of growing urbanization in the coast due to economic activities such as tourism and oil and gas exploration on the continental shelf (ANP, 2020).
Although the geomorphology, oceanographic processes, and hydrodynamics of the Marajó Island beaches have been investigated, studies on the risk and vulnerability to erosion are still missing. Thus, the present study sought to assess the vulnerability to erosion and risk level of Praia Grande and Barra Velha beaches on the eastern coast of Marajó Island, focusing on human interactions and the natural characteristics of the tide-dominated estuarine beaches. We hypothesize that occupation in Praia Grande (Salvaterra) contributes to spatial vulnerability to coastal erosion and risk levels, whereas in Barra Velha (Soure) oceanographic processes are the main responsible.
METHODS
Study area
The Amazon Delta comprises the estuaries of the Amazon and Pará rivers, which flow into the Atlantic Ocean. The region is influenced by major hydrographic basins: the Amazon, the Tocantins-Araguaia, and the Northern Atlantic Coast basins (Guamá and Capim-Acará). Marajó Island is in the middle of the complex estuarine system. Its shoreline comprises extensive mangrove areas and sandy tides beach (Souza Filho, 2005).
Marajó Island is located between the mouths of the Amazon and the Tocantins-Araguaia basins, Northern Brazilian coast, with a surface of 49,000 km² (Barbosa et al., 1974). It is limited by the Atlantic Ocean (to the north), the Pará River and the Breves strait (to the south), the Amazon River (to the west), and Marajó Bay (to the east). The island has a semi-diurnal mesotidal range, with amplitudes ranging from 2.5 to 3.7 m (Prestes et al., 2017), and tidal currents ranging from 1.7 m.s-1 to 0.27 m.s-1 (El-Robrini et al., 2018). Tide ebb and flood periods are 7 hs and 6 hs, respectively, which classifies the estuary as asymmetric (Baltazar et al., 2011). The study area comprises the beaches of Praia Grande and Barra Velha, the coastal zone of Salvaterra and Soure, on the eastern margin of the island (Figure 1). The main tourist beaches of Marajó Island are in these cities, which present a diversity of sedimentary environments resulting from the action of geomorphological processes linked to relative changes in sea level, neotectonics, and coastal dynamics.

Map of the study area (Eastern coast of Marajó Island, Brazil). Red lines indicate the beaches studied. Sentinel-2A Image from 07/20/2019
Soure’s landscape is characterized by low topographic gradients, whereas in Salvaterra the coastal plateau approaches the shoreline (França and Souza Filho, 2003). Praia Grande, located in Salvaterra, is approximately 1.2 km long and mostly extends along the foothill of cliffs and rocky promontories. Roughly concave, it has a steep topographic gradient and medium-grained sands derived from the erosion of cliffs and promontories reworked by waves (França and Souza Filho, 2006). It has greater urbanization on the shoreline, including hard structures of coastal engineering. Barra Velha, located in Soure, is approximately 1 km long and is on a low-gradient coast, with muddy plains, straight to convex shapes, smooth slopes, and very fine, well-sorted sands which border the mangroves (França and Souza Filho, 2006).
According to Koppen’s classification, the island’s climate in the eastern sector is tropical monsoon humid (“Am”) with a mean annual temperature of 27 ºC and annual rainfall higher than 3.000 mm. The rainy season (December to May) has the highest rainfall between February and April, and the dry season (June to November) has the lowest rainfall between September and November (Lima et al., 2005).
Wind, waves, and current dynamics are primarily regulated by the weather (equatorial climate). Local wave and current patterns are also shaped by the physical and sedimentary structure of large estuaries that flow into the Amazonian coast (e.g., the Pará River) (Ranieri et al., 2022).
The main estuary on the eastern coast of Marajó Island, the Paracauari River, separates the cities of Soure and Salvaterra. During the dry period, the influence of marine waters is modulated by the tides, with a net flow into Marajó Bay of 98.594 m3.s-1. During the rainy season, the net flow into Marajó Bay is around 65.269 m3.s-1 (Ferreira, 2013).
The winds in the Marajó region have a dominant northeast direction, with average speeds of 7 m.s-1 that varies seasonally. They are stronger in the eastern sector compared with the western sector due to differences in topography and vegetation. Research suggests that the NE littoral winds that reach the eastern coast are reduced by the coastal vegetation which acts like a natural barrier (Lima et al., 2005).
The north coast is influenced by waves formed from the trade winds, which arrive from the open sea to Marajó Bay with heights below 1-1.5 m, corroborated by data from CPTEC/INPE and Oceanweather (El-Robrini et al., 2018). In bay areas, waves generated by local winds break with heights of up to 1m and periods of around 8s. In low tide conditions, they have a relatively calm system, with the presence of small swells inferior to 0.3 m in height.
Sampling and data analysis
Methodological procedures included in situ data sampling and description of the coastal landscape (environmental analysis) to assess vulnerability to erosion using a semi-quantitative method. Two sampling campaigns were conducted (September/2019 – dry season; and February/2020 – rainy season) on Barra Velha and Praia Grande. The beaches were divided into two sectors according to the degree of human occupation: the relatively urbanized northwestern sector, and the preserved southeastern sector.
Cross-shore beach profiles (approximately 150 m apart) were measured during the low tide (eight profiles on Praia Grande and seven profiles on Barra Velha) using a Topcon ES105 Total Station and a reflector prism. Topographic elevation on high tide and low tide lines was processed using Grapher 14 software, enabling the projection and overlapping of topographic profiles for subsequent sediment volume (Vv) calculation, which was used to determine variations in foreshore elevation (parameter VII, Table 1).
After observing the existence of stable and unstable sediment deposits on the sectors in situ (parameter I), the concentration of human occupation near the shoreline (parameter II) was calculated based on satellite images taken in 2020 extracted from Google Earth. Total area of each beach sector were obtained using ArcGis 10.5, extending up to 200 m from the shoreline towards the continent, as proposed by Brazilian legislation as an ideal condition for non-occupation (Brasil, 2004). Human-occupied area (m2) was measured, and the percentage of occupied area per sector was calculated in relation to the total area using a simple rule of three.
Natural protective deposits from backshore to shoreface and artificial protective structures (hard structures) were qualitatively evaluated (parameters III and IV). Natural structures/deposits (III) have the function of minimizing local hydrodynamics or providing replacement of sediments eroded from beaches. Artificial structures modify coastal dynamics (IV) and affect sediment exchange with the post-beach.
Surface sediment was sampled simultaneously with the topographic profiles and subsequently processed in the laboratory. Mean grain size was calculated by sieving and the degree of exposure to waves (parameter V) was derived using the ratio between sediment size and measured beach-face slope (Muehe, 2001). Seasonal sedimentary changes on the beach face and annual changes on the shoreline generate coastal erosion or accretion.
Parameters, classes, weights, and definitions for classifying erosion vulnerability, adapted from Dal Cin and Simeoni (1994) and Marcomini and López (2007)
To obtain shoreline variation rate over 16 years, previously orthorectified Landsat ETM 7 satellite images taken in 2003, and Landsat OTI 8 satellite images taken in 2019 were acquired in geotiff format, with UTM (Universal Transverse Mercator) map projection, zone 22N, and WGS-84 datum, from the Geological Service of the United States (https://earthexplorer.usgs.gov). Images were selected in low tide conditions, as they do not compromise shoreline identification. The images were reprojected for zone 22S and improved to a spatial resolution of 15 m/pixel using the merge of high-resolution panchromatic bands with less spatially resolute multispectral bands, a technique used for improving visual interpretation.
For each year, a shape (polyline) was vectorized following the shoreline obtained from the vegetation limit line on Barra Velha beach, upper edge of the cliffs, artificial structures and vegetation limits in Praia Grande.
All image treatments were performed using ArcGIS 10.5. Vectorial data were processed using the Digital Shoreline Analysis System (DSAS 4.0) extension of the same software (Thieler et al., 2017). DSAS allows generating transects (profiles) orthogonal to the baseline determined by the user. Shoreline variation rate (parameter VI) is then calculated over time based on statistical data. Variation statistics in DSAS, the Net Shoreline Movement (NSM), was used to show the distance (in meters) between the most recent and the oldest shoreline; and the End Point Rate (EPR), which determines the variation rate between two shorelines by dividing the distance of shoreline movement by time elapsed (meters per year). The latter was the specific parameter (parameter VI) used to quantify vulnerability to erosion (Table 1). To ensure reliable results, the values between 15 and -15 meters obtained from the corresponding NSM were considered shoreline stability since the image spatial resolution was 15 meters.
Google Earth images have been employed to monitor the evolution of geomorphological environments in the years 2006, 2014, 2017, and 2019. Image selection started in 2006, marking the onset of acquiring high-resolution images, which enabled the observation of coastline evolution and allowed the correlation with oceanographic features like waves, tides, drift currents, and sediment dispersion (Dolliver, 2012).
For coastal vulnerability assessment, a semi-quantitative methodology was adapted from models proposed by Dal Cin and Simeoni (1994), and Marcomini and López (2007) (Table 1). To integrate natural and anthropogenic parameters, a weight scale was assigned (0, 1, 2, and 3) to all variables, either qualitative or quantitative, according to their level of influence on the vulnerability to erosion of the studied beaches.
The sum of these parameter weights resulted in a scale of erosion vulnerability ranging from 0 to 16 (Low: 0 to 5; Moderate: 6 to 10; High: 11 a 16). Risk level (Table 2) was assessed for each beach using the shoreline changes (parameter VI) and human occupation level (parameter II), since erosion indicates hazard in the presence of populated areas. As shoreline change is a direct indicator of coastal erosion and accretion in the study area, it was used as a parameter for analyzing the risk level.
For a better description and understanding of the results regarding vulnerability to coastal erosion and risk level, each beach was shown in the table with their parameters adequately quantified by sector. The map of vulnerability to erosion and risk level was created using ArcGIS 10.5 through polylines plotted along the shorelines of Praia Grande and Barra Velha, identifying vulnerability and risk level with different colors according to the GPS mapping performed on site.
RESULTS
Artificial and natural protective structures
Although lacking artificial protection structures (parameter IV), Barra Velha has uprooted mangroves (Figure 2e and 2 f) that indicate unstable natural protective structures (parameters I and III). Praia Grande does not have artificial protection structures in the northwestern sector, although active cliffs have been replaced by hard structures (seawalls) to counter erosion (Figure 3a). Small dune scarps were observed in the southeastern sector (Figure 3e and 3f).

Artificial structures (A, B, C, and D) in the northwestern sector and natural protective structures in the southeastern sector (E and F) of Barra Velha beach. Photographs taken 05/02/2021 (B and D) and 09/14/2019 (A, C, E, F)

Artificial structures (A, B, C, and D) in the northwestern sector and natural protective structures in the southeastern sector (E and F) on Praia Grande beach. Photographs taken 05/02/2021 (A and B) and 9/13/2019 (C-F)
Human occupation
Barra Velha had a low human occupation near the shoreline. Only 7% of the northwestern sector was occupied whereas the southeastern sector was unoccupied (Figure 4, Table 3). Since the beach is inside a marine protection area (MPA), the Soure Marine Extractive Reserve (Soure RESEXMAR), only a few wooden restaurants are situated on the shoreline in the northwestern sector (Figure 2b).
Praia Grande was classified as a beach of low human occupation near the shoreline, with 15% of the occupied area in the northwestern sector and 17% in the southeastern sector (Figure 4, Table 3). The northwestern sector has approximately 300 m of shoreline occupied by bars and restaurants, as well as a wall to stop erosion on the waterfront. The only building in the southeastern sector is a hotel set back approximately 50 m from the shoreline (Figure 4).
If the limit adopted for the human occupation analysis were changed to more than 200 m from the shoreline (for example, 500 m), the result would remain unchanged, as the areas under study have little expansive urbanization, but directly on the shoreline. The low occupancy percentage did not significantly affect the degree of vulnerability.

Map of human occupation near the shoreline of Barra Velha (left) and Praia Grande (right) beaches

Correlation between beach-face slope and grain-size characteristics of the sediment due to wave exposure. Average obtained from all beach profiles: Barra Velha (A) and Praia Grande (B). Source: Muehe (2001)
Degree of exposure to waves
Barra Velha was classified as a semi-exposed beach for both sectors (beach-face slope: 1.17º and fine sand: average of 2,4 ɸ). Praia Grande was also classified as a semi-exposed beach for both sectors (mean slope of 3.75º and medium sand: average of 1,3 ɸ) (Figure 5), excepting beach profile H (northwestern sector) which was classified as an exposed area (near the mouth of Paracauari River, with more intense wave action).
Shoreline changes
Over the study period (16 years), the mean spatial amplitude was -81.34 m, and only Barra Velha retreated, which indicates an erosive tendency on the coast (Figure 6). Mean linear variation in the northwestern sector was -18.81 m, well below the mean linear variation in the southeastern sector (-150.2 m). EPR results show a mean beach variation rate of -9.93 m/year, with -3.15 m/year in the northwestern and -9.58 m/year in the southeastern sector (Figure 6).

Shorelines of Barra Velha Beach in 2003 and 2019. Landsat 7/ETM image of 2003 (A) and Landsat 8/OLI image of 2019 (B). Annual shoreline development rates measured by End Point Rate (EPR) between 2003 and 2019 (C)
Praia Grande had a mean spatial amplitude of -0.54 m from 2003 to 2019, suggesting shoreline stability (Figure 7). The northwestern and southeastern sectors had mean linear variations of -6.04 and 5.67 m, respectively. Shoreline variation was extended beyond Praia Grande, including the area adjacent to the beach (abrasion platform), which extends to the mouth of the Paracauari River (Figure 7). Considering this larger extension, the mean spatial amplitude was -7.49 m. Praia Grande variation over the study period was lower compared to the rest of the Salvaterra coast, to the northwest.
Mean variation rate in Praia Grande was -0.03 m/year, whereas this rate was -0.54 m/year in the area encompassed by the beach and the abrasion platform to the northwest, suggesting erosion in the adjacent area. The northwestern and southeastern sectors of the beach had mean variations of -0.35 and 0.33 m/year, respectively (Figure 7), indicating shoreline stability.

Praia Grande and adjacent area shorelines on the Paracauari River margins (upstream) in 2003 and 2019. Landsat 7/ETM image of 2003 (A) and Landsat 8/OLI image of 2019 (B). Annual shoreline development rates measured by End Point Rate (EPR) between 2003 and 2019 (C)
Vertical variations in Beach-Face
Sediment volume (ΔVv) variation in Barra Velha was negative during the transition from dry to rainy season in the southeastern sector (profiles A-C), indicating a short-term erosive trend. In the northwestern sector (profiles D-G) sediment volume variation was positive, indicating a trend towards equilibrium, as accretion predominated in half of the topographic profiles, whereas erosion occurred in the other half (Figure 8; Table 4).
Despite the negative values in C and F, the sediment volume variation in Praia Grande was positive in both sectors during the transition from the dry to the rainy period, indicating an accretion trend, mainly in the southeast sector (Figure 9, Table 5).

Beach profiles of Barra Velha, adapted from Souza and Ranieri (2023). Photographs taken on 9/14/2019 (dry season) and 2/13/2020 (rainy season)
Sediment balance (ΔVv) obtained from the topographic profiles of Barra Velha beach. Sector: northwestern (gray) and southeastern (white). Vv was obtained from Sousa and Ranieri (2023)

Beach profiles of Praia Grande, adapted from Souza and Ranieri (2023). Photographs taken on 9/13/2019 (dry season) and 2/11/2020 (rainy season)
Sediment balance obtained in the topographic profiles of Praia Grande. Sector: northwestern (gray) and southeastern (white). Vv was obtained from Sousa and Ranieri (2023)
Assessment of coastal dynamics
Analysis of Google Earth images (Figure 10) reveals a correlation between both beaches and oceanographic features. In the initial year of Barra Velha (2006), the shoreline was not detectable, with the Araruna channel (purple arrow) serving as the primary source of sediment supply. Waves (blue arrow) originating from the North reached the coast, generating currents (green arrow) that transported sediments southward. Afterwards (2014), a berm break occurred, likely during high spring tides, allowing sediment to advance toward the coast and indicating an erosive scenario. Simultaneously, the Araruna channel remained stable, and a new tidal channel emerged, contributing to sediment spreading (purple dashed line) in the inter-tidal zone, resulting in sediment deposition in Barra Velha. Stratifications (purple dashed line) along the beach suggest a progradation process like the geomorphology observed in deltas.
In the third year (2017), sediment supply from the Araruna channel formed sandy bars through sediment accumulation in the inter-tidal zone, mitigating waves and tidal energy along the beach. A portion of the energy was transported southward by drift currents. In the last year (2019), a point bar developed northwards of Barra Velha, with the inner portion more pronounced than the outer portion due to drift currents transporting sediments. Monitoring of Praia Grande found no significant changes, but the presence of a tidal channel supplied sediments to the intermediary portion, fostering sediment spreading such as in Barra Velha.

Evolution of geomorphological environments in the northeast portion of Marajó Island. Presence of the Araruna channel (purple arrow), the main sediment source for Barra Velha, with the incidence of diagonal waves (blue arrow) and presence of the longshore drift current (green arrow) (A); the emergence of a delta originating from tidal channel sediments and sediment spreading over the coastal region (brown line) (B); the emergence of sandy bars and channels that favor sediment exchange (C); development of the point bar and sediment entrapment cells due to the influence of the Araruna channel and waves (D); canalization with the presence of a delta and sediment transport to the south in Praia Grande (E)
Vulnerability to erosion and risk level
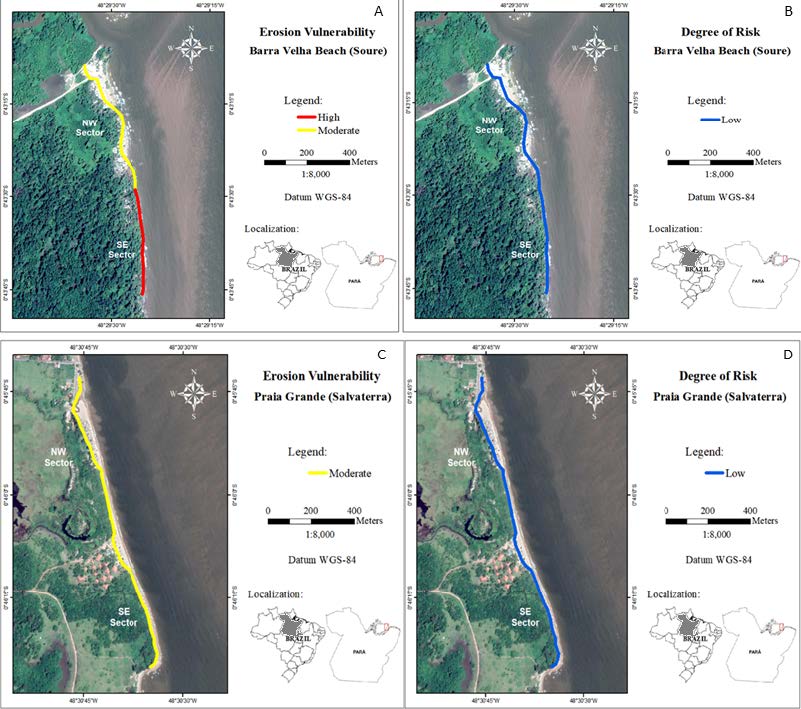
Barra Velha presented two degrees of vulnerability to coastal erosion. The northwestern sector had moderate vulnerability and risk level, whereas the southeastern sector had high vulnerability but low risk level (Table 6, Figure 11). Sediment balance was negative in all profiles of the southeastern sector, which shows an erosive tendency even in a short-period analysis.
Praia Grande had moderate vulnerability to erosion for both sectors. Both the northwestern and southeastern sectors were classified as low risk (Table 7, Figure 11).

Maps of erosion vulnerability and risk level: Barra Velha beach (A – B, respectively), and Praia Grande (C – D, respectively). Modified from Google Earth image (2020)
Classification of erosion vulnerability in Barra Velha beach according to determined parameters (I to VII) and risk level, based on the vulnerability and human occupation near the shoreline
Classification of erosion vulnerability in Praia Grande according to determined parameters (I to VII) and risk level, based on the vulnerability and human occupation near the shoreline
DISCUSSION
Barra Velha
Assessment of different erosion indicators revealed a high vulnerability for the southeastern sector of Barra Velha, mostly due to shoreline retreating trend (mean retreat of 50.2 m over 16 years), corroborating the seasonal topographic profiles which show sediment output on the beach from the dry to the rainy season. Each year this loss must be greater than the input in the dry period.
Natural agents (tide and wave) are the main controllers of the dynamics in this beach due to the propagation of waves along the coast controlling sediment transport northwards. Wave action is responsible for the beach amplitude configuration resulting in less erosion on the northwest sector (up to 18.81 m of retraction), partly protected from the wave action, whereas the southeast sector (up to 150.2 m of retraction) is more exposed to the agents, an inference supported by the results of the sedimentary balance profiles. Likewise, the waves produced longshore drift that eroded the right margin of the Araruna channel mouth, transporting sediments to the south. Kuleli (2010), Traini et al. (2012), and Hoanget al. (2015) also observed intense erosion on the shorelines at the mouth of channels on other estuarine beaches around the world.
When sediment transport is intense in these channels, it leads to sediment accumulation in adjacent areas, as the Araruna channel contributed with sedimentary supply to developing the 2019 shoreline, which is more oblique and therefore longer than that of 2003 (Figure 6). Sediment transport southeastwards created a straight morphology, associated with the increase in beach extent.
Google Earth image analyses recorded the appearance of a small tidal channel forming an ebb delta in front of Barra Velha. Moreover, the longshore drift combined with the channel led to a decrease in delta deposition and sedimentary accumulation to form a sandy bar along the beach. This regional setting is characterized by lowlands where the tidal force is much more influential than the wave force. This phenomenon is fundamental to shape the geomorphological environment, allowing the growth of mangrove trees. During the evolution scenario (Figure10), however, the mangroves reduced over time due to sediment transport and deposition to the southeast, mainly during the rainy period when the sediments were more susceptible to transport.
Shoreline change (parameter VI) had the highest impact on the final classification of both beach sectors at Barra Velha, indicating high erosion. We suggest that, besides the northwestern sector being classified as moderate for vulnerability, the medium- or long-term trend is that it might progress to high vulnerability due to the expected global sea level rise. Estimates show that a two-meter elevation on sea level would flood 28% of Marajó Island’s area (including Barra Velha). If the increase in sea level reaches 6 meters, 36% of the island could be flooded (INPE, 2016).
These shoreline changes would result in the coastal retrogradation of Barra Velha. According to França et al. (2012), these oscillations might indicate increased exposure to the influence of tides driven by the relative increase in sea level, whether it is associated with global fluctuations or tectonic subsidence, and/or increased river discharge. According to França and Souza Filho (2003), França et al. (2012), and Santos et al. (2016), one of the causes of mangrove vegetation regression along the Marajó shoreline, especially in Soure, is erosion and sand migration towards the continent across the muddy sediments of the mangrove (Figure 2c, 2e, 2f). Sediment deposition in the backshore is unstable and as mangrove retreat increases, uprooted mangrove becomes evident even on the beach face; however, the existing mangrove in the shoreline can be considered as a natural impediment to even faster erosion rates.
Despite the shoreline retreat in over a decade in the northwestern sector, the annual sediment balance (vertical variations in beach profiles) was even, indicating a sediment input during the dry season when a small increase in sediment deposition on Barra Velha was noticed. Barra Velha beach has limited human occupation since it is inside an MPA (Figure 2b and 2d), in compliance with regulations on this activity by the federal government (ICMBio, 2018).
Martins et al. (2017), who studied the northern sector of the Pernambuco coastal zone (Brazil), covering urbanized and non-urbanized beaches, considered 7 km of the coast to be highly vulnerable. Like Barra Velha (a non-urbanized beach), some areas of that sector had low population density, but a high shoreline retreat rate and higher exposure to local hydrodynamics. Conversely, many studies have shown that high vulnerability is directly related to anthropogenic interventions, ranging from the building of restaurants to hard structures for coastal protection (Mallmann and Araújo, 2010; Sousa et al., 2013; Martins et al., 2017; Oliveira Mota and Souza, 2017; Shetty et al., 2019). This does not seem to occur in Barra Velha, where coastal erosion results mainly from natural processes.
Praia Grande
In turn, the erosive effects on Praia Grande showed some linkages to human interference. This beach presented moderate vulnerability for both sectors. Lisbôa (2011) found similar results (moderate vulnerability) on the same beach when assessing environmental vulnerability in the Salvaterra waterfront by seven indicators related to changes derived from physical and natural factors, and from social or anthropogenic factors.
This moderate vulnerability to erosion was due to a group of factors (parameters III, IV, and V). Praia Grande is backed by unstable natural protective structures (sand dune scarps), which were observed discontinuously and not extensively. The low occurrence or absence of dunes is related both to the larger sand grain size, to the natural dynamics of sediment transport in this sector, and to the partial deforestation of the sandbank vegetation cover due to human occupation on these former dunes (Lisbôa, 2011). A seawall on the waterfront shoreline of the northwestern sector (Figure 4a, parameter IV) prevents natural sediment exchanges between backshore and foreshore, despite the positive sediment balance in the transition from dry to rainy season (parameter VII) which consequently seems to be due to the interaction with the submerged portion of the beach. Moreover, Praia Grande was classified as semi-exposed to exposed regarding wave exposure (parameter V).
Similar to Barra Velha, Praia Grande is subject to the influence of wave propagation and longshore drift from the northeast. However, cliffs in the northeast form part of the coastal plateau geomorphological setting. The cliffs exhibit instability induced by wave action (Muehe, 2006; Szlafsztein and Sterr, 2007). On a local scale, the results from profiles C and F revealed a negative sedimentary balance, potentially attributed to the presence of urban structures that disrupt the natural sediment dynamics. Despite the influence of these anthropogenic elements, other profiles indicate a positive balance. This is credited to sediment transport from the Paracauri estuary and the contribution of sediment from the Caraparu ‘lake’ which has developed in a flooded former field.
In a recent study, Andrade et al. (2019) classified some beaches on the coast of São Paulo, southeastern Brazil, as having moderate vulnerability. Among the analyzed indicators, the angle of wave incidence and terrain elevation were highlighted. Wave formation was an important indicator, as it defines the beach exposure level and its response to wave action (Andrade et al., 2019). Even though the coast of Pará is tide-dominated, the action of waves must not be neglected since wave height can reach values close to 1 m during the high tide (El-Robrini et al., 2018).
Praia Grande was considered stable according to the mean shoreline variation rate (-0.03 m/year; parameter VI). When comparing the sectors, however, we note a slight erosive trend in the northwestern sector. This fact might be related to the anthropogenic interventions in the first sector, such as the building of lodges, restaurants, and the contention wall. The area adjacent to the beach (mouth of the Paracauari River) had an erosive trend (-0.54 m/year) over the years. Around 24% of the world’s sandy beaches are undergoing erosion at rates greater than 0.5 m/year (Luijendijk et al., 2018), many of them at coastal risk.
Risk is directly related to the existence of human occupation. Areas in which occupation is nonexistent or low present a low risk, even if the natural and/or anthropogenic parameters indicate high vulnerability to erosion (Oliveira Mota and Souza, 2017). Thus, the studied beaches were classified as low to moderate risk levels due to low (< 30% of occupied area) or even nonexistent occupation. The fact that Barra Velha is situated in an MPA probably resulted in low human occupation and, consequently, contributes to its lower risk in the southeastern sector. As for the more populated sector of Praia Grande (northwestern sector), the broader the analysis area (adjacent region of Paracauari River), the higher is the level of expected coastal risk.
Since erosion is affecting mangroves at Barra Velha, a possible impact on ecosystem services provided by mangroves is expected. Traditional coastal communities rely on such services, mainly crab extraction and fisheries (Oliveira and Frédou, 2011; Gomes, 2012). Erosion progression would lead to the migration of artisanal fisheries and crab extraction to adjacent areas and its unknown consequences. Our results have important implications for coastal management, marine spatial planning, and even ecosystem-based fisheries management (Schmidt et al., 2019) for the Soure Marine Extractive Reserve (ICMBio, 2018), but with potential replication through the extensive Amazon coast.
CONCLUSION
Vulnerability to erosion was assessed by analyzing human interventions and the natural characteristics of two estuarine beaches located in Marajó Island, Amazonian coast. Northwestern and southeastern Barra Velha had a moderate and high vulnerability to erosion levels, respectively. The 16-year erosion rate has caused the mangrove to retreat due to beach sands advancing over the vegetation thereby confirming our hypothesis, which emphasizes the greater sedimentary dynamics on this beach given its low topographic gradient and medium-period shoreline variations, affecting the moderate to high vulnerability to erosion.
In turn, despite presenting more anthropic interference that could be enhancing coastal erosion, Praia Grande beach showed moderate vulnerability. It was considered stable, with a slight erosive tendency in the northwestern sector partly related to anthropogenic interventions in the area. Absence of protective ecosystems on the shoreline, replacing artificial structures (retaining walls) in the northwestern sector were parameters that increased the degree of vulnerability in Praia Grande. This reinforces that the biggest cause of coastal erosion is the high estuarine hydrodynamics on both beaches, semi-exposed to waves generated by local winds and strong tidal currents.
Although natural forces are preponderant for susceptibility to erosion, the coastal risk was low to moderate in the beaches due to low occupation level near the shoreline.
The present study methodology may be suitable for other estuarine areas, specifically regarding the morphological changes on beaches, and the monitoring of both its natural and anthropogenic aspects for coastal management activities. We highlight the sensitivity of the methodology to anthropogenic variables, as they may result in higher levels of coastal vulnerability in urbanized areas.
Vulnerability to erosion and risk level are important tools for monitoring coastal zones, increasing resilience to coastal hazards, as well as the dissemination of scientific knowledge necessary to advance coastal management and thus contribute to the sustainable principles of the Ocean Decade for Sustainable Development.
We highlight the need to collect other physical data that complement the present information. Our results should be better correlated with quantitative data from climate, socio-environmental, geological and oceanographic research.
Data availability statement
The original beach morphology images supporting Figs. 8-9, and the detailed beach sediment volume data supporting Tab. 4-5 are available at the following hyperlink: https://doi.org/10.20502/rbg.v24i3.2350
Supplementary material
Supplementary Material Sousa et al 2025. Zenodo. https://doi.org/10.5281/zenodo.15066218
Funding
This research was partially funded by project "Adaptation and mitigation to environmental impacts and risks to coastal populations in Marajo Island” (PROEXIA MARAJO, PROEX N. 02/2019 UFPA).
Acknowledgments
We thank the reviewers for their recommendations in the article and members of the Marine and Coastal Studies Group (GEMC) of the Federal University of Pará (UFPA) for our partnership in this study. We also thank the Post-Graduate Program in Oceanography (PPGOC) at UFPA and the Pro-Rectory of Extension (PROEX/UFPA) for partially financing the field work.
REFERENCES
-
Abuodha, P. A. & Woodroffe, C. D. 2006. Assessing vulnerability of coasts to climate change: A review of approaches and their application to the Australian coast. UOW Library, 1–18. Accessed: https://ro.uow.edu.au/cgi/viewcontent.cgi?article=1189&context=scipapers
» https://ro.uow.edu.au/cgi/viewcontent.cgi?article=1189&context=scipapers -
Alexandrakis, G. & Poulos, S. Ε. 2014. An holistic approach to beach erosion vulnerability assessment. Scientific Reports, 4(1), 6078. DOI: https://doi.org/10.1038/srep06078
» https://doi.org/10.1038/srep06078 -
ANP. 2020. Agência Nacional do Petróleo, Gás Natural e Biocombustível. ( http://www.anp.gov.br ). Accessed on 30 Apr 2020.
» http://www.anp.gov.br -
Andrade, T. S., Sousa, P. H. G. de O. & Siegle, E. 2019. Vulnerability to beach erosion based on a coastal processes approach. Applied Geography, 102, 12–19. DOI: https://doi.org/10.1016/j.apgeog.2018.11.003
» https://doi.org/10.1016/j.apgeog.2018.11.003 -
Baltazar, L. R. S., Menezes, M. O. B. & Rollnic, M. 2011. Contributions to the understanding of physical oceanographic processes of the Marajó Bay - PA, north Brazil. Journal of Coastal Research, 1443–1447. Accessed: http://repositorio.ufc.br/handle/riufc/66866
» http://repositorio.ufc.br/handle/riufc/66866 - Barbosa, G. V., Rennó, C. V. & Franco, E. M. S. 1974. Departamento nacional da produção mineral. Projeto RADAMBRASIL. Folha SA. 22-Belém; geologia, geomorfologia, pedologia, vegetação e uso potencial da terra. In: Geomorfologia (pp. 1–36). Rio de Janeiro: DNPM.
-
Bosom, E. & Jiménez, J. A. 2011. Probabilistic coastal vulnerability assessment to storms at regional scale – application to Catalan beaches (NW Mediterranean). Natural Hazards and Earth System Sciences, 11(2), 475–484. DOI: https://doi.org/10.5194/nhess-11-475-2011
» https://doi.org/10.5194/nhess-11-475-2011 - Brasil. 2004. Decreto n° 5.300 de 7 de dezembro de 2004.
-
Cutter, S. L. 2011. A ciência da vulnerabilidade: modelos, métodos e indicadores. Revista Crítica de Ciências Sociais, (93), 59–69. DOI: https://doi.org/10.4000/rccs.165
» https://doi.org/10.4000/rccs.165 -
Dolliver, H. A. S. 2012. Using google earth to teach geomorphology. In: Google earth and virtual visualizations in geoscience education and research. Geological Society of America. DOI: ( https://doi.org/10.1130/2012.2492(32) )
» https://doi.org/10.1130/2012.2492(32)) -
Elliott, M., Cutts, N. D. & Trono, A. 2014. A typology of marine and estuarine hazards and risks as vectors of change: A review for vulnerable coasts and their management. Ocean & Coastal Management, 93, 88–99. DOI: https://doi.org/10.1016/j.ocecoaman.2014.03.014
» https://doi.org/10.1016/j.ocecoaman.2014.03.014 - El-Robrini, M., Ranieri, L. A., Silva, P. V. M., Alves, M. A. M. S., Guerreiro, J. S., Oliveira, R. R. S., Silva, M. S. F., Amora, P. B. C., El-Robrini, M. H. S. & Fenzl, N. 2018. Panorama da erosão costeira no Brasil. In: Panorama da erosão costeira no Brasil (pp. 65–166). Brasília: Ministério do Meio Ambiente.
-
Ferreira, G. P. 2013. Caracterização hidrodinâmica e do transporte de sedimentos na região fluvio-estuarina do rio Paracauari, Ilha de Marajó, Pará (Master’s dissertation). Federal University of Pernambuco, Recife, 1–104 pp. Retrieved from https://repositorio.ufpe.br/handle/123456789/10624
» https://repositorio.ufpe.br/handle/123456789/10624 -
França, C. F. & E Souza Filho, P. W. M. 2006. Compartimentação morfológica da margem leste da Ilha de Marajó: Zona costeira dos municípios de Soure e Salvaterra – Estado do Pará. Revista Brasileira de Geomorfologia, 7(1). DOI: https://doi.org/10.20502/rbg.v7i1.58
» https://doi.org/10.20502/rbg.v7i1.58 -
França, C. F. de & Souza Filho, P. W. M. 2003. Análise das mudanças morfológicas costeiras de médio período na margem leste da Ilha de Marajó (PA) em imagem Landsat. Revista Brasileira de Geociências, 33(2), 127–136. DOI: https://doi.org/10.25249/0375-7536.200333S2127136
» https://doi.org/10.25249/0375-7536.200333S2127136 -
França, C. F. de, Souza Filho, P. W. M. e & El-Robrini, M. 2007. Análise faciológica e estratigráfica da planície costeira de Soure (margem leste da ilha de Marajó-PA), no trecho compreendido entre o canal do Cajuúna e o estuário Paracauari. Acta Amazonica, 37(2), 261–268. DOI: https://doi.org/10.1590/S0044-59672007000200013
» https://doi.org/10.1590/S0044-59672007000200013 -
França, M. C., Francisquini, M. I., Cohen, M. C. L., Pessenda, L. C. R., Rossetti, D. F., Guimarães, J. T. F. & Smith, C. B. 2012. The last mangroves of Marajó Island — Eastern Amazon: Impact of climate and/or relative sea-level changes. Review of Palaeobotany and Palynology, 187, 50–65. DOI: https://doi.org/10.1016/j.revpalbo.2012.08.007
» https://doi.org/10.1016/j.revpalbo.2012.08.007 -
Gomes, C. P. 2012. Interação de Ucides cordatus Linnaeus, 1763 em manguezais da Ilha de Marajó: uma abordagem ecológica. Thesis, Graduate Program in Zoology (Doctoral). Federal University of Pará, Belém, 1–144 pp. Retrieved from https://repositorio.ufpa.br/jspui/handle/2011/7400
» https://repositorio.ufpa.br/jspui/handle/2011/7400 - Gornitz, V. M., Daniels, R. C., White, T. W. & Birdwell, K. R., 1994. The development of a coastal risk assessment database: Vulnerability to sea-level rise in the U.S. southeast. Journal of Coastal Research, (12), 327–338.
-
Gouldby, B., Samuels, P., Klijn, F., Messner, F., Sayers, P., Schanze, J. & Wallingford, H. R. 2009. Title language of risk - Project definitions. Accessed: https://www.researchgate.net/publication/242717023_Title_Language_of_Risk_-_Project_definitions
» https://www.researchgate.net/publication/242717023_Title_Language_of_Risk_-_Project_definitions - Hoang, V., Thanh, T., Viet, N. & Tanaka, H. 2015. Shoreline change at the Da Rang River Mouth, Vietnam.
-
ICMBio. Plano de manejo da reserva extrativista marinha de Soure (2018). Accessed: https://www.gov.br/icmbio/pt-br/assuntos/biodiversidade/unidade-de-conservacao/unidades-de-biomas/marinho/lista-de-ucs/resex-marinha-de-soure
» https://www.gov.br/icmbio/pt-br/assuntos/biodiversidade/unidade-de-conservacao/unidades-de-biomas/marinho/lista-de-ucs/resex-marinha-de-soure -
INPE. Instituto nacional de pesquisas espaciais. Aquecimento global pode reduzir Ilha de Marajó (2016). Accessed: http://www.inpe.br/noticias/noticia.php?%20Cod_Noticia=607#:~:text=Com%202%20metros%20de%20eleva%C3%A7%C3%A3o,da%20ilha%20pode%20ser%20inundada
» http://www.inpe.br/noticias/noticia.php?%20Cod_Noticia=607#:~:text=Com%202%20metros%20de%20eleva%C3%A7%C3%A3o,da%20ilha%20pode%20ser%20inundada -
IOC. United nations decade of ocean science for sustainable development (2023). Accessed: https://www.oceandecade.org
» https://www.oceandecade.org -
Iwama, A. Y., Batistella, M., Ferreira, Lúcia da Costa, Alves, D. S. & Ferreira, Leila da Costa. 2016. Risk, vulnerability and adaptation to climate change: An interdisciplinary approach. Ambiente & Sociedade, 19(2), 93–116. DOI: https://doi.org/10.1590/1809-4422ASOC137409V1922016
» https://doi.org/10.1590/1809-4422ASOC137409V1922016 -
Kuleli, T. 2010. Quantitative analysis of shoreline changes at the Mediterranean Coast in Turkey. Environmental Monitoring and Assessment, 167(1), 387–397. DOI: https://doi.org/10.1007/s10661-009-1057-8
» https://doi.org/10.1007/s10661-009-1057-8 -
Lima, A. M. M. de, Oliveira, L. L. de, Fontinhas, R. L. & Lima, R. J. da S. 2005. Ilha do Marajó: Revisão histórica, hidroclimatologia, bacias hidrográficas e propostas de gestão. Holos Environment, 5(1), 65. DOI: https://doi.org/10.14295/holos.v5i1.331
» https://doi.org/10.14295/holos.v5i1.331 -
Lins-de-Barros, F. M. & Milanés, C. B. 2020. Os limites espaciais da zona costeira para fins de gestão a partir de uma perspectiva integrada. In: Gestão ambiental e sustentabilidade em áreas costeiras e marinhas: conceitos e práticas (pp. 22–50). Rio de Janeiro: Instituto Virtual para o Desenvolvimento Sustentável. Accessed: https://www.researchgate.net/publication/342747749_Os_limites_espaciais_da_zona_costeira_para_fins_de_gestao_a_partir_de_uma_perspectiva_integrada
» https://www.researchgate.net/publication/342747749_Os_limites_espaciais_da_zona_costeira_para_fins_de_gestao_a_partir_de_uma_perspectiva_integrada -
Lins-de-Barros, F. M., Klumb-Oliveira L.A. & Lima R.F. 2018. Avaliação histórica da ocorrência de ressacas marinhas e danos associados entre os anos de 1979 e 2013 no litoral do estado do Rio de Janeiro (Brasil). Revista de Gestão Costeira Integrada, 18, 85-102. DOI: https://doi.org/10.5894/rgci-n146
» https://doi.org/10.5894/rgci-n146 -
Lisbôa, T. de F. P. 2011. Vulnerabilidade ambiental da orla costeira do município de Salvaterra, Ilha de Marajó-PA, no trecho compreendido entre a foz do rio Paracauari e a ponta do Tapariuaçu. Revista Brasileira de Geografia Física, 4(1), 74. DOI: https://doi.org/10.26848/rbgf.v4i1.232663
» https://doi.org/10.26848/rbgf.v4i1.232663 -
Lloyd, M. G., Peel, D. & Duck, R. W. 2013. Towards a social–ecological resilience framework for coastal planning. Land Use Policy, 30(1), 925–933. DOI: https://doi.org/10.1016/j.landusepol.2012.06.012
» https://doi.org/10.1016/j.landusepol.2012.06.012 -
Luijendijk, A., Hagenaars, G., Ranasinghe, R., Baart, F., Donchyts, G. & Aarninkhof, S. 2018. The state of the world’s beaches. Scientific Reports, 8(1), 6641. DOI: https://doi.org/10.1038/s41598-018-24630-6
» https://doi.org/10.1038/s41598-018-24630-6 -
Martins, K. A., de Souza Pereira, P., Silva-Casarín, R. & Neto, A. V. N. 2017. The influence of climate change on coastal erosion vulnerability in northeast Brazil. Coastal Engineering Journal, 59(2), 1740007-1-1740007–25. DOI: https://doi.org/10.1142/S0578563417400071
» https://doi.org/10.1142/S0578563417400071 -
Menezes, M. O. B., Freitas, P. P., Baltazar, L. R. S., Rollnic, M. & Pinheiro, L. 2013. Estuarine processes in macro-tides of Amazon estuaries: A Study of Hydrodynamics and Hydrometeorology in the Marajó Bay (Pará-Brazil). Journal of Coastal Research, 165, 1176–1181. DOI: https://doi.org/10.2112/SI65-199.1
» https://doi.org/10.2112/SI65-199.1 -
Mota, L. S. O. & Souza, R. M. 2017. Vulnerabilidade à erosão costeira e riscos associados à ocupação: estudo de caso do município de Aracaju/Sergipe, Brasil. Territorium, (25 (I)), 89–102. DOI: https://doi.org/10.14195/1647-7723_25-1_7
» https://doi.org/10.14195/1647-7723_25-1_7 -
Muehe, D. 2001. Critérios morfodinâmicos para o estabelecimento de limites da orla costeira para fins de gerenciamento. Revista Brasileira de Geomorfologia, 2(1). DOI: https://doi.org/10.20502/rbg.v2i1.6
» https://doi.org/10.20502/rbg.v2i1.6 -
Muehe, D. 2006. Erosion in the Brazilian coastal zone: An overview. Journal of Coastal Research, 43–48. Accessed: https://www.researchgate.net/publication/295766358_Erosion_in_the_Brazilian_coastal_zone_An_overview?enrichId=rgreq-366299e93a2e3a86ebf87717234a874e-XXX&enrichSource=Y292ZXJQYWdlOzI5NTc2NjM1ODtBUzo5MzY0MDc0MDUxNjY1OTVAMTYwMDI2ODMzMTY3Ng%3D%3D⪙=1_x_2&\_esc=publicationCoverPdf
» https://www.researchgate.net/publication/295766358_Erosion_in_the_Brazilian_coastal_zone_An_overview?enrichId=rgreq-366299e93a2e3a86ebf87717234a874e-XXX&enrichSource=Y292ZXJQYWdlOzI5NTc2NjM1ODtBUzo5MzY0MDc0MDUxNjY1OTVAMTYwMDI2ODMzMTY3Ng%3D%3D⪙=1_x_2&\_esc=publicationCoverPdf -
Nascimento, D. M. C. & Dominguez, J. M. L. 2009. Avaliação da vulnerabilidade ambiental como instrumento de gestão costeira nos municípios de Belmonte e Canavieiras, Bahia. Revista Brasileira de Geociências, 39(3), 395–408. DOI: https://doi.org/10.25249/0375-7536.2009394395408
» https://doi.org/10.25249/0375-7536.2009394395408 -
Nguyen, T. T. X., Bonetti, J., Rogers, K. & Woodroffe, C. D. 2016. Indicator-based assessment of climate-change impacts on coasts: A review of concepts, methodological approaches and vulnerability indices. Ocean & Coastal Management, 123, 18–43. DOI: https://doi.org/10.1016/j.ocecoaman.2015.11.022
» https://doi.org/10.1016/j.ocecoaman.2015.11.022 -
Oliveira, D. M. & Frédou, F. L. 2011. Caracterização e dinâmica espaço-temporal da atividade pesqueira na baía de Marajó – Estuário Amazônico. Accessed: https://api.semanticscholar.org/CorpusID: 134617225
» https://api.semanticscholar.org/CorpusID -
Parthasarathy, A. & Natesan, U. 2015. Coastal vulnerability assessment: a case study on erosion and coastal change along Tuticorin, Gulf of Mannar. Natural Hazards, 75(2), 1713–1729. DOI: https://doi.org/10.1007/s11069-014-1394-y
» https://doi.org/10.1007/s11069-014-1394-y -
Pearlman, J., Buttigieg, P. L., Bushnell, M., Delgado, C., Hermes, J., Heslop, E., Hörstmann, C., Isensee, K., Karstensen, J., Lambert, A., Lara-Lopez, A., Muller-Karger, F., Munoz Mas, C., Pearlman, F., Pissierssens, P., Przeslawski, R., Simpson, P., van Stavel, J. & Venkatesan, R. 2021. Evolving and sustaining ocean best practices to enable interoperability in the UN decade of ocean science for sustainable development. Frontiers in Marine Science, 8. DOI: https://doi.org/10.3389/fmars.2021.619685
» https://doi.org/10.3389/fmars.2021.619685 -
Pendleton, E. A., Barras, J. A., Williams, S. J. & Twichell, D. C. 2010. Coastal vulnerability assessment of the Northern Gulf of Mexico to sea-level rise and coastal change. https://doi.org/https: // doi.org/10.3133/ofr20101146
» https://doi.org/10.3133/ofr20101146 -
Perini, L., Calabrese, L., Salerno, G., Ciavola, P. & Armaroli, C. 2016. Evaluation of coastal vulnerability to flooding: comparison of two different methodologies adopted by the Emilia-Romagna region (Italy). Natural Hazards and Earth System Sciences, 16(1), 181–194. DOI: https://doi.org/10.5194/nhess-16-181-2016
» https://doi.org/10.5194/nhess-16-181-2016 -
Prestes, Y. O., Silva, A. C., Rollnic, M. & Rosário, R. P. 2017. The M2 And M4 tides in the Pará river estuary. Tropical Oceanography, 45(1). DOI: https://doi.org/10.5914/tropocean.v45i1.15198
» https://doi.org/10.5914/tropocean.v45i1.15198 -
Ranieri, L. A., Rosário, R. P., Tritinger, A. S. & El-Robrini, M. 2022. Coastal dynamics on equatorial beaches of amazonian coast during extreme tide events. Pesquisas Em Geociências, 49(1), e116073. DOI: https://doi.org/10.22456/1807-9806.116073
» https://doi.org/10.22456/1807-9806.116073 -
Santos, V. F. dos, Short, A. D. & Mendes, A. C. 2016. Beaches of the Amazon Coast: Amapá and West Pará (pp. 67–93). DOI: https://doi.org/10.1007/978-3-319-30394-9_3
» https://doi.org/10.1007/978-3-319-30394-9_3 -
Schmidt, J. O., Bograd, S. J., Arrizabalaga, H., Azevedo, J. L., Barbeaux, S. J., Barth, J. A., Boyer, T., Brodie, S., Cárdenas, J. J., Cross, S., Druon, J.-N., Fransson, A., Hartog, J., Hazen, E. L., Hobday, A., Jacox, M., Karstensen, J., Kupschus, S., Lopez, J., Madureira, L. A. S.-P., Martinelli Filho, J. E., Miloslavich, P., Santos, C. P., Scales, K., Speich, S., Sullivan, M. B., Szoboszlai, A., Tommasi, D., Wallace, D., Zador, S. & Zawislak, P. A. 2019. Future ocean observations to connect climate, fisheries and marine ecosystems. Frontiers in Marine Science, 6. DOI: https://doi.org/10.3389/fmars.2019.00550
» https://doi.org/10.3389/fmars.2019.00550 -
Silva, L. M. da, Gonçalves, R. M., Lira, M. M. da S. & Pereira, P. de S. 2013. Modelagem fuzzy aplicada na detecção da vulnerabildade à erosão costeira. Boletim de Ciências Geodésicas, 19(4), 746–764. DOI: https://doi.org/10.1590/S1982-217020130004000014
» https://doi.org/10.1590/S1982-217020130004000014 -
Souza Filho, P. W. M. 2005. Costa de manguezais de macromaré da Amazônia: cenários morfológicos, mapeamento e quantificação de áreas usando dados de sensores remotos. Revista Brasileira de Geofísica, 23(4), 427–435. DOI: https://doi.org/10.1590/S0102-261X2005000400006
» https://doi.org/10.1590/S0102-261X2005000400006 -
Szlafsztein, C. F. 2009. Indefinições e obstáculos no gerenciamento da zona costeira do estado do Pará, Brasil. Revista de Gestão Costeira Integrada, 9(2), 47–58. DOI: https://doi.org/10.5894/rgci114
» https://doi.org/10.5894/rgci114 -
Szlafsztein, C. & Sterr, H. 2007. A GIS-based vulnerability assessment of coastal natural hazards, state of Pará, Brazil. Journal of Coastal Conservation, 11(1), 53–66. DOI: https://doi.org/10.1007/s11852-007-0003-6
» https://doi.org/10.1007/s11852-007-0003-6 -
Thieler, E. R., Himmelstoss, E. A., Zichichi, J. L. & Ergul, A. 2017. Digital shoreline analysis system (DSAS) version 4.0: An arcGIS extension for calculating shoreline change. https://www.usgs.gov/centers/whcmsc/science/digital-shoreline-analysis-system-dsas . Accessed: 4 December 2023.
» https://www.usgs.gov/centers/whcmsc/science/digital-shoreline-analysis-system-dsas -
Traini, C., Schrottke, K., Stattegger, K., Dominguez, J. L., Guimarães, J. K., Vital, H., Beserra, D. & da Silva, A. A. 2012. Morphology of subaqueous dunes at the mouth of the dammed river São Francisco (Brazil). Journal of Coastal Research, 285, 1580–1590. DOI: https://doi.org/10.2112/JCOASTRES-D-10-00195.1
» https://doi.org/10.2112/JCOASTRES-D-10-00195.1
-
Funding
This research was partially funded by project ”Adaptation and mitigation to environmental impacts and risks to coastal populations in Marajo Island” (PROEXIA MARAJO, PROEX N. 02/2019 UFPA).
Edited by
-
Associate Editor:
Eduardo Siegle