
 Atmospheric Corrosivity in Electric Power Transmission Towers: Limitations of Traditional Technical Specifications and the Challenges of Climate Changes
Abstract
Selecting materials for metallic structures such as transmission towers requires careful consideration of environmental dynamics, climate change, atmospheric variations, and human activity, all of which directly affect corrosion behavior. Relying on generic or incomplete data can lead to premature material degradation and increased maintenance costs. This study focuses on a 1,150 km transmission line spanning the Brazilian states of Ceará, Piauí, and Maranhão, where material selection was initially based on theoretical estimates of atmospheric aggressiveness (C3 category). However, frequent maintenance and component replacements indicated underestimated corrosivity. To improve understanding, environmental parameters (humidity, salinity, precipitation, and wind) were monitored, and field corrosion rates were determined using AISI 1020 and galvanized steel samples. Complementary analyses included electrochemical testing, microstructural evaluation, and accelerated aging under industrial and saline conditions. Additionally, an artificial intelligence tool based on feedforward neural networks was developed to enable rapid corrosivity classification through RGB/HSV image analysis, without requiring long-term field exposure or specialized equipment. After one year, the environment was reclassified as C5–Cx (extreme aggressiveness). These results highlight the importance of location-specific assessments over general assumptions and demonstrate how AI-based tools can enhance decision-making and maintenance strategies for more resilient power transmission infrastructure in a changing climate.
Keywords:
Electrical energy transmission line; Atmospheric corrosion; Corrosivity classification; Tropical climate; Artificial neural networks
1. Introduction
Atmospheric corrosion represents a significant challenge to the durability and performance of assets in Brazil's power sector. This is mainly because they are exposed to a variety of aggressive environments across more than 180,000 km of infrastructure, resulting in degradation rates that may compromise structural integrity, increase maintenance costs, and impact operational continuity.
Recent scientific evidence demonstrates that northeastern Brazil is experiencing significant climatic alterations that fundamentally modify corrosivity patterns. Comparative analyses reveal reductions in precipitation ranging from 10% to 40% across various areas of the Northeast region, with temperature increases of approximately 1°C, particularly in Maranhão, Piauí, and Ceará. Climate projections indicate an "expressive reduction in precipitation during respective rainy periods of Northeast sub-regions, and increases in maximum temperatures" thus creatin environmental conditions that surpass traditional corrosivity expectations1,2.
Field measurements conducted along the studied transmission line corroborate these climatic conditions. Meteorological monitoring at five substations recorded average temperatures ranging from 23.2°C to 27.9°C (mean 26.3 ± 1.9°C), relative humidity between 71.7% and 75.1% (mean 73.7 ± 1.3%), and wind speeds averaging 2.5 ± 0.3 m/s, with gusts exceeding 50 m/s. Time of wetness estimates, defined as the annual period during which relative humidity exceeds 80% and temperature remains above 0 °C, ranged from approximately 2,600 to 4,600 hours per year - conditions classified as high surface moisture exposure according to ISO 92233. The exposure sites are located at distances varying from 7 km to 97 km from the coastline, where chloride deposition rates in similar northeastern Brazilian coastal environments have been reported to range from 60 to over 380 mg Cl−/m2.day, depending on distance from the sea and local wind patterns4,5.
Despite these evolving conditions, transmission line and substation projects continue to rely on normative classifications and generic climate maps, such as those outlined in ISO 92233, which present fundamental limitations for tropical and subtropical environments. Systematic evaluation reveals widespread inadequacy in tropical coastal environments worldwide. Studies in the Canary Islands found measured corrosion rates that exceeded the highest C5 corrosivity category, while investigations in Cuba reported chloride deposition rates reaching 760–779 mg/m2.day at coastal sites, with corrosivity classifications ranging from C3 to CX depending on distance from the shoreline6. In Southeast Asia, research along Thailand's Gulf coast documented chloride deposition exceeding 500 mg/m2.day at beachfront locations, with exponential decay patterns influenced by monsoon wind regimes7. Similarly, field campaigns in João Pessoa, northeastern Brazil, measured chloride levels above 500 mg/m2.day within 10 m of the coastline, decreasing to approximately 50–100 mg/m2.day at 500 m inland5.
These findings collectively demonstrate that ISO 92233, developed primarily from temperate climate data, systematically underestimates corrosivity in tropical environments where high temperatures (> 25°C), elevated relative humidity (> 70%), and marine aerosol exposure act synergistically to accelerate degradation processes. Operationally, ISO 92233 mandates data collection over a minimum period of 12 months, with reliable results impossible from shorter exposures, while economic barriers include costs up to $7,000 USD for auxiliary equipment. Most critically, these traditional gravimetric methods cannot assess operational structures where samples cannot be retrieved, creating systematic gaps in infrastructure evaluation capabilities. Moreover, ISO 92233 does not include corrosivity categories above C5, which hinders the proper classification of extreme environments frequently encountered in tropical coastal regions. Furthermore, coupons can only measure the average rate of corrosion during exposure periods, and analyses can only be performed after sample retrieval, making them unsuitable for detecting changes in corrosion under transient operating conditions8,9 .
In response to these limitations, advanced monitoring and assessment methodologies have emerged as promising alternatives that address both temporal and operational constraints. Comprehensive reviews demonstrate that machine learning approaches show superior performance in atmospheric corrosion prediction compared to conventional statistical methods, with neural networks achieving R2 values of 0.987 compared to traditional empirical models that typically achieve R2< 0.07, representing more than an order-of-magnitude improvement in prediction accuracy. Research has validated the effectiveness of atmospheric corrosion monitoring (ACM) sensors combined with predictive modeling, achieving 94.7% prediction accuracy and enabling continuous assessment capabilities that traditional gravimetric methods cannot provide. These sensor-based approaches have been successfully validated in tropical climates, delivering the rapid diagnostic capabilities required for modern infrastructure management under changing environmental conditions, while meeting the critical need for non-disruptive evaluation of operational structures10,11 .
Building on this technological foundation and the urgent need for improved corrosion assessment in Brazil's changing climate, Pacher et al.12 conducted an initial investigation of corrosion rates for both AISI 1020 carbon steel and hot-dip galvanized steel under field exposure along a 1,150 km transmission line across Ceará, Piauí, and Maranhão. The results indicated corrosion loss in carbon steel ranging from 20 µm/year to 325 µm/year, and in galvanized steel from 1.5 µm/year to 12 µm/year. Substation samples exhibited high to extreme corrosivity (C4 to Cx), with carbon steel losses between 23 µm/year and 225 µm/year, and galvanized steel between 1.3 and 10 µm/year. These findings underscore the elevated environmental aggressiveness across both towers and substations, surpassing initial expectations based on normative classifications. While that study established the discrepancy between normative predictions and field-measured corrosivity through conventional gravimetric and electrochemical methods, the present work advances beyond characterization toward predictive capability, developing an artificial intelligence tool that enables rapid environmental assessment through RGB/HSV image analysis without requiring extended exposure periods or specialized laboratory equipment.
In the state of Santa Catarina, southern Brazil, Ferreira et al.13 demonstrated that numerous damages to local transmission lines have resulted from severe weather events, with a discernible increasing trend over time. To address this concern, the authors proposed the development of a Severe Weather Index (SWI) aimed at identifying potential storm risks that could compromise these assets. The SWI was constructed using data from the Eta model at a 20 km resolution, incorporating projections from three global climate models, alongside a 5 km resolution Eta model covering both historical and future periods. Their findings indicated that the SWI effectively captured the region's intense storms, serving as a valuable tool for assessing climatic risks and enabling the creation of more accurate planning strategies for transmission line infrastructure, thereby enhancing resilience against extreme weather events.
Atmospheric corrosivity has undergone significant changes over the past decades, driven by the increasing frequency and intensity of extreme weather events. As a result, environments previously classified as moderately corrosive have, in practice, exhibited much more aggressive conditions. This shift is primarily attributed to the synergistic effects of marine aerosol, industrial pollution, and specific microclimatic conditions. These factors have evolved due to global climate change, including rising ambient temperatures, increased precipitation levels, higher relative humidity, enhanced ultraviolet (UV) radiation, elevated wind speeds, and greater concentrations of corrosive gases, most notably carbon dioxide (CO2). These environmental parameters are widely recognized as accelerants of corrosion initiation and propagation14.
Considering the ongoing changes in environmental conditions and the increasing levels of atmospheric aggressiveness, it has become critical to implement methodologies capable of providing accurate and context-specific characterization of local environmental parameters. In this regard, rapid and short-duration assessment techniques have emerged as valuable tools, offering reliable and timely diagnostics of environmental corrosivity. These methods contribute significantly to the technical basis for the selection of appropriate materials and the strategic planning of maintenance interventions.
Therefore, this study aims to: (i) quantify the systematic discrepancy between normative corrosivity classifications (C3) and measured environmental aggressiveness (C5–Cx) along a 1,150 km transmission line spanning Ceará, Piauí, and Maranhão; (ii) develop and validate an AI-based tool using RGB/HSV image analysis for rapid corrosion assessment of galvanized structures; (iii) integrate field exposure, electrochemical analysis, and artificial intelligence into a comprehensive methodology for atmospheric corrosivity characterization; and (iv) demonstrate the practical applicability of this approach for optimizing maintenance strategies in Brazil’s power sector under changing climatic conditions.
2. Materials and Methods
This study was conducted using AISI 1020 and hot-dip galvanized steel coupons, materials predominantly employed in the construction of transmission line towers in the study region, which extends across Ceará, Piauí, and Maranhão and covers approximately 1,150 km (Figure 1). The objective of the study was to evaluate an experimental approach capable of reproducing the actual performance of this alloy when exposed to the effects of weathering over a complete seasonal cycle. Specifically, the aim was to measure the corrosion rate experienced by the material and subsequently classify the atmospheric corrosivity based on the criteria established by ISO 92233.

Map of the 1,150 km transmission line (TL) studied for atmospheric corrosivity assessment, spanning from Pecém II substation (CE) to Bacabeira substation (MA), through Acaraú (CE), Tianguá (CE), and Parnaíba (PI). The figure shows distances from the coastline (7–97 km) and local meteorological conditions at each exposure site.
The 40 sampling points were strategically distributed along the transmission line according to three main criteria: (i) inclusion of all five substations - Pecém, Acaraú, Tianguá, Parnaíba, and Bacabeira - with four monitoring positions established at each site; (ii) selection of 20 additional towers along the route to capture environmental variability over the 1,150 km extension; and (iii) representation of distinct corrosivity levels (high, medium, and low), defined based on preliminary field observations by maintenance teams, distance from the coastline (ranging from 7 km at Pecém to 97 km at Tianguá), and the presence of natural barriers.
For this study, metal cylindrical coupons were prepared for the 40 field locations, using two different materials. The specimens, with approximate dimensions of (15 × 80) mm, were installed on transmission towers and substations for one year of atmospheric exposure. Triplicate specimens were used at each sampling point, with quarterly retrievals performed throughout the exposure period. The tested materials, shown in Figure 2, were: (i) AISI 1020 steel and (ii) galvanized steel with a coating thickness comparable to that of the structural elements of the towers (approximately 100 µm). The metallic coupons were mounted at a height of 20 m, as illustrated in Figure 2a and 2b, covering all 40 sampling points along the transmission line and at the substations.

Test specimens used in the atmospheric corrosion study: (a) cylindrical coupons of AISI 1020 carbon steel and galvanized steel with dimensions (15 × 80) mm; and (b) field installation at 20 m height on transmission line towers. This elevation corresponds to the zone of maximum environmental aggressiveness observed on galvanized structures.
All coupons (1,440 units) were previously characterized, treated to remove surface corrosion and grease, weighed, packaged, labeled, and sent to the designated exposure sites. After their respective exposure periods, the specimens were repackaged and transported to the laboratory for preliminary surface imaging, performed under controlled lighting conditions, fixed photographic parameters, and a standardized focal distance. The methodology for mass loss testing, specimen preparation, and corrosion classification was based on established technical standards (3,15–19).
Weather stations were installed at the same locations as the exposure sites for the test specimens, as illustrated in Figure 3a. Local images of the transmission tower lattices were captured at both installation and removal of the coupons. A specially fabricated metal frame was employed (Figure 3b) to ensure consistent imaging of the same areas with a fixed focal distance. Camera parameters were standardized to maintain uniform photographic conditions throughout the study.

Images of transmission line towers showing components used for corrosion rate assessment: (a) meteorological station installed at the exposure site; and (b) metal template employed for standardized photographic recording of the tower truss. Both devices were positioned at approximately 20 m height.
Accelerated aging tests were also conducted in the laboratory using a salt spray chamber (according to ISO 922720) and exposure to an atmosphere containing sulfur dioxide (according to ISO 698821) as additional references for comparing material behavior and surface appearance. The results of these tests, together with the field monitoring data, were used to build the database for the development of an artificial intelligence (AI) based tool aimed at the rapid prediction of corrosion rates in lattice structures. This prediction was based on images of oxidized areas monitored throughout the experimental study. The salt spray procedure lasted 750 h, with intermediate assessments every 250 h, while the sulfur dioxide chamber test lasted 72 h, with evaluations every 24 h.
It should be noted that these accelerated tests were not intended to establish direct temporal correlations with field exposure, as ISO 9227 itself states that salt spray methods "are not intended to be used as a means of predicting long-term corrosion resistance of the tested material"20. This limitation is supported by peer-reviewed studies demonstrating that continuous salt spray testing produces corrosion mechanisms fundamentally different from atmospheric exposure, where wet/dry cycling enables protective patina formation22. Therefore, the primary objective of these laboratory tests was to generate surface oxidation patterns at controlled intervals, thereby expanding the image dataset with specimens exhibiting varying degrees of degradation under reproducible conditions. This approach enabled the AI model to recognize corrosion features across a broader spectrum of severity levels than could be captured from field samples alone within the study timeframe.
Electrochemical tests of open circuit potential (OCP) and electrochemical impedance spectroscopy (EIS) were conducted to obtain corrosion data, according to international ASTM standards (23–25). A Gamry 3000 potentiostat was employed, with a saturated calomel electrode (SCE) as the reference electrode and a graphite bar as the counter electrode in an electrochemical cell. The electrolyte was an aqueous NaCl solution at 3.5% by mass. The OCP was recorded after potential stabilization and prior to the EIS test, which was performed with an amplitude of 10 mV and a frequency sweep from 10 kHz to 100 mHz.
Potentiodynamic polarization curves (Tafel method) were also obtained by applying a potential sweep of approximately ± 250 mV relative to the open-circuit potential. The scan began at the more negative (cathodic) potential and proceeded toward the more positive (anodic) end at a rate of 0.1667 mV·s−1.
The results of these electrochemical and accelerated tests, combined with the field monitoring data, contributed to the dataset used in the development of the AI-based prediction tool. This tool relies on images of oxidized areas monitored throughout the study.
Computational modeling was conducted in parallel to train an artificial neural network using both standard specimens and samples (AISI 1020 and galvanized steel) aged either naturally or in artificial weathering chambers, partially following the methodology presented by Pacher et al.12 Numerical image parameters were extracted from the red, green, and blue color channels (RGB system) as well as hue, saturation, and value components (HSV system). Pearson’s correlation coefficient (PCC) was employed to examine the visual appearance of the coupons throughout seasonal stages of corrosion onset, using the RGB and HSV spectra.
Python was used as the platform to process the images and convert them into the RGB format. The feedforward neural network (FFNN) for predicting mass loss was implemented using the TensorFlow library, with the following architecture: five dense layers with 512, 512, 256, 128, and 128 neurons, respectively; ReLU activation functions for hidden layers and Softmax for the output layer; and a dropout rate of 0.3 applied before the final dense layer to prevent overfitting. The Adam optimizer was employed with an initial learning rate of 0.001, β1 = 0.9, β2 = 0.999, and ε = 1×10⁻⁷. Mean Absolute Error (MAE) was used as the evaluation metric. Training was conducted over 2,000 initial epochs with early stopping implemented after 10 consecutive epochs without validation improvement. A batch size of 32 was used, and the dataset was split into 70%, 20%, and 10% for training, validation, and testing, respectively.
A general overview of the galvanized steel specimens aged seasonally and processed using the RGB and HSV color spaces is presented in Figure 4. After training the neural network, whose output was correlated with the specimens relative mass losses, a multi-stage methodology was employed. This approach leveraged complementary strengths of both R-CNN and FFNN networks to segment the object of interest and extract its specific features. Subsequently, these procedures were applied to 502 images of the tower trusses aged during the same periods as the specimens, aiming to estimate their relative mass loss, since those samples could not be retrieved from the field.

Artificial intelligence image processing workflow for galvanized steel corrosion assessment: (left to right) original coupon photograph, automated sample identification, and RGB/HSV pixel extraction. The extracted color parameters serve as input features for the artificial neural network trained to predict corrosion rates from visual appearance.
Based on these results, a computational tool was developed to calculate the corrosion rate of the tower lattice structures, utilizing field images and the trained artificial neural network (ANN).
3. Results and Discussions
The average mass loss for galvanized coupons seasonally exposed on towers and substations across the states of Ceará, Piauí, and Maranhão was (0.17 ± 0.55) g/year, corresponding to a thickness loss of (5.92 ± 6.60) µm/year after one year of exposure; and (0.10 ± 0.55) g/year, corresponding to a thickness loss of (3.79 ± 6.60) µm/year. The measured dispersion was attributed to local climatic conditions, the number of specimens exposed, and the variable distances of the network from the seashore (ranging from 7 km to 97 km), reflecting different levels of atmospheric aggressiveness. According to ISO 12944-226 recommendations, the local atmospheric corrosivity ranged from C3 to Cx.
The Cx category, introduced in the 2018 revision of ISO 12944-2, represents extreme corrosivity environments where first-year mass loss rates exceed 1,500 g/m2 for low-carbon steel (corresponding to thickness loss> 200 µm) and 60 g/m2 for zinc (thickness loss> 8.4 µm). This category was specifically created to address offshore areas with high salt content, industrial zones with extreme humidity, and aggressive tropical or subtropical atmospheres (conditions that closely match the environmental characteristics observed along the studied transmission line)26. Although ISO 92233 does not formally include the Cx category, this classification was adopted here due to its alignment with the corrosion-rate thresholds observed in tropical marine/subtropical atmospheres such as northeastern Brazil. The use of ISO 12944-226 therefore better enables the categorization of extreme corrosivity conditions beyond the upper C5 limits defined in ISO 92233.
For AISI 1020, the local atmospheric corrosivity classification was more severe than for galvanized steel, ranging from C2 to Cx (85% of cases). The average mass loss at substations (ES) was (2.47 ± 0.73) g/year, corresponding to a thickness loss of (74.69 ± 22.01) µm/year. On the transmission line, the values averaged (6.32 ± 3.65) g/year, with thickness loss of (191.14 ± 110.20) µm/year, indicating that environmental aggressiveness on towers was significantly higher at 20 m above ground. According to the measurements, the corrosion rate observed at the most critical locations fell within the highest corrosivity categories defined by the standard26, particularly C5 and Cx, in areas near the seashore and in regions with high contaminant deposition. This behavior highlights how microclimatic, geographic, and operational factors can strongly influence local corrosivity conditions, often not fully captured by conventional environmental classification tools.
3.1. Corrosion rate by potentiodynamic polarization (tafel method)
Figure 5 presents representative potentiodynamic polarization curves of AISI 1020 steel and galvanized steel coupons exposed in substations and transmission lines. In substations, the analyzed samples were ES-Acaraú (AUT-33CD, AUT-31CF) and ES-Tianguá (TGD-43AD), while in transmission lines, the samples were TL-Acaraú (3TF-38), TL-Bacabeira (4FE-127), and TL-Parnaíba (3OE-292).

Representative potentiodynamic polarization curves obtained from field-exposed specimens in 3.5 wt% NaCl solution. Curves include galvanized steel samples from substations (AUT-33CD, AUT-31CF, TGD-43AD) and transmission lines (3TF-38, 4FE-127, 3OE-292), compared with unexposed AISI 1020 and galvanized steel references. The shift in corrosion potential and current density reflects the varying degrees of atmospheric degradation.
The corrosion potential (Ecorr) and instantaneous corrosion rates of galvanized samples exposed in substations at Acaraú-CE (AUT-33CD and AUT-31CF) and Tianguá-CE (TGD-43AD) were as follows: i) AUT-33CD: Ecorr = –1.080 V vs SCE; corrosion rate = 0.71 µm/year; ii) AUT-31CF: Ecorr = –1.060 V vs SCE; corrosion rate = 0.51 µm/year; and iii) TGD-43AD: Ecorr = –0.966 V vs SCE; corrosion rate = 25.50 µm/year. The corrosion rates for galvanized samples exposed in substations generally fell within the typical range of 0.7 to 2.1 µm/year defined by ISO 92233 for C3 urban environments with medium pollution.
For the samples installed at TL-Acaraú (3TF-38), TL-Bacabeira (4FE-127), and TL-Parnaíba (3OE-292), the Ecorr values were –1.110 V vs SCE with corrosion rate = 1.01 µm/year, –0.972 V vs SCE with corrosion rate = 2.20 µm/year, and –0.996 V vs SCE with corrosion rate = 13.40 µm/year, respectively. These results correspond to corrosivity classifications ranging from C3 to Cx3.
In field-derived specimens, cathodic protection of the AISI 1020 steel substrate by zinc was also detected. This was evidenced by a more negative corrosion potential (Ecorr = –0.690 V vs SCE) and by reduced relative corrosion rates, while the steel substrate exhibited a rate of 102.2 µm/year. Table 1 presents the values obtained from the linear fitting of the parameters of the equivalent electrical circuit.
Adjusted parameters of the equivalent electrical circuit obtained from EIS fitting for galvanized steel samples exposed in the field. Rs represents the solution resistance, Rp the polarization resistance, CPE the constant phase element, n the dispersion factor, and W the Warburg impedance. Associated errors are shown in parentheses.
The equivalent circuit parameters were determined using Gamry Analyst software through complex nonlinear least squares fitting. The percentage errors, typically below 5% for most parameters, indicate adequate agreement between experimental data and the proposed equivalent circuit models.
The equivalent circuit components have the following physical significance: Rs represents the solution resistance, encompassing the ohmic resistance of the electrolyte between the reference and working electrodes; Rp is the polarization resistance, associated with the charge transfer process at the metal/electrolyte interface and inversely proportional to the corrosion rate; CPE (constant phase element) accounts for the non-ideal capacitive behavior of the electrical double layer, reflecting surface heterogeneity and porosity of the corrosion product layer; the exponent n indicates the deviation from ideal capacitor behavior (n = 1 for an ideal capacitor), with lower values reflecting increased surface roughness or heterogeneous current distribution; and W is the Warburg impedance, representing diffusion-controlled processes through the porous corrosion product layer, evidenced by the 45° linear region observed at low frequencies in the Nyquist plots for samples AUT-33CD, AUT-31CF, 3TF-38, and 4FE-12727.
The electrochemical parameters of the field-exposed galvanized specimens were analyzed using the same procedures as in the accelerated tests, excluding series resistance (Rs) from the discussion. The measured capacitance values, in the mF range, were lower than those obtained in laboratory tests, suggesting the formation of more compact corrosion products. The polarization resistance (Rp) was substantially higher in field samples, indicating the presence of a more effective protective layer. Samples 3OE-292 and TGD-43AD exhibited the highest Rp values and showed no apparent diffusion processes in the Nyquist diagrams. The parameter n, associated with surface homogeneity and the porosity of corrosion products, was also higher in these samples, denoting more uniform surfaces and finer, adherent corrosion layers (27–29).
Figure 6 shows the surface of a new carbon steel coupon and the same coupon after one year of exposure on a transmission line tower, before and after the surface pickling treatment.

Progressive stages of AISI 1020 carbon steel corrosion assessment: (a) unexposed reference specimen; (b) coupon after one year of atmospheric exposure showing extensive rust formation; and (c) specimen after chemical cleaning according to ASTM G1-9030 standard, revealing the underlying metal surface for gravimetric analysis. The significant material loss illustrates the high environmental aggressiveness of the tropical coastal climate.
The Tianguá-CE region is characterized by a warm semi-arid tropical climate with mild variations and a warm sub-humid tropical climate. It is located in the Ibiapaba Plateau at an altitude of 775.92 m31. The average annual precipitation is 1,210.3 mm, with a pronounced rainy season from January to May. These climatic conditions likely contribute to the elevated corrosion rates observed in this area.
Figure 7 shows the Nyquist plots obtained from EIS tests and the corresponding equivalent electrical circuits. Based on linear fitting using the equivalent circuits (Figure 7b–c), the samples ES-Acaraú (AUT-33CD, AUT-31CF) and, among the transmission lines, TL-Acaraú (3TF-38) and TL-Bacabeira (4FE-127) were better represented by the model that includes diffusion processes, as evidenced by the Warburg element (Figure 7c). Conversely, the other samples were adequately represented by a circuit without the Warburg element, i.e., without diffusion, as shown in Figure 7b.

Nyquist plots obtained from field-exposed galvanized steel samples (a), together with the equivalent electrical circuits used for fitting: (b) circuit without diffusion, consisting of solution resistance (Rs), polarization resistance (Rp), and constant phase element (CPE); and (c) circuit including the Warburg element (W), representing pronounced diffusion processes.
The distinct electrochemical behavior observed in the field samples suggests variations in the nature and composition of the corrosion products on their surfaces, including the formation of porous byproducts that promote diffusion processes.
3.2. Numerical modeling
The results of the numerical modeling of corrosion rates in a controlled environment (salt spray chamber) showed a high degree of accuracy in predicting both the actual mass loss and the values obtained through image processing and network analysis. For carbon steel, the measured value was (1,184.00 ± 225.60) g/year compared to a predicted value of (1,203.95 ± 201.79) g/year. For galvanized steel, the measured value was (69.93 ± 46.03) g/year, while the predicted value was (67.97 ± 41.25) g/year.
The electrochemical results corroborated the mass loss measurements, even at the evaluation point where no measurable corrosion rate was observed for galvanized steel, a behavior consistent with the aggressiveness pattern verified in the AISI 1020 steel analysis.
According to AI analysis (Figure 8), for AISI 1020 steel, the digital results indicated that the ES-Acaraú site exhibited more significant mass loss compared to the other substations. This outcome was consistent with the findings from quantitative experiments. In contrast, galvanized steel showed standardized behavior across samples, both in substations and transmission lines. The results predicted by AI (Figure 8) were in agreement with the experimental thickness loss data for both materials at the respective sampling points, as illustrated in the graphs for AISI 1020 and galvanized steel.

Corrosion rates of AISI 1020 and galvanized steel coupons exposed in the field and analyzed by artificial intelligence (AI). (a) Thickness loss measured in galvanized steel coupons at electrical substations (ES). (b) Corrosion rates of galvanized steel predicted by AI at the same substations. (c) Thickness loss measured in AISI 1020 steel coupons on transmission line (TL) towers. (d) Corrosion rates of AISI 1020 steel predicted by AI for the same TL locations. The comparison illustrates the agreement between experimental measurements and AI-based predictions for both materials.
As verified, the integration of field measurements, laboratory tests, and digital tools has proven to be an effective strategy that can be applied to the electric power sector, as it enables short-term assessment of corrosion. This integrated model demonstrated better adaptability and accuracy in diagnosing corrosivity, especially under unstable and ever-changing environmental conditions.
Based on AI learning, a predictive calculator for the corrosion rate of galvanized steel was developed and applied to estimate mass loss from images of transmission tower trusses.
Figure 9 presents examples of photographs extracted from galvanized steel truss structures of towers. The images were obtained using a standardized template to define representative areas for analysis, both in transmission lines (e.g., TL Acaraú-CE – Parnaíba-PI) and in substations (Acaraú-CE). These areas were processed by the artificial neural network (ANN) for corrosion assessment. The images highlight the presence of white corrosion (Figure 9 a–d) and red corrosion (Figure 9 a, c, d), indicating that the substrate had already been affected.

Photographs of galvanized steel tower truss structures used for AI-based corrosion analysis. (a, b) North and east faces of the Acaraú (CE)–Parnaíba (PI) transmission line. (c, d) East and north faces of the Acaraú (CE) substation. The images were acquired with a standardized template to delimit representative areas for analysis. White corrosion (a–d) and red corrosion (a, c, d) can be observed, indicating that the galvanized coating had already deteriorated, exposing the substrate.
From the AI methodology, the tool under development for estimating mass loss (g) may serve as a qualitative and rapid means of approximating the condition of materials in the field. Nevertheless, visual inspection remains essential, since localized corrosion can be as critical as generalized corrosion in compromising the final structural strength. An image of the software interface under development is shown in Figure 10.

Example of the software interface under development for estimating the mass loss of metallic materials such as transmission tower trusses. The interface, presented in Portuguese, illustrates one of the tested cases, showing the estimated corrosion mass loss value generated by the AI-based tool.
Additionally, the AI-based tool employs color scales to generate maps indicating the degree of corrosion near sampled points, with red representing a higher probability of corrosion. This visualization facilitates statistical extrapolation and is illustrated in Figure 11. The approach is noteworthy for its ease of interpretation and its potential as a support resource for asset management.
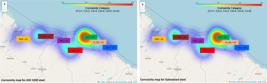
Classification maps of atmospheric corrosivity categories generated by artificial neural networks (ANN) for AISI 1020 carbon steel and galvanized steel in the Northeast region of Brazil, encompassing the states of Ceará, Piauí, and Maranhão. The color scale represents the probability of corrosion, with red indicating higher aggressiveness and blue lower aggressiveness. These maps illustrate the potential of AI-based tools to spatially extrapolate localized measurements into regional corrosivity classifications, supporting predictive asset management.
Throughout the study, it was evident that the experimental methodology adopted, based on gravimetric testing of field-exposed specimens for at least one year, provides an effective and representative approach for mapping local environmental aggressiveness. Although conceptually simple, its practical application requires specialized labor, both for the installation and retrieval of field systems and for the subsequent stages of chemical cleaning and laboratory analysis. In addition, the method demands frequent field mobilizations and adequate laboratory infrastructure, which can lead to high costs and extended timelines. Despite its high representativeness and ability to generate reliable data for supporting maintenance decisions and material selection, the time required for execution is not always compatible with the operational demands of utility companies.
4. Conclusion
The results of this study highlighted the high aggressiveness of atmospheric corrosivity on AISI 1020 and galvanized steels along the transmission line crossing the states of Ceará, Piauí, and Maranhão. The corrosion rates recorded, often corresponding to categories C5 and Cx for both metals, revealed a clear discrepancy between the actual exposure conditions and the assumptions derived from normative classifications and generalized climatic projections, which had indicated moderate corrosivity (C3) for the region, given its significant distance from the coastline.
This scenario reinforces the need for local characterization of atmospheric corrosivity as a critical step for accurate material specification and effective planning of maintenance strategies in the electrical sector. Regardless of the methodology employed, detailed knowledge of the real environmental conditions is indispensable to ensure asset durability and operational continuity. This requirement is particularly relevant in Brazil, a country marked by vast territorial extension and high climatic diversity. Regions characterized by severe environmental conditions, such as the Northeast, demand approaches that effectively capture local specificities.
The AI-based tool developed in this study offers practical advantages for transmission line operators by enabling rapid corrosivity assessment without requiring extended field exposure periods or specialized laboratory equipment. The methodology can be implemented using standard digital cameras and portable computing devices, allowing maintenance teams to perform on-site evaluations during routine inspections. This approach has the potential to support condition-based maintenance strategies, enabling more efficient allocation of resources by prioritizing interventions in areas identified as having higher corrosivity levels.
This study has some limitations that should be acknowledged, even while following manuscript trends and related standardizations. The field exposure period was limited to one year, which may not fully capture long-term corrosion behavior and seasonal variations across multiple years. The AI model was trained on data from a specific geographic region with particular climatic characteristics, and its applicability to other environments requires further validation. Additionally, the current methodology focuses on visual assessment of surface degradation and does not directly measure subsurface damage or localized corrosion phenomena that may affect structural integrity.
5. Acknowledgments
The authors would like to acknowledge the support in financial resources and infrastructure by the companies ARGO ENERGIA, ANEEL and Lactec, R&D project 010737-0002_2022.
Data Availability
6. References
-
1 INMET: Instituto Nacional de Meteorologia. Normais Climatológicas do Brasil 1991-2020 [Internet]. Brasília: Ministério da Agricultura e Pecuária; 2024 [cited 2025 Set 22]. Available from: https://portal.inmet.gov.br/
» https://portal.inmet.gov.br/ -
2 Pampuch LA, Bueno PG, Reboita MS, Tomaziello ACN, Nunes AMP, Cardoso AA, et al. Brazil climate highlights 2023. Ann N Y Acad Sci. 2025;1549(1):120-38. http://doi.org/10.1111/nyas.15394
» http://doi.org/10.1111/nyas.15394 - 3 ISO: International Organization for Standardization. ISO 9223: corrosion of metals and alloys — corrosivity of atmospheres — classification, determination and estimation. Geneva: ISO; 2012.
-
4 Sica YC, Kenny ED, Portella KF, Campos DF Fo. Atmospheric corrosion performance of carbon steel, galvanized steel, aluminum and copper in the North Brazilian Coast. J Braz Chem Soc. 2007;18(1):153-66. http://doi.org/10.1590/S0103-50532007000100017
» http://doi.org/10.1590/S0103-50532007000100017 -
5 Meira GR, Andrade MC, Padaratz IJ, Alonso MC, Borba JC Jr. Measurements and modelling of marine salt transportation and deposition in a tropical region in Brazil. Atmos Environ. 2006;40(29):5596-607. http://doi.org/10.1016/j.atmosenv.2006.04.053
» http://doi.org/10.1016/j.atmosenv.2006.04.053 -
6 Castañeda A, Corvo F, Howland JJ, Marrero R. Penetration of marine aerosol in a tropical coastal city: havana. Atmosfera (Mex). 2018;31(1):87-104. http://doi.org/10.20937/ATM.2018.31.01.06
» http://doi.org/10.20937/ATM.2018.31.01.06 -
7 Pongsaksawad W, Palsson NS, Khamsuk P, Sorachot S, Chianpairot A, Viyanit TSE, et al. Atmospheric corrosion monitoring sensor in corrosion rate prediction of carbon and weathering steels in Thailand. Mater Trans. 2020;61(12):2348-56. http://doi.org/10.2320/matertrans.MT-M2020230
» http://doi.org/10.2320/matertrans.MT-M2020230 -
8 Komary M, Komarizadehasl S, Tošić N, Segura I, Lozano-Galant JA, Turmo J. Low-cost technologies used in corrosion monitoring. Sensors (Basel). 2023;23(3):1309. http://doi.org/10.3390/s23031309
» http://doi.org/10.3390/s23031309 -
9 Morales J, Martín-Krijer S, Díaz F, Hernández-Borges J, González S. Atmospheric corrosion in subtropical areas: influences of time of wetness and deficiency of the ISO 9223 norm. Corros Sci. 2005;47(8):2005-19. http://doi.org/10.1016/j.corsci.2004.09.005
» http://doi.org/10.1016/j.corsci.2004.09.005 -
10 Coelho LB, Zhang D, Van Ingelgem Y, Steckelmacher D, Nowé A, Terryn H. Reviewing machine learning of corrosion prediction in a data-oriented perspective. Mater Degrad. 2022;6(1):8. http://doi.org/10.1038/s41529-022-00218-4
» http://doi.org/10.1038/s41529-022-00218-4 -
11 Pei Z, Zhang D, Zhi Y, Yang T, Jin L, Fu D, et al. Towards understanding and prediction of atmospheric corrosion of an Fe/Cu corrosion sensor via machine learning. Corros Sci. 2020;170:108697. http://doi.org/10.1016/j.corsci.2020.108697
» http://doi.org/10.1016/j.corsci.2020.108697 -
12 Pacher CMG, Albrecht JSC, Bragança MOGP, Kowalczuk BC, Lamy L, Andrade J, et al. An efficient and time-effective experimental and numerical methodology for mapping atmospheric corrosivity and assessing corrosion-related failures in power transmission lines and substations. Mater Res. 2025;28(suppl. 1):e20250097. http://doi.org/10.1590/1980-5373-mr-2025-0097
» http://doi.org/10.1590/1980-5373-mr-2025-0097 -
13 Ferreira NCR, Tavares PS, Medeiros GS, Ferreira LN, Borges P, Chou SC, et al. Projections of severe weather and the impacts on transmission line towers in Santa Catarina, Brazil, under future scenarios of global climate change. Derbyana. 2023;44:1-17. http://doi.org/10.14295/derb.v44.808
» http://doi.org/10.14295/derb.v44.808 - 14 Lopes MLF, Rodrigues E No, Carvalho MTM, Caldas LR. Mudanças climáticas e durabilidade das construções: uma revisão crítica do estado da arte. In: IV euroELECS; 2021 Nov 10-12. Anais. Porto Alegre: Associação Nacional de Tecnologia do Ambiente Construído; 2021. p. 630–643.
- 15 ABNT: Associação Brasileira de Normas Técnicas. ABNT NBR 6209: materiais metálicos não revestidos – ensaio não acelerado de corrosão atmosférica. Rio de Janeiro: ABNT; 2007.
- 16 ABNT: Associação Brasileira de Normas Técnicas. ABNT NBR 6210: corrosão atmosférica – materiais metálicos – preparo, limpeza e determinação da taxa de corrosão de corpos-de-prova em ensaios de corrosão. Rio de Janeiro: ABNT; 2008.
- 17 ASTM: American Society for Testing and Materials. ASTM G 1-03 e1: standard practice for preparing, cleaning, and evaluating corrosion test specimens. West Conshohocken: ASTM; 2017.
- 18 ISO: International Organization for Standardization. ISO 8407: corrosion of metals and alloys - removal of corrosion products from corrosion test specimens. Geneva: ISO; 2021.
- 19 ISO: International Organization for Standardization. ISO 9226: corrosion of metals and alloys — corrosivity of atmospheres — determination of corrosion rate of standard specimens for the evaluation of corrosivity. Geneva: ISO; 2012.
- 20 ISO: International Organization for Standardization. ISO 9227: corrosion tests in artificial atmospheres — salt spray tests. Geneva: ISO; 2012.
- 21 ISO: International Organization for Standardization. ISO 6988: metallic and other non- organic coatings — sulphur dioxide test with general condensation of moisture. Geneva: ISO; 1985.
-
22 Lebozec N, Thierry D, Le Calvé P, Favennec C, Pautasso J-P, Hubert C. Performance of marine and offshore paint systems : correlation of accelerated corrosion tests and field exposure on operating ships. Mater. Corros. 2015;66(3):215-25. http://doi.org/10.1002/maco.201307340
» http://doi.org/10.1002/maco.201307340 - 23 ASTM: American Society for Testing and Materials. ASTM G5-14: standard reference test method for making potentiodynamic anodic polarization measurements. West Conshohocken: ASTM; 2021.
- 24 ASTM: American Society for Testing and Materials. ASTM G59-97: standard test method for conducting potentiodynamic polarization resistance measurements. West Conshohocken: ASTM; 2020.
- 25 ASTM: American Society for Testing and Materials. ASTM G102-89 e1: standard practice for calculation of corrosion rates and related information from electrochemical measurements. West Conshohocken: ASTM; 2015.
- 26 ISO: International Organization for Standardization. ISO 12944-2: paints and varnishes — corrosion protection of steel structures by protective paint systems. part 2: classification of environments. Geneva: ISO; 2021.
-
27 Mahato N, Singh MM. Investigation of passive film properties and pitting resistance of AISI 316 in aqueous ethanoic acid containing chloride ions using electrochemical impedance spectroscopy (EIS). Port Electrochem Acta. 2011;29(4):233-51. http://doi.org/10.4152/pea.201104233
» http://doi.org/10.4152/pea.201104233 -
28 Visa A, Plesu N, Maranescu B, Ilia G, Borota A, Crisan L. Combined experimental and theoretical insights into the corrosion inhibition activity on carbon steel iron of phosphonic acids. Molecules. 2021;26(1):135. http://doi.org/10.3390/molecules26010135
» http://doi.org/10.3390/molecules26010135 -
29 Tu R, Min R, Yang M, Yuan Y, Zheng L, Li Q, et al. Overcoming the dilemma between low electrical resistance and high corrosion resistance using a Ta/(Ta,Ti)N/TiN/Ti multilayer for proton exchange membrane fuel cells. Coatings. 2022;12(5):689. http://doi.org/10.3390/coatings12050689
» http://doi.org/10.3390/coatings12050689 - 30 ASTM: American Society for Testing and Materials. ASTM G1-90 (1999)e1: standard practice for preparing, cleaning, and evaluating corrosion test specimens. West Conshohocken: ASTM; 2017.
-
31 Ceará. IPECE: Instituto de Pesquisa e Estratégia Econômica do Ceará. Perfil básico municipal 2012 Tianguá [Internet]. Fortaleza: IPECE; 2012 [cited 2025 Set 22]. Available from: https://www.ipece.ce.gov.br/wp-content/uploads/sites/45/2013/01/Tiangua.pdf
» https://www.ipece.ce.gov.br/wp-content/uploads/sites/45/2013/01/Tiangua.pdf


