Investigation and Multi-Response Optimization of Friction Stir Welding Process Parameters for Stir Cast AA6092/SiC Composite
Abstract
Aluminium Metal Matrix Composites (AMMCs) reinforced with a particulate form of reinforcement have emerged as a replacement for monolithic alloys in various engineering industries due to their superior mechanical properties and customizable thermal and electrical characteristics. Silicon Carbide (SiC), is renowned for its high-temperature strength, hardness, wear resistance, excellent oxidation resistance, chemical resistance, low thermal expansion, high thermal conductivity, and compatibility with aluminium alloy find extensive utilization in Shipbuilding industries. The necessity for joining AMMCs arises in numerous engineering applications. Friction Stir Welding (FSW) emerges as one of the most fitting welding processes for joining AMMCs reinforced with particulate forms of ceramics without compromising their superior mechanical properties. This study endeavours to establish regression models predicting the Ultimate Tensile Strength (UTS), Percent Elongation (PE), and Weld Nugget Hardness (WNH) of friction stir welded AA6092 matrix composite reinforced with Silicon Carbide particles (SiC). The models correlate significant parameters such as tool rotational speed (TRS), welding speed (WS), axial force (AF), and percentage of SiC reinforcement in the AA6092 metal matrix. Statistical software Design Expert, along with analysis of variance (ANOVA) and student’s t-test, is employed to validate the developed models. It is observed from the investigation that these factors independently influence the UTS, PE, and WNH of the friction stir welded composite joints. The developed regression models are optimized to maximize the UTS and WNH of friction stir welded AA6092/SiC composite joints.
Keywords:
Friction stir welding; Aluminium alloy AA6092; Silicon carbide; Hardness; Ultimate tensile strength; Response surface methodology
1. Introduction
Aluminium plays a pivotal role in the automotive and aerospace industries, serving as a primary material for various components. In aviation, critical elements such as body frames, cushions, and fuselages are crafted from diverse aluminium grades. Currently, AA6082 is the industry standard for constructing body frames. While possessing desirable traits like machinability and formability, conventional fusion welding of aluminium alloys presents challenges1,2. This process results in numerous defects within the weld zone, including reduced strength3, porosity4, hot cracking5,6, brittle solidification7, a broad heat-affected zone, and discontinuities8. Solid-state welding techniques offer an alternative for materials that prove challenging to fusion-weld9, owing to their comparatively lower welding temperatures.
Friction stir welding (FSW) stands as a solid-state joining technique (low heat input) that forges a bond between two adjoining workpieces without inducing their material to a molten state. The heat, a by-product of the friction between the rotating tool and the workpiece material, creates a softened zone near the FSW tool, facilitating mechanical intermixing of the two metal workpieces at the joint site through applied pressure. In FSW, a non-consumable cylindrical tool, featuring a shoulder and a profiled pin extending from it, is inserted into the abutting edges of the plates to be joined until a substantial part of the shoulder makes intimate contact with the workpiece surface. Following this, the tool moves across the joint while rotating, generating sufficient heat to locally plasticize and move the material to the rear before solidifying it. FSW finds extensive application in materials such as aluminium and its alloys, copper, magnesium, composite materials, polymers, and specific ferrous materials, offering advantages over conventional welding methods. Notably, the stir zone often exhibits a distinctive "onion-ring" structure with concentric rings.
The thermo-mechanically affected zone (TMAZ) flanks either side of the stir zone, where strain and temperature are lower, resulting in a smaller impact on the microstructure compared to the stir zone. While technically referring to the entire deformed region, the term TMAZ is commonly used to describe any area not covered by the terms stir zone and flow arm. The heat-affected zone (HAZ), a common aspect of all welding processes, undergoes a thermal cycle without deformation during welding. Although temperatures are lower than those in the TMAZ, the microstructure may be significantly affected if thermally unstable. In age-hardened aluminium alloys, this region often displays the least favourable mechanical properties.
The automotive industry predominantly utilizes AA6092 aluminium alloy, known for its elevated strength when contrasted with the AA6082 aluminium alloy. Limited research exists on the friction stir welding (FSW) of AA6092 composites, with only a few studies documented in the literature. Vijayan and Seshagiri Rao10. developed a regression model for FSW of AA 2024 and AA 6061 at a 95% confidence level for desired FSW process parameters like TRS, WS, AF by varying the pin shapes. Finally, they concluded that highest UTS (141 MPa) was obtained at TRS of 1700 rpm, WS of 60 mm/min, AF of 6 kN having square shaped pin profile.
Vijayan et al.11. conducted the designed experiments of FSW on AA5083 and optimized the FSW process parameters using grey relation analysis. They concluded that the highest UTS was obtained at the optimal levels of TRS of 650 rpm, WS of 115 mm/min and AF of 9 kN. Ahmadnia et al.12 established the RSM based on central composite design for optimization of FSW parameters like TRS, WS, and plunging depth to develop mathematical regression models to predict mechanical properties like UTS, micro-hardness, and elongation for AA6061 with AA5010 dissimilar joint. They reported that the maximum UTS (174 MPa) and micro-hardness (106 HV) was obtained at the TRS of 800 rpm, WS of 60 mm/min, and plunge depth of 0.2 mm.
Farzadi et al.13 employed the RSM based central composite design to optimize FSW operative parameters like TRS, WS, the shoulder diameter, and the pin diameter during FSW of AA7075. They reported that the maximum joint strength (513 MPa) and maximum joint efficiency (94%) were obtained at the TRS of 513 rpm, the WS of 95 mm/min, the shoulder diameter of 16.1 mm and pin diameter of 5 mm. Shamsudeen and Dhas14 discussed the multi-objective optimization using RSM and GRA for the friction stir welded AA 5052-H32 aluminium alloy for measurement of UTS and hardness of the joint. They concluded that maximum UTS and hardness were obtained at TRS of 600 rpm, WS of 60 mm/min, Tool tilt angle of 1.9º with tapered square pin profile.
Acharya et al.15 investigated the impact of TRS on particle distribution in nugget zone (NZ) for the FSW of AA6092/17.5 SiCp-T6 composite at a constant tool tilt angle of 2° and tool traverse speed of 1 mm/sec by varying the TRS at 1000 rpm, 1500 rpm and 2000 rpm with a taper pin profiled tool. They concluded that the sample welded at TRS of 1500 rpm keeping the TS and TTA fixed at 1 mm/s and 2° showed better result. Salih et al.16 discussed the FSW of AA6092/SiC/17.5p-T6 AMC to understand the effects on the metallurgical and mechanical properties of aluminium matrix composite (AMC) with varying TRS and WS. They reported that the maximum UTS and the joint efficiency (75%) of the welded joints were obtained at a TRS of 1500 rpm and WS of 100 mm/min.
In recent years, significant momentum has been observed in the study of Friction Stir Welding (FSW) of Aluminium Metal Matrix Composites (AMMCs). The literature currently lacks comprehensive research on the Friction Stir Welding (FSW) of AA6092/SiC composites. Furthermore, crucial aspects of joint performance, such as Hardness (WNH), Ultimate tensile strength (UTS) and Percent Elongation (PE), remain understudied. In this study, attempt is made to join the AA6092/SiC composite using the FSW process. To minimize the number of experimental runs, a four-factor, five-level central composite rotatable design matrix was employed for experimentation. Three regression models were formulated to establish relationships between significant parameters—tool rotational speed (TRS), welding speed (WS), axial force (AF), and percentage of reinforcement and the Ultimate Tensile Strength (UTS), Percent Elongation (PE) and Hardness (WNH) of the friction stir welded AA6092/SiC composite. Subsequently, the developed regression models underwent optimization using the generalized reduced gradient method to achieve maximum UTS under three distinct conditions: (i) maximizing the UTS, (ii) maximizing the UTS at higher welding speed, and (iii) maximizing both the UTS, PE and WNH at higher welding speed.
2. Scheme of Investigation
2.1. Fabrication of AA6092/SiC composite
The AA6092/SiC composite was fabricated using the stir casting technique. An indigenously developed modified electric stir casting furnace equipped with bottom pouring arrangement was utilized for composite fabrication. Cleaned extruded AA6092 rods with a diameter of 25 mm were loaded into a coated stainless-steel crucible, and the electric furnace temperature was set to 1000 °C17,18. The chemical composition of the AA6092 alloy is outlined in Table 1. Stirring of the melt was facilitated by a coated stainless-steel stirrer coupled with an electric motor to ensure both the incorporation and uniform distribution of SiC reinforcement in the molten AA6092 alloy. To prevent contamination at elevated temperatures, both the crucible and stirrer were coated. A predetermined quantity of preheated SiC, sized 3–4 µm, was added into the melt at the vortex's side.
To enhance the wettability of the SiC reinforcement with the AA6092 alloy matrix, magnesium comprising 2 wt.% of the total weight of the composite to be produced was introduced into the melt. SiC were incorporated into the melt for 260 s. The mixture of molten aluminium and SiC was further stirred for 1200 s and then poured into a preheated permanent mould measuring 100 mm × 50 mm × 50 mm through the bottom pouring arrangement. Argon gas was continuously supplied at a constant flow rate of 2 lpm into the furnace once its temperature reached 650 °C until the molten composite was poured into the permanent mould. Similarly, various AA6092/ SiC composites containing 0–20 wt.% of SiC were fabricated. Plates measuring 100 mm × 50 mm × 5 mm (presented in Figure 1) were cut from the composite block to conduct FSW trial runs, determine the range of process parameters, and carry out FSW of composites as per the design matrix. Figure 2(a) depicts the SEM analysis of stir cast AA6092 matrix alloy. Figure 2(b-e) shows the SEM analysis of AA6092/SiC composites for samples 2 to 7. The SEM analysis clearly shows that the SiC particles are uniformly distributed. Rather than being located in the inter-dendritic zones, the SiC particles become embedded within the primary aluminum dendrites.
SEM analysis of AA6092 alloy and AA6092/SiC composites:(a) Sample 1 (Casted AA6092), (b) Sample 2 (95% AA6092/5% SiC), (c) Sample3 (90% AA6092/10% SiC, (d) Sample 4 (85% AA6092/15% SiC), (e) Sample 5 (80% AA6092/20% SiC).
2.2. Process parameters identification
The literature review revealed that the mechanical properties of friction stir welded AMMC joints are primarily influenced by several key process parameters, including tool rotational speed (TRS), welding speed (WS), axial force (AF), tool pin profile, and the percentage of reinforcement of ceramic particles in the composites. Given that a cylindrical profile tool pin exhibited superior joint strength, it was determined that FSW tool pins of cylindrical profile without draft should be fabricated from tool steel H13 material. The chemical composition of this tool steel H13 is represented in Table 2. These cylindrical pin profile of size 5 mm with length of 4.8 mm and 15 mm shoulder diameter with the length of 12 mm were fabricated using Computerized Numerically Controlled (CNC) turning centres and Electrical Discharge Machines (EDM), and subsequently oil hardened to achieve a hardness of 60–62 HRC. The geometry and dimensions of the tool are depicted in Figure 3.
2.3. Limits of FSW process parameters identification
Numerous trial experiments were conducted on AA6092/SiC composites to establish the working range of FSW process parameters selected for this study, including tool rotational speed (TRS), welding speed (WS), and downward axial force (AF). The feasible limits of these process parameters were determined to ensure that the friction stir welded joints remained free from macro-level defects such as tunnel defects, pinholes, and cracks. The feasible range of process parameters for achieving defect-free welds of AMCs is inherently narrower than that of unreinforced monolithic alloys due to the reduced ductility of AMCs resulting from the presence of ceramic particles19. Furthermore, considering the lower ductility of cast AMCs, the feasible range of FSW parameters becomes even narrower. Each parameter's upper limit is coded as +2 and the lower limit as -2, with coded values for intermediate ranges calculated using Equation 120-22.
where Yi is the essential coded value of a variable Y; Y is any value of the variable between Ymax and Ymin; Ymax is the upper limit of the variable; Ymin is the lower limit of the variable. The selected levels of the process parameters with their notations and units are depicted in Table 3.
2.4. Organizing an experimental design matrix
The experimental design matrix chosen for this study is a four-factor, five-level central composite design, consisting of 31 sets of coded conditions as illustrated in Table 4. The initial 16 experimental runs are derived from a full factorial experimental design matrix (24 = 16). Subsequently, the next 8 experimental runs involve a combination of each process variable at either its lowest (-2) or highest (+2) level, with the other three variables set at the intermediate level (0), forming the star points. The remaining 7 experimental runs feature all variables set at the intermediate level (0), representing the 7 centre points.
2.5. Conducting the experiments as per the design matrix
The experiments were conducted by following the design matrix (Table 4) using a square butt joint configuration sized 100 mm × 100 mm × 5 mm, employing a single pass butt welding procedure. Prior to welding, surface oxides on the plates were eliminated through wire brushing. The welding direction was parallel to the rolling direction of the plate. Thirty-one weld runs were executed randomly from the design matrix to mitigate the influence of unknown nuisance variables on the results. A semi-automatic FSW machine was utilized for this study. To execute FSW according to the test runs specified in the design matrix provided in Table 4, the tool rotational speed and welding speed were adjusted as per the test run, and the tool pin was inserted into the abutting surface of plates to be welded until the bottom of the tool shoulder made contact with the plates. The corresponding axial force specified in the test run was set in the FSW machine, exerting pressure on the plates through the shoulder for the various test runs. Following a brief dwell period, the FSW machine table was moved at a constant speed as required by the design matrix. The axial force was maintained until the end of each respective run. A dwell period is necessary to generate sufficient frictional heat to bring the material to a plastic state. Similarly, all remaining welding runs were conducted in accordance with the design matrix.
2.6. Recording the response parameters
Three tensile specimens were crafted from each of the thirty-one welded plates by cutting them perpendicular to the welding direction to the specified dimensions following ASTM E8M-04 standards. Utilizing a Computerized Universal Testing Machine (Make: Associated Scientific Engg. Works, Model: F-100 and Capacity: Max 5 Ton), the Ultimate Tensile Strength (UTS) and Percentage Elongation (PE) of the specimens were determined at room temperature. The average UTS and PE values of friction stir welded composite joints and the base composite are detailed in Tables 4 and 5, respectively. The joint efficiency of welded composite was computed using Equation 223-26, and the joint efficiency of all thirty-one welded joints is provided in Table 4.
Weld nugget hardness testing was conducted using a Rockwell Hardness Tester (Wilson Wolpert, Germany). Test specimens were prepared following ASTM E10-08 standards. Hardness measurements were taken at three locations: one in the weld nugget zone (WNZ) and two in the heat-affected zone (HAZ). Metallographic samples were prepared from the transverse section of the welded plate and exposed to a color etchant solution made from 4 g of KMnO4 and 1 g of NaOH dissolved in 100 ml of distilled water. The metallurgical structures of the samples were analysed using an optical metallurgical microscope (De-Wintour Inverted Trinocular Metallurgical Microscope) and a scanning electron microscope (FEI SEM-Apreo Model).
3. Developing Empirical Relationships
The response variables (UTS, PE and WNH) of the FSW of AA6092 composites are the functions of Tool rotational speed (TRS), Welding speed (WS), and Axial force (AF) and % of SiC (W). The surface can be expressed as given in equation (3), (4) and (5) respectively23-26.
The second-order polynomial (regression) Equation 623-26 employed to denote the response surface is expressed by
Second-order polynomial regression is employed to denote the ‘X’ response surface. Where a0 is the average response; ai, aii and aij are coefficients reliant on the major and interaction influences of the parameters; and ε is the statistical error. The coefficients were computed using Design Expert software and subjected to significance testing at a 95% confidence level. Insignificant coefficients on the response were eliminated without compromising the accuracy of the regression model, thus streamlining the mathematical process. Below is the finalized regression model for predicting the Ultimate Tensile Strength (UTS), Percentage Elongation (PE) and Weld Nugget Hardness (WNH) of friction stir welded joints, presented in coded form, with significant control parameters. The final regression relations to compute the UTS, PE and WNH of FS welded joint for AA6092 composite are summarized as in Equations 7, 8 and 923-26 respectively. Table 6, 7 and 8 show ANOVA results for Ultimate Tensile Strength (UTS), Percentage Elongation (PE) and Weld Nugget Hardness (WNH).
4. The Impact of the FSW Process Parameters on the Responses (UTS, PE and WNH)
4.1. Ultimate tensile strength (UTS)
In this section, the impact of FSW process parameters on two response variables, namely Ultimate Tensile Strength (UTS), PE and WNH were analysed. Specifically, the interaction effects of two input process parameters on these output responses, while the third process parameter is maintained at an average level is examined.
For Ultimate Tensile Strength (UTS), the perturbation plot (Figure 4) illustrates the influence of FSW process parameters on UTS within an optimized design framework. The plot visually demonstrates how the response varies as each parameter deviates from common or reference points, while all other process parameters remain constant at their respective reference points. Notably, the plot highlights that TRS stands out as the most influential process parameter affecting UTS, followed by WS and AL, in descending order of significance. It is also clear from the plot that the Wt. % of SiC is the most dominating factor on UTS followed by TRS, AL and WS.
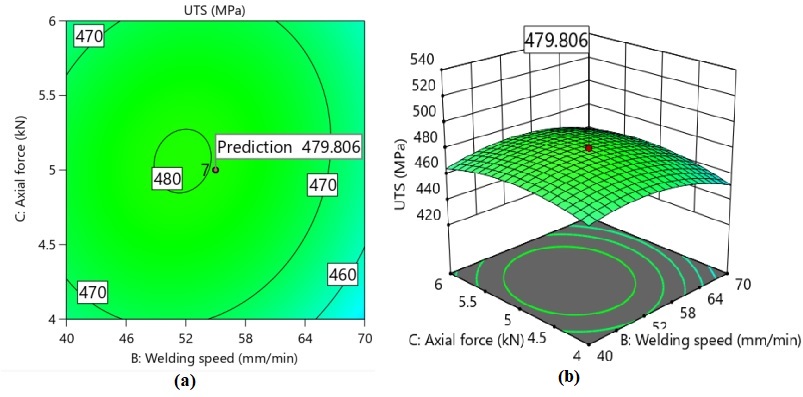
The interaction effects of TRS, WS, AF and W on UTS are depicted in Figures 5, 6, and 7. In Figures 5 (a) and (b), the impact of TRS and WS on UTS is illustrated while keeping AF, W constant at 5 kN and 10 Wt.%. The 2D contour plot in Figure 5(a) displays concentric circles representing tensile strength (in MPa), with the optimum value achieved at the centre of the plot. Specifically, the optimum UTS of 479.81 MPa (as shown in Figure 5(a) and (b)) is obtained at a TRS of 1200 rpm and a WS of 55 mm/min. Figure 6 illustrates the interaction effect of AF in conjunction with TRS while maintaining WS and W constant at 55 mm/min and 10 Wt.% respectively. The optimal UTS of approximately 479.81 MPa (as shown in both 2D and 3D plots) is achieved at a TRS of 1200 rpm and an AF of 5 kN.
Figure 7 depicts the interaction effect of W in combination with TRS while keeping AF and WS constant at 5 kN and 55 mm/min, respectively. The optimal UTS, approximately 479.81 MPa (as indicated in both 2D and 3D plots), is attained at a TRS of 1200 rpm and a W of 10 Wt.% of SiC. In Figure 8, the interaction effect of AF in conjunction with WS is illustrated while maintaining TRS and W constant at 1200 rpm and 10 Wt.%, respectively. The optimal UTS, approximately 479.81 MPa (as shown in both 2D and 3D plots), is achieved at a WS of 55 mm/min and an AF of 5 kN.
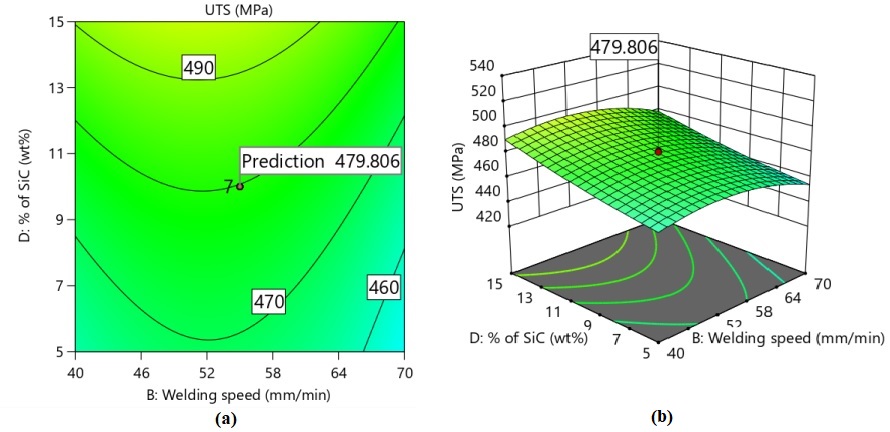
Figure 9 illustrates the interaction effect of W in conjunction with WS while keeping AF and TRS constant at 5 kN and 1200 rpm, respectively. The optimal UTS, approximately 479.81 MPa (as demonstrated in both 2D and 3D plots), is attained at a WS of 55 mm/min and a W of 10 Wt.% of SiC. In Figure 10, the interaction effect of W in conjunction with AF is depicted while maintaining TRS and WS constant at 1200 rpm and 55 mm/min, respectively. The optimal UTS, approximately 479.81 MPa (as indicated in both 2D and 3D plots), is achieved at a W of 10 Wt.% of SiC and an AF of 5 kN.
4.2. Weld nugget microhardness (WNH)
The microhardness of the base AA6092 alloy, measured at 147 HRB, is lower than that of the stir zone. Notably, the weld nugget consistently exhibits higher hardness levels compared to the base metal, regardless of the tool's rotational speed. This disparity in hardness can be attributed to two primary factors contributing to the enhancement of weld nugget hardness. Firstly, the grain size within the stir zone is significantly finer than that of the base metal. This refinement in grain size plays a pivotal role in strengthening the material, aligning with the principles outlined in the Hall-Petch equation, which establishes a direct correlation between decreasing grain size and increasing hardness. Secondly, the presence of minuscule intermetallic particles and uniformly dispersed SiCp within the weld nugget further augments its hardness, attributed to the mechanisms of Orowan hardening. The contrast in hardness between the heat-affected zone (HAZ) and the stir zone can be ascribed to the specific grain refinement process occurring within the stir zone. Figure 11 (perturbation plot) illustrates the influence of FSW process parameters on WNH for an optimized design. Notably, for every operational level of TRS, the weld nugget hardness remains consistently greater than that of the base metal. It is also clear from the plot that the Wt. % of SiC is the most dominating factor on WNH followed by TRS, AL and WS.
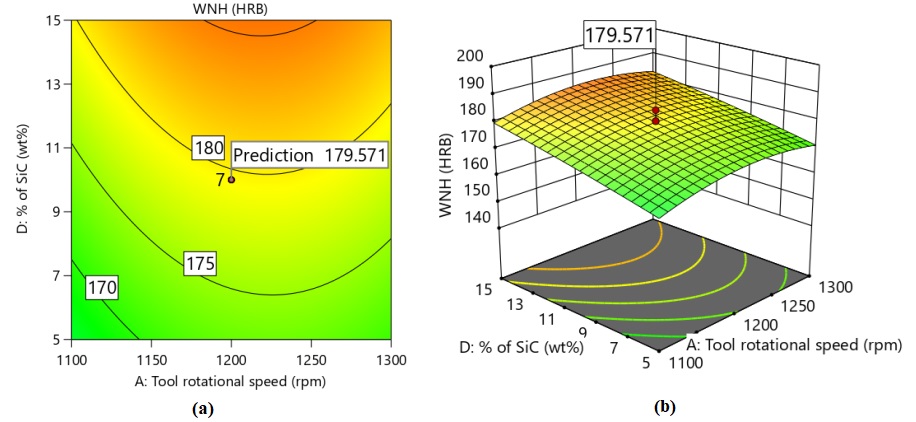
The interaction effects of Tool Rotation Speed (TRS), Welding Speed (WS), Applied Force (AF) and Wt.% of SiC on Weld Nugget Hardness (WNH) are depicted in Figures 12, 13, 14, 15, 16 and 17. In Figure 12 (a) and (b), the influence of TRS and WS on WNH is illustrated while keeping AF constant at 5 kN. The concentric circle in the 2D contour plot (Figure 12(a)) represents hardness (HRB), with the optimum value attained at the plot's center. The optimal WNH of 179.57 HRB (Figure 12 (a) and (b)) is achieved at a TRS of 1200 rpm and a WS of 55 mm/min. Figure 13 displays the interaction effect of AF and TRS at a constant WS of 55 mm/min and W of 10 Wt. % of SiC respectively. The optimal WNH of approximately 179.57 HRB (2D and 3D plots) is observed at a TRS of 1200 rpm and an AF of 5 kN. Figure 14 illustrates the interaction effect of W and WS at a constant TRS of 1200 rpm and AF of 5kN respectively. The optimal WNH value of 179.57 HRB (2D and 3D plots) is attained at a WS of 55 mm/min and W of 10 Wt. % of SiC.
Figure 15 represents the impact of W and AF on WNH of FSW Joint at a constant TRS of 1200 rpm and at a WS of 55 mm/min. The optimal WNH of approximately 179.57 HRB (2D and 3D plots) is observed at a W of 10 Wt. % of SiC and an AF of 5 kN. Figure 16 displays the impact of W and WS on WNH of FSW Joint at a constant TRS of 1200 rpm and an AF of 5 kN. The optimal WNH of approximately 179.57 HRB (2D and 3D plots) is observed at a WS of 55 mm/min and W of 10 Wt. % of SiC. Figure 17 displays the impact of W and AF on WNH of FSW Joint at a constant TRS of 1200 rpm and WS of 55 mm/min. The optimal WNH of approximately 179.57 HRB (2D and 3D plots) is observed at an AF of 5 kN and W of 10 Wt. % of SiC.
4.3. Percentage elongation
Figure 18 (perturbation plot) illustrates the influence of FSW process parameters on Percentage Elongation (PE) for an optimized design. Notably, for every operational level of TRS, the PE remains consistently greater than that of the base metal. The plot also clearly indicates that the weight percentage of SiC (W) is the most dominant factor affecting PE, followed by TRS, AL, and WS.
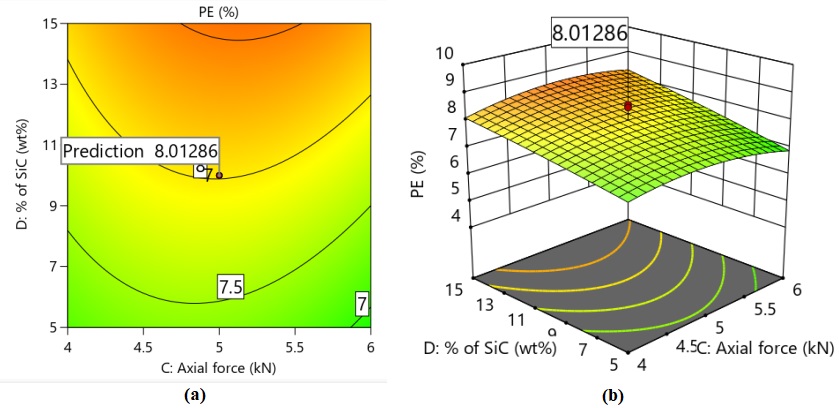
The interaction effects of Tool Rotation Speed (TRS), Welding Speed (WS), Applied Force (AF), and weight percentage of SiC (W) on Percentage Elongation (PE) are depicted in Figures 19, 20, 21, 22, 23, and 24. In Figures 20(a) and 20(b), the influence of TRS and WS on PE is illustrated while keeping AF and W constant at 5 kN and 10 wt.%, respectively. The concentric circle in the 2D contour plot (Figure 19(a)) represents PE (%), with the optimum value attained at the plot's centre. The optimal PE of 8.01% (Figures 19(a) and 19(b)) is achieved at a TRS of 1200 rpm and a WS of 55 mm/min. Figure 20 presents the interaction effect of AF and TRS at a constant WS of 55 mm/min and W of 10 wt.% SiC. The optimal PE of approximately 8.01% (2D and 3D plots) is observed at a TRS of 1200 rpm and an AF of 5 kN. Figure 21 illustrates the interaction effect of W and WS at a constant TRS of 1200 rpm and AF of 5 kN. The optimal PE value of 8.01% (2D and 3D plots) is attained at a WS of 55 mm/min and W of 10 wt.% SiC.
Figure 22 represents the impact of W and AF on the Percentage Elongation (PE) of the FSW joint at a constant TRS of 1200 rpm and a WS of 55 mm/min. The optimal Percentage Elongation (PE) value of approximately 8.01% (2D and 3D plots) is observed at a W of 10 Wt.% SiC and an AF of 5 kN. Figure 23 displays the impact of W and WS on the PE of the FSW joint at a constant TRS of 1200 rpm and an AF of 5 kN. The optimal PE value of approximately 8.01% (2D and 3D plots) is observed at a WS of 55 mm/min and a W of 10 wt.% SiC. Figure 24 shows the impact of W and AF on the PE of the FSW joint at a constant TRS of 1200 rpm and a WS of 55 mm/min. The optimal PE value of approximately 8.01% (2D and 3D plots) is observed at an AF of 5 kN and a W of 10 wt.% SiC.
5. Results of Optimization
After conducting the optimization study to achieve the desired mechanical properties on the welded joint, the following optimum welding conditions were selected based on optimization criteria, as shown in Table 9. The results obtained from experiments and optimization indicate that the TRS should be around 1200 rpm to attain optimum Ultimate Tensile Strength (UTS), Percentage Elongation (PE) and Weld Nugget Hardness (WNH). These responses primarily depend on Wt.% SiC compared to other input parameters. The optimized FSW process parameters and responses predicted by the design expert software are presented in Table 10. Figure 25 shows the contour plot and overlay plot, which predict the optimum UTS of 479.81 MPa, PE of 8.01% and WNH of 179.57 HRB. These optimum values are obtained at the welding conditions of a TRS of 1200 rpm, WS of 55 mm/min, and an AF of 5 kN.
5.1. Validation for the developed model
The empirical or mathematical model established by the desirability approach was compared with experimental results, and the errors were calculated for all Thirty-One runs (Table 4). The experimental values were obtained by conducting the experiments, and the predicted values were determined from the empirical equations developed by the design expert software. Table 11 shows the experimental values, predicted values, and percentage errors for UTS, PE and weld nugget hardness. For UTS, the percentage error ranges from -2.49 to + 2.30, for PE the percentage error ranges from -9.12 to +8.38, and for WNH, the percentage error ranges from -3.14 to + 4.10. These results indicate that the newly developed model accurately predicts UTS, PE and WNH values, as the predicted values are almost equal to the experimental values.
The validation experiment results are presented in Table 12. To validate the model's accuracy under predicted optimal welding conditions, three confirmation experiments were conducted. These experiments utilized a Tool Rotation Speed (TRS) of 1200 rpm, Welding Speed (WS) of 55 mm/min, and Applied Force (AF) of 5 kN. The maximum percentage errors for the prediction of optimum Ultimate Tensile Strength (UTS) Percentage Elongation (PE) and Weld Nugget Hardness (WNH) are + 0.25%, + 1.23% and + 0.24%, respectively.
5.2. Microstructural characterization
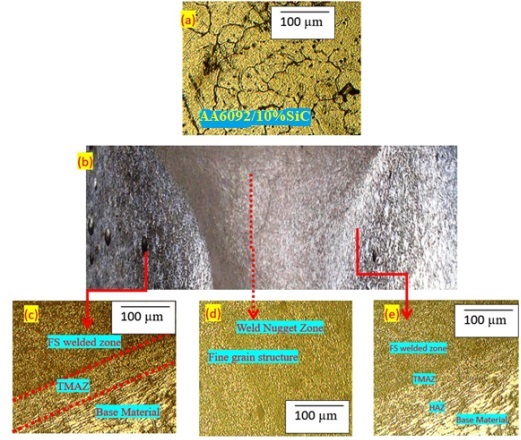
Figure 26(a) shows the coarse grains present in the base AA6092/SiC Composite, along with the dendritic structure resulting from the stir casting technique. In contrast, Figure 26(b) provides a macrostructural analysis of the friction stir (FS) welded joint. The cross-weld microstructure of FS welded AA6092/SiC joints, as depicted in Figures 26(b-d), reveals four distinct zones: the weld nugget zone (WNZ), the thermo-mechanically affected zone (TMAZ), the heat-affected zone (HAZ), and the unaffected zone (base material). This analysis also highlights the absence of micron-level defects, which is attributed to adequate heat generation and proper plastic flow during the welding process. Notably, the grains in the FS welded material are significantly finer compared to those in the base AA6092/SiC Composite. The microstructure and grain size vary substantially across the WNZ, TMAZ, and HAZ due to the different heating and cooling conditions during the friction stir welding (FSW) process. Specifically, the WNZ exhibits finer grains compared to the TMAZ, HAZ, and unaffected zone. Additionally, the photomicrographs reveal fine recrystallized structures within the WNZ. The coarse grain structure observed in the base AA6092/SiC Composite (Figure 26(a)) transforms into a finer grain structure due to the mechanical stirring action of the FSW tool, as shown in Figure 26(d). This transformation in grain structure is a direct result of the FSW technique's effect on the microstructure of the welded material.
(a) Microstructural analysis of AA6092/10% SiC, (b) Macrostructural analysis of FS welded Composite and (c-e) Microstructural analysis of FS welded Composite.
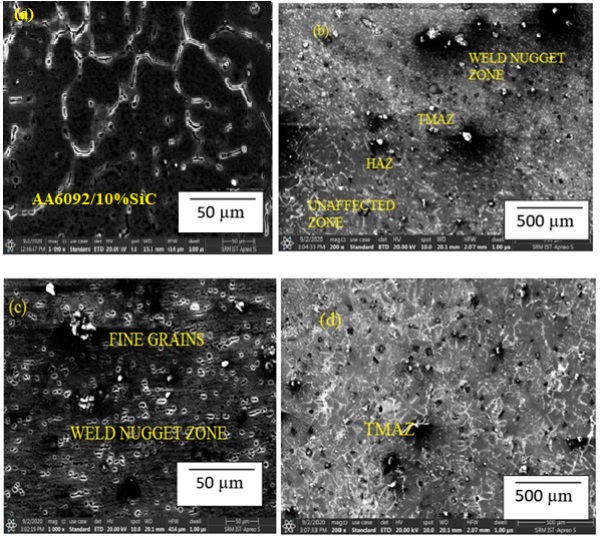
Figures 27(a-d) display SEM micrographs of both the base AA6092/SiC Composite and the FS welded alloy. Figure 27(a) depicts the grain size in the AA6092/SiC Composite, while Figure 27(b) provides a clear view of the four distinct zones (TMAZ, WNZ, HAZ, and unaffected zone) within the FS welded composite. Figures 27(c-d) provide evidence that the WNZ exhibits a finer grain structure compared to the TMAZ, HAZ, and unaffected zone. These micrographs highlight the fine grain structure resulting from the stirring action of the non-consumable rotating tool, which creates both high plastic deformation and high temperatures. This process induces dynamic recrystallization of grains, enhancing the ultimate tensile strength (UTS) of the FS welded joints while resulting in lower ductility. The fine grain structures act as barriers to dendritic growth at the grain boundaries, improving the UTS and microhardness of the base AA6092/SiC Composite. Additionally, the micrographs illustrate the accumulation and growth of clusters, which significantly contribute to the overall strength of the AA6092/SiC Composites.
6. Conclusions
In this recent work, experiments were conducted involving various critical process parameters, namely Tool Rotation Speed (TRS), Welding Speed (WS), Axial Force (AF), and Wt. % of SiC through multiple trials. Additionally, the FSW process parameters were optimized for the AA6092 composites, leading to the following key findings:
Regression models were developed by using central composite design of Response Surface Methodology (RSM) to predict the Ultimate Tensile Strength (UTS) and Percentage Elongation (PE) and Weld nugget Hardness (WNH) of friction stir welded AA6092/SiC composite joints.
The developed regression models were found to be more accurate and conformity tests were conducted to validate that regression models.
The perturbation plots as well as 2D and 3D contour plots were analyzed to assess the interaction effects of the welding parameters using Design Expert software.
The optimal Ultimate Tensile Strength (UTS), Percentage Elongation (PE) and Weld Nugget Hardness (WNH) values rues were achieved under the following welding conditions: a Tool Rotation Speed (TRS) of 1200 rpm, a Welding Speed (WS) of 55 mm/min, a 10 Wt. % of SiC and an Axial Force (AF) of 5 kN.
The maximum percentage errors for the prediction of optimum Ultimate Tensile Strength (UTS), Percentage Elongation (PE), and Weld Nugget Hardness (WNH) are +0.25%, +1.23%, and +0.24%, respectively.
7. References
References
-
1 Rajakumar S, Muralidharan C, Balasubramanian V. Optimization of the friction-stir-welding process and tool parameters to attain a maximum tensile strength of AA7075–T6 aluminum alloy. Proc Inst Mech Eng, B J Eng Manuf. 2010;224:1175-91. http://doi.org/10.1243/09544054JEM1802
» http://doi.org/10.1243/09544054JEM1802 -
2 Mishra RS, Ma ZY. Friction stir welding and processing. Mater Sci Eng Rep. 2005;50:1-78. http://doi.org/10.1016/j.mser.2005.07.001
» http://doi.org/10.1016/j.mser.2005.07.001 - 3 Taban E, Kaluc E. Microstructural and mechanical properties of double-sided MIG, TIG and friction stir welded 5083-H321 aluminum alloy. Kovove Mater. 2006;44:25-33.
-
4 Sharma C, Dwivedi DK, Kumar P. Effect of welding parameters on microstructure and mechanical properties of friction stir welded joints of AA7039 aluminum alloy. Mater Des. 2012;36:379-90. http://doi.org/10.1016/j.matdes.2011.10.054
» http://doi.org/10.1016/j.matdes.2011.10.054 -
5 Abbass MK, Ameen HA, Hassan KS. Effect of heat treatment on corrosion resistance of friction stir welded AA 2024 aluminum alloy. Am J Sci Ind Res. 2011;2:297-306. http://doi.org/10.5251/ajsir.2011.2.2.297.306
» http://doi.org/10.5251/ajsir.2011.2.2.297.306 -
6 Lakshminarayanan AK, Balasubramanian V, Elangovan K. Effect of welding processes on tensile properties of AA6061 aluminum alloy joints. Int J Adv Manuf Technol. 2009;40:286-96. http://doi.org/10.1007/s00170-007-1325-0
» http://doi.org/10.1007/s00170-007-1325-0 -
7 Sayer S, Yeni C, Ertugrul O. Comparison of mechanical and microstructural behaviors of tungsten inert gas welded and friction stir welded dissimilar aluminum alloys AA 2014 and AA 5083. Kovove Mater. 2011;49:155-62. http://doi.org/10.4149/km_2011_2_155
» http://doi.org/10.4149/km_2011_2_155 -
8 Fratini L, Buffa G, Filice L, Gagliardi F. Friction stir welding of AA6082-T6 T-joints: process engineering and performance measurement. Proce IME B J Eng Manuf. 2006;220(5):669-676. http://doi.org/10.1243/09544054JEM327
» http://doi.org/10.1243/09544054JEM327 -
9 Scialpi A, Filippis LAC, Cavaliere P. Influence of shoulder geometry on microstructure and mechanical properties of friction stir welded 6082 aluminum alloy. Mater Des. 2007;28:1124-9. http://doi.org/1016/j.matdes.2006.01.031
» http://doi.org/1016/j.matdes.2006.01.031 -
10 Vijayan D, Seshagiri Rao V. A parametric optimization of FSW process using RSM based grey relational analysis approach. Int Rev Mech Eng. 2007;8:328-37. http://doi.org/10.1007/s40032-014-0116-2
» http://doi.org/10.1007/s40032-014-0116-2 -
11 Vijayan S, Raju R, Rao SRK. Mult objective optimization of friction stir welding process parameters on aluminum alloy AA 5083 using taguchi-based grey relation analysis. Mater Manuf Process. 2010;25:1206-12. http://doi.org/10.1080/10426910903536782
» http://doi.org/10.1080/10426910903536782 -
12 Ahmadnia M, Shahraki S, Kamarposhti MA. Experimental studies on optimized mechanical properties while dissimilar joining AA6061 and AA5010 in a friction stir welding process. Int J Adv Manuf Technol. 2016;87:2337-52. http://doi.org/10.1007/s00170-016-8636-y
» http://doi.org/10.1007/s00170-016-8636-y -
13 Farzadi A, Bahmani M, Haghshenas DF. Optimization of operational parameters in friction stir welding of AA7075-T6 Aluminum Alloy using response surface method. Arab J Sci Eng. 2017;42:4905-16. http://doi.org/10.1007/s13369-017-2741-6
» http://doi.org/10.1007/s13369-017-2741-6 -
14 Shamsudeena S, Dhas J. Optimization of multiple performance characteristics of friction stir welded joint with grey relational analysis. Mater Res. 2018;21:1-15. http://doi.org/10.1590/1980-5373-MR-2017-1050
» http://doi.org/10.1590/1980-5373-MR-2017-1050 -
15 Acharya U, Roy BS, Saha SC. Effect of tool rotational speed on the particle distribution in friction stir welding of AA6092/17.5 SiCp-T6 composite plates and its consequences on the mechanical property of the joint. Defence Technology. 2020;16:381-91. http://doi.org/10.1016/j.dt.2019.08.017
» http://doi.org/10.1016/j.dt.2019.08.017 -
16 Salih OS, Ou H, Wei X, Sun W. Microstructure and mechanical properties of friction stir welded AA6092/SiC metal matrix composite. Mater Sci Eng A. 2019;742:78-88. http://doi.org/10.1016/j.msea.2018.10.116
» http://doi.org/10.1016/j.msea.2018.10.116 -
17 Kasman S. Multi-response optimization using the Taguchi-based grey relational analysis: a case study for dissimilar friction stir butt welding of AA6082-T6/AA5754-H111. Int J Adv Manuf Technol. 2013;68:795-804. http://doi.org/10.1007/s00170-012-4720-0
» http://doi.org/10.1007/s00170-012-4720-0 - 18 Prasanna P, Penchalayya Ch, Anandamohana Rao D. Optimization and validation of process parameters in friction stir welding on AA 6061 aluminum alloy using gray relational analysis. Int J Eng Res Appl. 2013;3:1471-81.
-
19 El-Zathry NE, Hassan AI, El-Betar AA, Sabry I. Optimization of friction stir welding AA6082-T6 parameters using analysis of variance and grey relational analysis. J Phys Conf Ser. 2022;2299:012015. http://doi.org/10.1088/1742-6596/2299/1/012015
» http://doi.org/10.1088/1742-6596/2299/1/012015 -
20 Kundu J, Singh H. Friction stir welding of AA5083 aluminium alloy: multi-response optimization using Taguchi-based grey relational analysis. Adv Mech Eng. 2016;8:1-10. http://doi.org/10.1177/1687814016679277
» http://doi.org/10.1177/1687814016679277 -
21 Ghetiya ND, Patel KM, Kavar AJ. Multi-objective optimization of FSW process parameters of aluminium alloy using taguchi-based grey relational analysis. Trans Indian Inst Met. 2016;69:917-23. http://doi.org/10.1007/s12666-015-0581-1
» http://doi.org/10.1007/s12666-015-0581-1 -
22 Feng AH, Xiao BL, Ma ZY. Effect of microstructural evolution on mechanical properties of friction stir welded AA2009/SiCp composite. Compos Sci Technol. 2008;68:2141-8. http://doi.org/10.1016/j.compscitech.2008.03.010
» http://doi.org/10.1016/j.compscitech.2008.03.010 - 23 Murugan N, Parmar RS. Effects of MIG process parameters on the geometry of the bead in the automatic surfacing of stainless steel. J Mater Process Technol. 1994;41:381-98.
-
24 Umar Mohamed J, Palaniappan PLK, Maran P, Pandiyarajan R. Investigation and optimization of friction stir welding process parameters of stir cast AA6082/ ZrO2 / B4C composites. Mater Sci Pol. 2020;38:715-30. http://doi.org/10.2478/msp-2020-0082
» http://doi.org/10.2478/msp-2020-0082 -
25 Umar Mohamed J, Palaniappan PLK, Maran P, Pandiyarajan R. Influences of ZrO2 and B4C reinforcement on metallurgical, mechanical, and tribological properties of AA6082 hybrid composite materials. J Ceram Process Res. 2021;22:306-16. http://doi.org/10.36410/jcpr.2021.22.3.306
» http://doi.org/10.36410/jcpr.2021.22.3.306 -
26 Umar Mohamed J, Palaniappan PLK, Maran P. Influence of post weld heat treatment on the tensile and microhardness characteristics of friction stir welded joints of AA6082/ZrO2/B4C composites. Mater Today Proc. 2022;56:902-9. http://doi.org/10.1016/j.matpr.2022.02.535
» http://doi.org/10.1016/j.matpr.2022.02.535