Enhanced Erosion Wear Performance of Talc Particulate–Filled Glass Fiber–Reinforced Nylon66 Composites: Experimental Analysis and Machine Learning Based Prediction
Abstract
In this study nylon 66 (N66), glass fiber–reinforced nylon 66 (GFN66), and talc particulate–filled glass fiber–reinforced nylon 66 (T-GFN66) hybrid composites were fabricated using compounding process and injection moulding technique. Test was performed by varying the input factors (impact velocity, impingement angle, and constitute of composite). Study intended to explore the combined effect of input factors on erosion wear rate (EWR) of the composites. Data-driven machine learning (ML) approach was applied to analyse and predict the EWR of the N66 and its hybrid composites. Experimental results showed that EWR increased with increase in impact velocity and decreased with an addition of glass fiber and talc filler contents. T-GFN66 composite exhibited superior erosion wear resistance than N66 and GFN66. Furthermore, experimental data were fed into the four ML models and compared using their performance metrics. It was observed that among all the developed ML models, gradient boosting machine (GBM) model found to be superior in predicting the erosion wear performance of N66 composite with R2 value of 0.9666. Eroded surface topography was analysed using 3D optical profilometer to establish the relationship between surface parameters and EWR. Worn morphology was conducted using field emission scanning electron microscopy (FESEM) to observe wear mechanisms endured by the N66 composites.
Keywords:
Nylon66 composites; Erosion wear rate; Machine learning models; Talc filler; Surface roughness
1. Introduction
Solid particle erosion is a dynamic process resulting in the progressive loss of material due to the action of continuous striking of solid particles on the work surface. This kind of erosion process eventually leads to the negative impact on the life span of the structure and may leads to catastrophic accidents as a consequence of surface degradation and continuous wear loss of the solid material. Moreover, such outcomes are responsible for the shutting down of various industries as loss of cost involved with that. For few decades now, polymers and their composites have been mainly used for making helicopter rotor blades, pump impeller blades, pipelines mainly intending to carry the sand slurries in petroleum refining, valves and seals in particulate flow systems, and conveyor components, where these aforementioned components are subjected to solid particle erosion. In such applications, these composite components more likely to encounter with unusual atmospheric conditions and hence it is need of the hour to understand the erosion wear behaviour of the polymer composites under varying test conditions.
Polymer composite exhibits inferior erosion resistance than metals and ceramic materials but still preferred because of their high strength to weight ratio and offer better resistance to corrosion. Non-reinforced polymer composites show better erosion resistance than polymer composites. Among the polymers based, thermoplastic composites are preferred over thermoset particularly for erosion prone applications thanks to their unique properties namely, higher toughness, low density, impact resistance, corrosion resistance, recyclability and ease of processing. Many researchers have investigated the solid particle erosion behaviour of the polymer composites and reported that fiber content, types of matrices, fabric content, fiber length, orientation of fibers, impact velocity, striking angle, mass flow rate of abrasive particle, shape of erodent, strongly influences erosion wear rate of the work material. Moreover, for producing the desired components matching the specific applications, it is very essential to understand the response of the composite material to any changes in parameters. Researchers have confirmed that reinforcement of fiber regardless of the shape had improved the erosion wear performance of the fiber reinforced polymer composites. Arjula et al.1 reported the effect of matrix material, impact velocity and impact angle on erosion wear behaviour of several thermoplastics. Result showed that maximum erosion wear occurred at an impact angle 30° suggesting ductile wear behavior of the plastic material. Kar et al.2 studied the erosion wear behaviour of the palm leaf stalk powder reinforced epoxy composites. Findings revealed that inclusion of bio-filler significantly reduced the erosion wear rate of the composites. Drensky et al.3 investigated the erosion wear charactertics of carbon reinforced PEEK composites. Overall erosion wear rate found increased with increase in the striking velocity. Moreover, material behaved quasi-ductile with peek erosion at an impingement angle 45°. Gupta et al.4 revealed that bamboo-epoxy composite exhibited semi-brittle wear behavior where peak of erosion occurred between 60° to 75° impingement angle. Mahapatra et al.5 implemented Taguchi technique to arrive the optimal parametric combination for minimizing the erosion wear rate in glass fiber reinforced polyester composites. However, in contradiction to the previous findings, Suresh et al.6 reported that impact velocity significantly affected the erosion wear rate of the short glass fiber reinforced polyetherketone (PEK) composites and found that erosion rate property deteriorated due to presence of higher fiber content. Mostly these PEK composites exhibited ductility property. Similarly, impact velocity factor significantly affected the erosion wear behaviour of the ramie reinforced epoxy composites7. Investigations also confirmed that addition of secondary reinforcement greatly enhances the erosion wear rate of the hybrid composites. Researchers have revealed the usefulness of reinforcing the organic and inorganic fillers in reducing the erosion wear of the composites by modifying the wear mechanisms. Biswas et al.8 reported the erosion behaviour of the TiO2 filled glass/epoxy composites. Jena et al.9 studied bamboo/epoxy composites with cenosphere filler and they highlighted that filler addition improves the wear resistance of the hybrid composite. Das and Biswas10 investigated the erosive wear behavior of the Al2O3 filled coir fiber reinforced epoxy composites. Findings revealed that alumina filler played a major role in enhancing the wear resistance of the hybrid composites. Erosion wear found increased with increase in impact velocity. Lower wear rate was observed at 48 m/s while higher wear rate at 109 m/s. Mohan et al.11 studied the impact of erosion wear parameters on the tungsten carbide powder filled glass fabric epoxy composites. Hybrid composite showed brittle wear and tungsten carbide found to be effective in reducing the wear resistance. Nayak et al.12 reported that waste marble dust powder found to be very useful in improving the erosion wear behavior of the polyester composites. Impact angle and velocity significantly contributed towards erosion wear characteristics of the composite apart from filler content. Worn morphology showed the ductile/brittle dominated wear mechanism. Gültürk et al.13 showed that calcined diatom frustules reinforced epoxy composite exhibited higher erosion loss at 30° oblique incidences. Moreover, addition of calcined diatom frustules filler significantly decreased the erosion resistance of the composites. Purohit and Satapathy14 showed addition of Linz-Donawitz Sludge (LDS) filler polypropylene composites significantly affected the erosion wear behavior of the composites. Impact velocity played major role in altering the wear mechanism of the composites.
Machine learning (ML) which is a subset of artificial intelligence mainly comprising set of algorithms that exclusively employed for the training data set to make predictions7,15. Machine learning methods are effectively employed in various fields like, bioengineering, chemistry, computer science, medical, manufacturing, pharmacy and etc. However, its usage in the area of material science is limited and needs to explore more so that accurate prediction of the output and comprehending of the complex correlation between the multiple variables will become easier. Tribology is one such area of material science where huge experimental data generated can be integrated using the ML models to comprehend the complex nature of multiple input variables7,16. Wear rate of the composite material depends on inherent characteristics of the material systems and tribological variables17. The influence of the input variables on the output response can be examined by performing the experiments which may not be reliable and often leads to higher cost and time consumption. Moreover, experimental data of erosion wear involves collective effect of input factors on the output (erosion wear rate) which is difficult to understand as it involves lot of computational analysis which may provide approximate results but not accurate18. Erosion wear is complex and involves non-linear relationship among the input and output data sets, which is difficult to analyze and predict the erosion wear rate of the material. Researcher have tried to develop the regression mathematical models using different statistical techniques to predict the erosion rate of the composites. However, those predictions are approximate and inaccurate solutions as wear study involves lot of computations. Therefore, to attain the accurate predication of the erosion rate of the composite different data driven machine learning models are employed. Training of ML models requires higher data, but some ML algorithms such as random forest (RF), support vector machines (SVM), k-nearest neighbor (KNN), gradient boosting machine (GBM), etc can be attain near accurate and effective predictions even with smaller data sets. Literature reports only limited research on the prediction of the erosion wear performance of composite systems using different machine learning (ML) models19-22. Thus, the present investigation attempts to explore the erosion wear behaviour of the talc filled glass reinforced nylon66 composites which has not been reported so far. Moreover, this study presents the effect of each input factor on the erosion wear rate (EWR) using different machine learning models namely RF, ETR, KNN, and GBM to comprehend complex multi-variables pattern and to effectively predict the EWR of the N66 composites.
2. Experimental Details
2.1. Materials used
Nylon66 pellets (Grand pacific petrochemical corporation, Taiwan), were used a matrix material. Short-glass fiber (SGF) used as primary reinforcement member and was procured from Nippon Electric Glass -Malaysia. Talc particles used a secondary reinforcement material for fabricating nylon-based hybrid composite. Talc fillers were supplied by 20 Microns limited (Tirunelveli, India). The micrograph of the talc filler is indicated in the Figure 1a.

2.2. Fabrication of the N66 composites
Nylon 66 pellets, short glass fibers and talc fillers were dried in the hot air oven at different temperature and time to get rid of the moisture. These constituents were weighed as per the required weight fraction and pre-mixed using mechanical grinder for achieving the uniform distribution. The mixture was then subjected to compounding process where it was melted in a twin-screw extrusion machine operated at different temperature like feeding zone operated at 80°C, following compression zone and metering zone at 270°C and 290° C, respectively as indicated in the Figure 2. During melt-compounding process, screw speed around 80-120 rpm to maintained to ensure the effective dispersion of the glass fiber and talc filler within N66. In the next stage, blended extrudate plastic was cooled in a water bath and subsequently pulled via mechanical puller thereby converting to granules form using mechanical cutter followed by drying those N66 based composite granules at 80°C for 4 to 6 hours. These N66 based composite granules were casted to required shape and size using injection moulding machine whose barrel temperature maintained during injection was in range 260-280°C. Fabricated N66, GFN66, and T-GFN66 hybrid composites specimens were finally conditioned at room temperature for 48 hours prior to erosion wear study. Details of the composition of the nylon66 based composites is shown in the Table 1.

2.3. Solid particle erosion wear test
Erosion wear test was performed using air jet erosion test rig which was in accordance with ASTM G76 standard and its schematic representation is shown in the Figure 3a. N66 composite samples were prepared to the dimension of 25 mm × 25 mm × 5 mm. Test was performed at a constant mass flow rate of erodent 3.3 g min-1 for different impact velocity (72, 100, and 129 m/s) and striking angles (30°, 45° and 60°). Stand-off distance of 10 mm was kept constant throughout the experiments. Alumina particles of size 20-30 µm used as an erodent. The micrographs of the erodent particles along with its elemental composition are shown in the Figure 1b. The erosion wear rate (EWR) was calculated by employing Equation (1)
where Δw and Δwe represents the moss loss of the N66 composite sample (in grams) and mass of the eroding particles, respectively. Δwe was further determined by including the testing time and feed rate of the solid particles. The erosion efficiency (η) of the eroded N66 composite samples was found using the following Equation (2).
where EWR represents erosion wear rate (g/g), Hr is the hardness of the eroding sample (Pa), ρ and v are the actual density of the N66 composite sample (kg/m3) and striking or impact velocity of the solid particles (m/s), respectively.

2.4. Machine learning (ML) models
Machine learning (ML) models were developed using Python mainly intended to predict the EWR of the N66 composites based experimental data fed. These ML models were trained to learn to correlation between input and output data sets, so that accurate prediction of the unseen data is done with ease. Prior to the development of ML models, input data set were pre-processed to eliminate inconsistencies. First step followed in pre-processing was data standardization and further dataset was bifurcated into training and testing data sets in a 75:25 ratio. In this study, four supervised-based ML models were developed namely, Random Forest (RF), K-Nearest Neighbors (KNN), Gradient Boosting Machine (GBM), and Extra Trees Regressor (ETR). RF and ETR uses ensemble decision tress to draw the non-linear relationships, while ETR utilizes higher randomness to enhance the generalization. KNN predicts output response based on proximity in feature space. GBM model shows highly accurate predictions by sequentially reducing residual errors from earlier learners.
2.4.1. Parameter optimization
Parametric optimization also termed as hyperparameter tuning, which is mainly employed to arrive the best settings for ML models so that it executes well on the data. Moreover, it mainly emphasizes on controlling the learning process like, tree depth and regularization strength. In this study, trail and error method using Python was adopted to arrive the best parametric combinations. The main moto is to balance model complexity and accuracy, averting of overfitting during learning and capturing data patterns. The optimized hyperparameter for EWR prediction using different ML model is shown in the Table 2.
2.4.2. Performance metrics of machine learning model
The predictive performance of the developed ML models was determined using statistical metrics23 such as coefficient of determination (R2), mean square error (MSE), root mean square error (RMSE), mean absolute error (MAE), and mean absolute percentage error (MAPE) and were evaluated using following Equations (3) to (7). Higher the R2 values and lower metrics values suggests the superior predicting ability of the developed ML models23.
Where, Ex and Pr are the experimental and predicted values respectively. Pm denotes the mean value of the experimental values. Z indicates the number of observations.
2.4.3. Surface examination method
Topographies of the eroded surface were analysed using 3D optical profilometer. Average surface roughness and wear depth of the composites were measured at the centre region of the specimen. Surface morphologies were examined using FESEM (Model: Sigma 360, Carl Zeiss, Germany).
3. Results and Discussion
3.1. Effect of Impingement angle on erosion wear rate of N66 composites
Erosion wear rate of the N66 based composite as a function of impingement angles for various impact velocities is shown in the Figures 4. EWR of N66 is found to be higher than other composites and decreases with increase in the impingement angle. N66 exhibits maximum EWR of 5.733×10⁻⁵ g/g at striking angle 30° clearly confirms that erosion wear of the neat nylon66 is ductile in nature. Addition of SGF and talc fillers into the N66 matrix have improved the EWR of the N66 composites. GFN66 and T-GFN66 composites showed better resistance to erosion wear than neat N66. Inclusion of SGF and talc filler reduces the ductility by increasing hardness thereby restricts plastic deformation and eventually reduces the material removal from the work surface. Particularly, T-GFN66 shows higher resistance to erosion wear may be attributed to the addition of talc filler which makes the nylon66 denser and smoother thereby offers resistance to the penetration of alumina erodent particles lowering the micro-cutting effect and so enhances EWR. Moreover, particle size distribution of talc filler influences the packing density and interfacial bonding within N66 matrix phase. Finer talc particles provide uniformly distributed within matrix and thereby strengthen interfacial adhesion which improves load transfer and reduced localized stress concentration during the impact of alumina particles. This leads to improved EWR of the T-GFN66 composites. Maximum EWR of GFN66 and T-GFN66 composites shifted from 30° to 45° impingement angle and any further increasing causes significant decreasing in EWR. This may be attributed to semi-ductile behaviour of the N66 composite. From the Figure 4 it is clearly evident N66 composites showed lower EWR at impact angle 60°. This trend remains same when impacted at various velocities (72 m/s, 100 m/s, and 129 m/s). At 72 m/s, nearly 44.95% to 80.13% reduction is noted. Whereas for 100 m/s and 129 m/s, it ranges between 46.27%-78.65% and 41.61%-62.41%, respectively. This may be owing to reduction in the tangential cutting forces which is mainly accountable for micro-cutting and ploughing resulting in lesser material removal from the work surface. Other possible cause may be that at higher impingement angle 60°, alumina erodent particle indent on the composite surface rather than cutting resulting to significant drop in EWR of all N66 composites. Interesting to see that at impact velocity 100 m/s, EWR of the GFN66 composite found be better than T-GFN66 hybrid composite may be higher hardness property of the hybrid material becomes highly vulnerable to micro-cracking on other hand GFN66 composite absorb the impact energy induced by the erodent particle though both composites are semi-ductile in nature. Impingement angle plays a vital role in judging the erosive charactertics of the polymer material. For ductile material, maximum erosion occurs at an impingement angle less than 30°, whereas for pure brittle material at higher 90° angle. However, for semi-ductile and semi-brittle materials, maximum erosion takes place at an impact angle range between 40°- 60° and 80°- 90°, respectively. In contrast, erosion wear depends on the various parameters such as type of matrix and reinforcement material used, type of work material, casting technique, testing conditions, types of erodent used, size of erodent particles, flow rate of particles, impact velocity and striking angles. Therefore, classifying of the material based on the erosion wear behavior is not definitive because shape of the eroding particles whether spherical or angular plays a critical factor as reported by Jha et al.24 and Sundararajan et al.25.

EWR of N66 based composites as a function of impingement angle eroded at constant impact velocity of (a) 72 m/s (b) 100 m/s (c) 129 m/s,
3.2. Effect of Impact velocity on erosion wear rate of N66 composites
Figure 5 shows the variation of EWR of N66 composites as a function impact velocity under different impingement angles. Impact velocity plays another significant factor affecting the erosion wear performance of the N66 composites. It is evident from the plots that EWR increases with increase in the impact velocity. This is because at higher impact velocity, alumina erodent particles strike the composite surface with higher kinetic energy which is sufficient enough to cause severe damage by means of micro-cutting, micro-ploughing and eventually resulting in material removal from the surface. Elevated velocities facilitate the erodent particles to penetrate deeper into the composite surface as they impact with higher kinetic energy resulting in rapid crack initiation and so higher erosion wear. However, according to Das and Biswas10, at higher impact velocity, tangential component of the impact force becomes more significant and hence intense erosion wear may occur. Neat nylon66 (N66) material showed lower resistance to erosion wear at all testing condition. However, blending N66 with SGF and hybridization of N66 with SGF and talc filler successfully reduces erosion wear loss of the N66 composites. Maximum EWR of 9.0624×10⁻⁵ g/g is recorded for N66 laminate at impact velocity of 129 m/s. However, under the same impact velocity, GFN66 exhibits 49.87% improvement in EWR over N66 material. This may be owing to the load bearing ability of the glass fibers which strengthen the matrix and thereby hinders the plastic deformation and offers resistance to the wear loss during erodent impact. T-GFN66 hybrid composite exhibits better erosion wear resistance ability, which is 62.21% and 24.77% better than N66 and GFN66 composite respectively. Morphology of the talc contributes to energy distribution during the erosion wear. Layered structure of talc filler endorses crack deflection, crack arrest and plastic deformation mechanisms which collectively reduces the material removal rate especially under oblique testing conditions. Furthermore, combined effect of SGF and talc particulates resulting in better energy absorption and improved surface stability, eventually causing reduction in erosion wear.

EWR of N66 based composites as a function of impact velocity eroded at constant impingement angle of (a) 30° (b) 45° (c) 60°.
Wiederhorn and Hockey26 and Follansbee et al.27 proposed the power law model to describe the wear behavior of the material with respect to the impact velocity. EWR of the material is expressed as a function of striking velocity as EWR=KVn, where EWR is erosion wear rate, ‘V’ is impact velocity, ‘K’ and ‘n’ represents velocity constant and velocity exponent, respectively. These constants can be obtained by fitting the EWR versus impact velocity curves by adopting the power law and shown in the Table 3. From the obtained velocity exponent constant ‘n’ values, nature of the material can be predicted. If ‘n’ values found in the range 1 to 2 and 4 to 6, then erosion behaviour can be assumed as ductile and brittle in nature, respectively. Semi-ductile and semi-brittle behaviour in erosion wear provided ‘n’ values are in the range of 2-3 and 3-4. However, in this study ‘n’ values of N66 composites clearly lies between 1 to 2 and 2 to 3, which clearly indicates that erosion wear behaviour ductile and semi-ductile in nature. Similar observations were reported by other researchers28,29. Moreover, increasing in velocity component ‘n’ values indicates higher resistance to erosion as exhibited by N66 composites. Acar et al.30 studied the solid particle erosion wear test on transparent materials. Results showed that velocity component ‘n’ of the erosion wear found in the range of 1.6 to 2.9, and confirms the increase in erosion resistance of the polymeric material with increasing ‘n’ values. Accordingly, results of present findings are in good agreement with the reported literature.
3.3. Erosion efficiency of the N66 composites
Erosion efficiency (η) of the N66 composite is illustrated in the Figure 6. By understanding the erosion efficiency, nature and mechanism of the erosion can be characterized. From the plot it is evident that η values found to be in the range of 0.222% to 4.349%. This range of erosion efficiency clearly suggest both ductile and semi-ductile behavior of the material, where in N66 composite transiting from ductile to semi-ductile behaviour due to the synergetic effect of SGF and talc filler inclusions which clearly consistence with the results of velocity component. Pradhan and Acharya31 studied the erosion wear behavior of Eulaliopsis binate (EB) fiber reinforced epoxy composite. They determined η values between 3.09% to 9.2%, and claimed developed material is semi-ductile in nature. Similar trend in erosion efficiency was reported for wood particulate filled epoxy composites by Prakash et al.32.

Erosion efficiency (η) of the N66 and its composites as a function of impact velocity eroded at an impingement angle of (a) 30° (b) 45° (c) 60°.
3.4. Topographical analysis
Topographical analysis of the eroded surfaces of the N66 material shows severe surface degradation, deeper craters, and characterized by grooves and so higher average surface roughness (Ra=3.80μm) and its 2D worn surface profile is shown in the Figure 7a. This is mainly owing to the relatively lower hardness and absence of reinforcement member in neat N66, making it more vulnerable to micro-cutting and plastic deformation during solid particle erosion. In contrast, GFN66 composite exhibits relatively smoother surface with reduced crater depth and so displays lower surface roughness (Ra=1.98μm) and its 2D surface profile is indicated in Figure 7b, suggesting improved resistance to erosion wear may be attributed to effective load transfer and shielding action of SGF. Furthermore, T-GFN66 hybrid composites showed least damage surface, demonstrating shallow erosion pits, minimal material pullouts, and so lowest surface roughness (Ra=1.69μm) as shown in Figure 7c from its 2D worn surface profile. Since T-GFN66 is hybrid composite consisting SGF and talc filler provide synergetic effect which improves surface hardness and effectively limits the crack initiation, thereby controls the erosion of work material. Figure 8a shows the average pentation depth of N66 composites. It is clear from the plot that N66 exhibits the higher penetration depth conveying severe material removed from the surface which may be attributed to the ductile nature of the neat N66 material. However, incorporation of the SGF and talc fillers into N66 composite helps in reducing the penetration depth as indicated in the Figure 8b. This clearly reflects the improved resistance to erodent impingement. Similar trend is observed for the average surface roughness exhibited by the N66 composites. It is evident that higher the penetration depth resulting in higher surface roughness and vice-versa. This improved surface roughness by GFN66 and T-GFN66 over the neat may be attributed to the enhanced stiffness, loading capacity and better resistance to surface damage. Barkoula and Karger-Kocsis33 relates the average surface roughness of the eroded surface with weight loss due to solid particle erosion. Korkusuz et al.34 related higher penetration depth to higher surface roughness.

2D surface profile of the eroded (a) Neat N66 (b) GFN66 (c) T-GFN66 hybrid composites measured using a 3D optical profilometer (Eroded at impingement angle 45° and impact velocity of 129 m/s).

Surface parameter of worn surface of N66 composites (a) penetration depth (b) average roughness.
3.5. Analysis of erosion wear rate using ML models
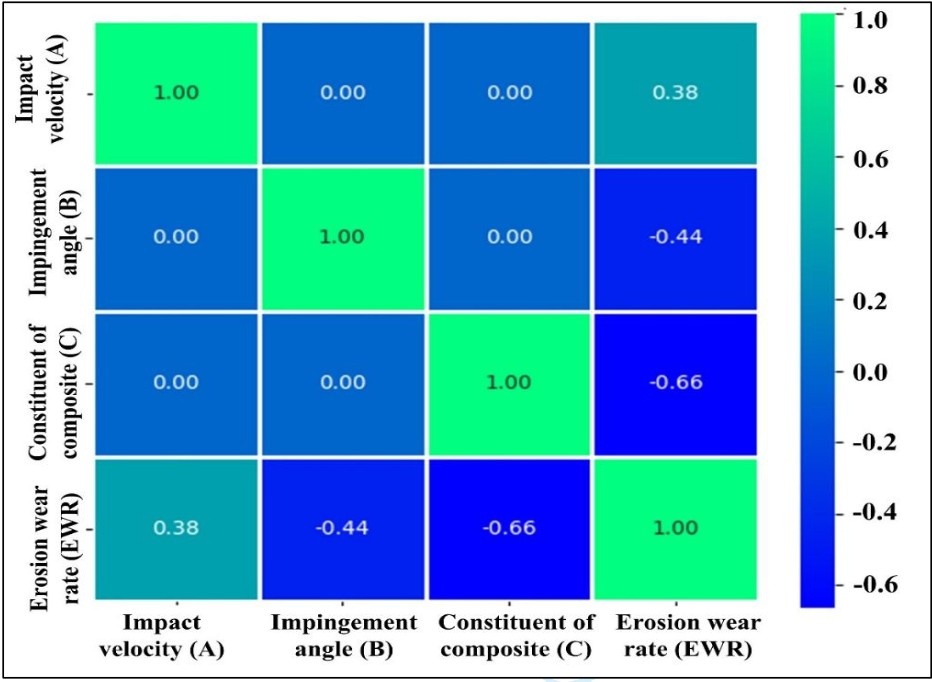
Before applying the ML algorithm, individual contribution of the input factors on the tribological properties has to be known so that nature of data and degree of correlation between input and output data can be comprehended. The heat map of ML model is one such powerful tool mainly employed to quantify the relationship between input factors and rank accordingly. The lighter color in heat map indicates the weak correlation whereas dark color for strong correlation. Besides, Pearson coefficient is used to correlate the degree of association between output EWR and input factors. If this coefficient value is closer to 1 suggest strong relation and in contrary if value is closer to 0 indicates weak correlation. Heat map for the present experimental dataset is plotted and shown in the Figure 9. It is evident from the heat map that, correlation coefficient between input variables such as impact velocity, impingement angle and constituent of composite with respect to output response EWR are, 0.38, -0.44, and -0.66, respectively. The positive coefficient of impact velocity indicates that EWR increases with increase in values of these factors. On the other hand, negative coefficient of impingement angle and composition of composite, indicates EWR decreases with increase in these parameters. From the heat map analysis, it is confirmed that constituent of composite and impingement angle is strongly related with EWR of Nylon66 composites.

Heat map depicting the degree of influence of different wear variables on erosion wear rate.
The EWR of the nylon66 composites for the selected testing data sets are predicted using the selected ML models and compared with the known experimental results as indicated in the Table 4. Also, comparison curves of predicted and experimental results for each ML models are plotted to check the efficacy of the developed ML model. Figure 10 shows the parity plots comparing predicted and experimental values of the EWR of Nylon composites using RF, ETR, GBM and KNN models. From the Figure 10a it clearly evident that RF model showed strong agreement between experimental and predicted EWR with R2 value of 0.930. RF model showed relatively low MSE, RMSE and MAE value of 4.20 × 10⁻¹¹, 6.48 × 10⁻⁶, 5.16 × 10⁻⁶, respectively. This indicates that overall prediction accuracy of the RF model is good. RF generally trained on bootstrapped datasets resulting in reduce of variance and stability enhancement. Due to the ensemble averaging mechanism of the RF model, it is useful in the predicting the EWR where non-linear interaction exists among the selected variables. Moreover, speciality of the RF model is that it treats all the trees equal and doesn’t focus particularly on correcting the residual errors, thus RF model leads to minor deviations unlike other models. Figure 10b shows the parity plot of ETR model comparing the predicted and experimental EWR values with further enhancement of R2 values of 0.949 along with reduced values of MSE, RMSE and MAE compared to the RF models. This improved performance of ETR machine learning model may be attributed to the increasing randomization while tree constructions, where both feature selection and split thresholds are randomly chosen. The inclusion of additional randomness effectively reduces the correlation between trees and eventually minimizes overfitting and so improves generalization capability. Although experimental values of EWR is scatter, ETR model effectively captures the global trends and remains less sensitive to noise. Figure 10c shows the parity plot of GBM model comparing the predicted and experimental EWR values. Among the evaluated models, GBM model exhibited better performance with highest R2 value of 0.966 and lowest error metrics like MSE = 2.01 × 10⁻¹¹, RMSE = 4.48 × 10⁻⁶, MAE = 3.39 × 10⁻⁶. The main reason for GBM to attained as best model is due to its sequential learning strategy, where each subsequent tree is trained to minimize the residual errors from the previous ensemble. Such unique error-corrective mechanism of GBM model makes to capture subtle non-linear relationships and higher order interactions of the control parameters. This eventually leads to the minimal deviation from the ideal fit line as depicted in the plot across the EWR, which clearly highlight the strong generalization and robustness of the model. In contrast to the previous machine learning model, KNN model as depicted in the Figure 10d shows weakest predicting ability as reflected from its lowest R2 value of 0.804. Moreover, KNN model showed significantly higher error metrics MSE = 1.17 × 10⁻¹⁰, RMSE = 1.08 × 10⁻⁵, and MAE = 8.53 × 10⁻⁶. Though R2 values is 0.804 within the acceptable range, its inferior performance amongst the other models such as RF, ETR, and GBM, may be attributed to its reliance on distance based local averaging which makes this KNN model sensitive to density of data, noise and feature scaling. Since experimental data of EWR is sparsely distributed, KNN unable to identify and extrapolate beyond the local boundaries or neighbourhoods. The extreme deviations of testing raw data points indicate the limited generalization capability, particularly under higher erosion wear conditions.

Predicted and Erosion wear rate of Nylon66 and its composites for (a) RF (b) ETR (c) GBM (c) KNN.
3.5.1. Comparative Interpretation and model superiority
The comparison results show differences in predicting the erosion wear rate of Nylon 66 under varying particle velocity, impact angle and material content. Tree-based models perform better than the KNN model, specifically at higher velocities and lower reinforcement levels. Under these tested conditions, erosion wear increases and prediction errors become more significant for distance-based methods. Among all the models, GBM gives the lowest MSE, RMSE and MAE values. This indicates that the predicted erosion wear rates are closer to the experimental values over the full range of testing conditions. ETR and RF models also shows good agreement with the experimental values but with slightly higher error values in some cases. Thus, model analysis suggest that tree-based ensemble models are more suitable for erosion wear prediction of Nylon 66 composites and it can help in selecting appropriate material composition and operating parameters.
3.5.2. Significance of Input parameters on prediction of EWR of N66 composites
Figure 11 shows the relative importance chart of input variables for different machine learning models for predicting the EWR of nylon66 composites. The score of each variables indicate the relative contribution to the selected target which generally ranges from 0 to 1. Higher the score implies highest contribution and sum of all the feature scores is equal to 1 as indicated in the Table 5. The feature importance graph of RF model showed that composition of composite and impingement angle are the most influencing the variables with score values of 0.541517 and 0.32668, respectively. Similar results are observed for GBM and ETR models. However, in case of KNN model, composition of composites and impact velocity are the most significant factors affecting the erosion wear of the nylon66 composites. Further it is evident from the plots that all the input variables exhibited non-zero scores and contributed to the prediction of the EWR. Table 5 shows the average score and rank of each input variables for each ML models. Constituent of composite shows highest average score (0.53255) and hence it has contributed majorly in prediction of erosion wear rate of Nylon66 composites followed by impingement angle (0.30251) and impact velocity (0.16492).

Feature importance score of input variables for predicting the EWR using different ML models.
3.6. Morphological analysis of worn surfaces
Figure 12a-b shows the FESEM micrographs neat N66 displaying intense surface damage which holds strong agreement with its highest EWR as obtained experimentally. Figure 12a depicts the micrograph of N66 composites eroded at an impact angle of 45° and velocity of 129 m/s. Micro-cutting, ploughing and significant number of grooves along with severe plastic deformation is evident and supports the claims of higher penetration depth and noticeable valleys captured in the 3D optical profilometer as portrayed in 3D false-color surface height maps as shown in the Figure 13. Damaged surface charactertics such a deeper troughs and dominance of peak valleys indicate the uncontrolled material removal from the work surface may be owing to the ductile property of N66 laminate. Moreover, absence of reinforcement member in N66 limits its resistance to impact forces and therefore material suffers extensive surface damages. Figure 12b depicts the micrograph of N66 composites eroded at an impact angle of 60° and velocity of 129 m/s. FESEM image reveals deep craters, cracking and fatigue endurance owing to the sharp increase of the normal impact stress. Such transition from the shear domination to impact resulting in the increased erosion depth and higher surface roughness.

FESEM image of the worn surface eroded at constant impact velocity (a, b) Neat N66 (c, d) GFN66 composite (e, f) T-GFN66 hybrid composites.
Figure 12c shows the FESEM images of the GFN66 composites eroded at an impact angle of 45° and velocity of 129 m/s. Surface morphological analysis clearly reveals restricted groove formation and quite reduced ploughing depth at lower striking angle. This may be attributed to the load bearing ability of the SGF. As a result of which lower peak to valley variation was less compared to the neat N66 which was observed in 3D false-color surface height maps (Figure 13b) and strongly in line with the lower penetration depth values. Incorporated SGF limits the plastic flow of matrix material and significantly reduces the cutting action alumina particles. Moreover, it is inevitable to avoid the fiber-matrix debonding and SGF pullouts as indicated in the Figure, which signifies material loss endured by the GFN66 composites. Figure 12d depicts the micrograph of GFN66 composites eroded at an impact angle of 60° and striking velocity of 129 m/s. In contrast to lower impact angle erosion, drastic shift in erosion mechanism to fiber fracture and matrix cracking takes place. FESEM images further discloses broken SGF and micro-craters and yet depth of penetration remains lower than neat N66. This may be attributed to the effective action of SGF in dissipating the impact energy and thus plays crucial role in curbing the surface damage resulting to improved erosion resistance.

3D optical profilometer false-color height map of the (a) neat N66 material (b) GFN66 (c) T-GFN66 eroded at impingement angle 45° and impact velocity of 129 m/s.
Figure 12e shows the FESEM images of the T-GFN66 hybrid composites eroded at an impact angle of 45° and velocity of 129 m/s. At this lower angle of impact, eroded surface of the T-GFN66 hybrid composite showed comparatively smoother surface accompanying with shallow grooves and reduced plastic deformation suggesting this hybrid composite offers better resistance to micro-cutting than neat N66 and GFN66 composites. Combine effect of SGF and talc filler improves surface hardness property of the composites thereby limits the micro-cutting and micro-abrasion mechanism. This characteristic directly relates with the findings of minimum penetration depth and lesser peak to valleys height variation as described in 3D false-color maps (Figure 13c), indicating the uniform erosion pattern endured by the hybrid T-GFN66 composites. At higher angle as depicted in the FESEM images (Figure 12f) of the T-GFN66 hybrid composites eroded at an impact angle of 60° and velocity of 129 m/s, clearly reveals suppressed crack propagation, minimal SGF fracture with reduced crater formation indicating that inclusion of talc particulates has enhances surface hardness property of the T-GFN66 hybrid composites and thereby enhances the uniform stress distribution across fiber-matrix interface. This paves the way for reduced localized stress concentration. Moreover, synergetic effect of talc filler and SGF significantly restricts for the erodent penetration and thereby controls material detachment from the work surface, resulting better erosion resistance among the developed N66 composites
4. Conclusions
-
Addition of SGF and talc filler improved the erosion wear resistance property of the N66 composite. T-GFN66 hybrid composite exhibited better EWR than neat N66 and GFN66. EWR of the N66 composites increased with increase in the impact velocity. Neat N66 material showed ductile behavior to erosion whereas GFN66 and T-GFN66 hybrid composite exhibited semi-ductile characteristics.
-
Four ML prediction models were developed to effectively forecast the EWR of the N66 composites. GBM and ETR models exhibited better performance in predicting the EWR of the N66 composite with R2 values of 96.66% and 94.99%, respectively. Amongst the developed ML models, GBM showed superior performance with highest R2 value of 0.966 and lowest error metrics like MSE = 2.01 × 10⁻¹¹, RMSE = 4.48 × 10⁻⁶, MAE = 3.39 × 10⁻⁶. Therefore, GBM model can used effectively in predicting the EWR of N66 composites.
-
Regardless of the ML model employed, constituent of composites and impingement angle are the most influencing factor with feature importance average score of 0.5325 and 0.3025 for evaluating the erosion wear performance of the N66 composites.
-
FESEM images of the eroded surface of N66 composites clearly showed wear mechanism endured under different erosion conditions. Micro-crack, crater formation, ploughing, and grooves on the worn surface clearly shows the different stages of erosion that composite materials had undergone.
Data Availability
5. References
-
1 Arjula S, Harsha A, Ghosh M. Solid-particle erosion behavior of high-performance thermoplastic polymers. J Mater Sci. 2008;43(5):1757-68. https://doi.org/10.1007/s10853-007-2405-0
» https://doi.org/10.1007/s10853-007-2405-0 -
2 Kar J, Rout AK, Sutar AK. Physical, mechanical, and erosion characterization of palm leaf stalk fiber reinforced epoxy composites filled with palm leaf stem stalk powder. BioResources. 2018;13(4):7212-31. https://doi.org/10.15376/biores.13.4.7212-7231
» https://doi.org/10.15376/biores.13.4.7212-7231 -
3 Drensky G, Hamed A, Tabakoff W, Abot J. Experimental investigation of polymer matrix reinforced composite erosion characteristics. Wear. 2011;270(1-2):146-51. https://doi.org/10.1016/j.wear.2010.08.017
» https://doi.org/10.1016/j.wear.2010.08.017 -
4 Gupta A, Kumar A, Patnaik A, Biswas S. Effect of different parameters on mechanical and erosion wear behavior of bamboo fiber reinforced epoxy composites. Int J Polym Sci. 2011;2011:592906. https://doi.org/10.1155/2011/592906
» https://doi.org/10.1155/2011/592906 -
5 Mahapatra S, Patnaik A, Satapathy A. Taguchi method applied to parametric appraisal of erosion behavior of glass fiber reinforced polyester composites. Wear. 2008;265(1-2):214-22. https://doi.org/10.1016/j.wear.2007.10.001
» https://doi.org/10.1016/j.wear.2007.10.001 -
6 Suresh A, Harsha A, Ghosh M. Erosion studies of short glass fiber reinforced thermoplastic composites and prediction of erosion rate using artificial neural networks. J Reinf Plast Compos. 2010;29(11):1641-52. https://doi.org/10.1177/0731684409338632
» https://doi.org/10.1177/0731684409338632 -
7 Mahapatra SK, Satapathy A. Erosion wear performance of titania filled ramie–epoxy composites: A data driven optimization study using supervised machine learning approach. J Elastomers Plast. 2025;57(2):189-214. https://doi.org/10.1177/00952443241307200
» https://doi.org/10.1177/00952443241307200 - 8 Biswas S, Ray S, Satapathy A, Patnaik A. Erosion wear behavior of TiO2 filled glass fiber reinforced epoxy composites. Mater Sci Indian J. 2009;5(3):258-66.
-
9 Jena H, Pradhan AK, Pandit MK. Study of solid particle erosion wear behavior of bamboo fiber reinforced polymer composite with cenosphere filler. Adv Polym Technol. 2018;37(3):761-9. https://doi.org/10.1002/adv.21718
» https://doi.org/10.1002/adv.21718 -
10 Das G, Biswas S. Erosion wear behavior of coir fiber reinforced epoxy composites filled with Al2O3 filler. J Ind Text. 2017;47(4):472-88. https://doi.org/10.1177/1528083716652832
» https://doi.org/10.1177/1528083716652832 -
11 Mohan N, Mahesha C, Rajaprakash B. Erosive wear behaviour of WC filled glass epoxy composites. Procedia Eng. 2013;68:694-702. https://doi.org/10.1016/j.proeng.2013.12.241
» https://doi.org/10.1016/j.proeng.2013.12.241 -
12 Nayak SK, Satapathy A, Mantry S. Impact of process parameters on solid particle erosion behavior of waste marble dust-filled polyester composites. Arab J Sci Eng. 2021;46(7):7197-209. https://doi.org/10.1007/s13369-020-05175-1
» https://doi.org/10.1007/s13369-020-05175-1 -
13 Gültürk E, Yarar E, Korkusuz OB, Kara A, Sınmazçelik T. Solid particle erosion and predictive modeling of epoxy composites reinforced with diatom frustules. Polym Compos. 2026;47(8):7094-108. https://doi.org/10.1002/pc.70609
» https://doi.org/10.1002/pc.70609 -
14 Purohit A, Satapathy A. A study on erosion wear performance of Linz–Donawitz sludge filled polypropylene matrix composites. IOP Conf Series Mater Sci Eng. 2018;3(1):012045. https://doi.org/10.1088/1757-899X/377/1/012045
» https://doi.org/10.1088/1757-899X/377/1/012045 -
15 Aydin F, Durgut R, Mustu M, Demir B. Prediction of wear performance of ZK60/CeO2 composites using machine learning models. Tribol Int. 2023;177:107945. https://doi.org/10.1016/j.triboint.2022.107945
» https://doi.org/10.1016/j.triboint.2022.107945 -
16 Mohammed AS, Dodla S, Katiyar JK, Samad MA. Prediction of friction coefficient of SU-8 and its composite coatings using machine learning techniques. Proc Inst Mech Eng, Part J J Eng Tribol. 2023;237(6):943-53. https://doi.org/10.1177/13506501221138382
» https://doi.org/10.1177/13506501221138382 -
17 Borjali A, Monson K, Raeymaekers B. Predicting the polyethylene wear rate in pin-on-disc experiments in the context of prosthetic hip implants using machine learning methods. Tribol Int. 2019;133:101-10. https://doi.org/10.1016/j.triboint.2019.01.014
» https://doi.org/10.1016/j.triboint.2019.01.014 -
18 Singh T, Patnaik A, Ranakoti L, Dogossy G, Lendvai L. Thermal and sliding wear properties of wood waste-filled poly(lactic acid) biocomposites. Polymers (Basel). 2022;14(11):2230. https://doi.org/10.3390/polym14112230
» https://doi.org/10.3390/polym14112230 -
19 Hasan MS, Kordijazi A, Rohatgi PK, Nosonovsky M. Triboinformatic modeling of dry friction and wear of aluminum base alloys using machine learning algorithms. Tribol Int. 2021;161:107065. https://doi.org/10.1016/j.triboint.2021.107065
» https://doi.org/10.1016/j.triboint.2021.107065 -
20 Hasan MS, Kordijazi A, Rohatgi PK, Nosonovsky M. Triboinformatics approach for friction and wear prediction of Al–graphite composites using machine learning methods. J Tribol. 2022;144(1):011701. https://doi.org/10.1115/1.4050525
» https://doi.org/10.1115/1.4050525 -
21 Kumar S, Singh KSK, Singh K. Data-driven modeling for predicting tribo-performance of graphene incorporated glass-fabric reinforced epoxy composites using machine learning algorithms. Polym Compos. 2022;43(10):6599-610. https://doi.org/10.1002/pc.26974
» https://doi.org/10.1002/pc.26974 -
22 Deliwala AA, Dubey K, Yerramalli CS. Predicting the erosion rate of uni-directional glass fiber reinforced polymer composites using machine-learning algorithms. J Tribol. 2022;144(9):091707. https://doi.org/10.1115/1.4054247
» https://doi.org/10.1115/1.4054247 -
23 Mahapatra SK, Satapathy A. Analysis and prediction of erosion behavior of epoxy composites using statistical and machine learning techniques. Proc Inst Mech Eng, E J Process Mech Eng. 2026;240(1):346-59. https://doi.org/10.1177/09544089241233948
» https://doi.org/10.1177/09544089241233948 -
24 Jha AK, Mantry S, Satapathy A, Patnaik A. Erosive wear performance analysis of jute–epoxy–SiC hybrid composites. J Compos Mater. 2010;44(13):1623-41. https://doi.org/10.1177/0021998309353962
» https://doi.org/10.1177/0021998309353962 -
25 Sundararajan G, Roy M, Venkataraman B. Erosion efficiency: a new parameter to characterize the dominant erosion micro-mechanism. Wear. 1990;140(2):369-81. https://doi.org/10.1016/0043-1648(90)90096-S
» https://doi.org/10.1016/0043-1648(90)90096-S -
26 Wiederhorn SM, Hockey BJ. Effect of material parameters on the erosion resistance of brittle materials. J Mater Sci. 1983;18(3):766-80. https://doi.org/10.1007/BF00745575
» https://doi.org/10.1007/BF00745575 -
27 Follansbee PS, Sinclair GB, Williams JC. Modelling of low velocity particulate erosion in ductile materials by spherical particles. Wear. 1981;74(1):107-22. https://doi.org/10.1016/0043-1648(81)90197-6
» https://doi.org/10.1016/0043-1648(81)90197-6 -
28 Pool K, Dharan C, Finnie I. Erosive wear of composite materials. Wear. 1986;107(1):1-12. https://doi.org/10.1016/0043-1648(86)90043-8
» https://doi.org/10.1016/0043-1648(86)90043-8 -
29 Mohapatra DK, Deo CR, Mishra P, Dash P. Effect of pistachio shell particles on mechanical and erosion wear performance of hybrid kenaf/glass polyester composites. Proc Inst Mech Eng, Part J J Eng Tribol. 2024;238(4):529-44. https://doi.org/10.1177/13506501231224686
» https://doi.org/10.1177/13506501231224686 -
30 Acar D, Danesh MH, Cora ÖN. Effect of process parameters on the solid particle erosion resistance of transparent materials. Tribol Ind. 2023;45(4):604-17. https://doi.org/10.24874/ti.1495.06.23.08
» https://doi.org/10.24874/ti.1495.06.23.08 -
31 Pradhan S, Acharya SK. Solid particle erosive wear behaviour of Eulaliopsis binata fiber reinforced epoxy composite. Proc Inst Mech Eng, Part J J Eng Tribol. 2021;235(5):830-41. https://doi.org/10.1177/1350650120931645
» https://doi.org/10.1177/1350650120931645 -
32 Prakash V, Bera T, Acharya SK. Mechanical and erosive wear behavior of rubber wood particulate reinforced epoxy composite. Mater Today Proc. 2019;19:223-7. https://doi.org/10.1016/j.matpr.2019.06.708
» https://doi.org/10.1016/j.matpr.2019.06.708 -
33 Barkoula N-M, Karger-Kocsis J. Solid particle erosion of unidirectional glass fiber reinforced epoxy composites with different fiber–matrix adhesion. J Reinf Plast Compos. 2002;21(15):1377-88. https://doi.org/10.1177/0731684402021015779
» https://doi.org/10.1177/0731684402021015779 -
34 Korkusuz OB, Gökçe ÖF, Tabak BE, Atasoy BN, Sınmazçelik T. Effects of polytetrafluoroethylene particle reinforcement and seawater aging on solid particle erosion behavior of epoxy composites. Mater Res Express. 2025;12(5):055305. https://doi.org/10.1088/2053-1591/add66c
» https://doi.org/10.1088/2053-1591/add66c