
 Influence of Intermetallic Fragmentation and Pulverization on the Corrosion Resistance of Yttrium-Containing ZK40 Magnesium Alloy
Abstract
Magnesium alloys are promising for automotive and aerospace applications due to their low density (1.74 g/cm3) and high specific strength; however, their use is limited by high corrosion susceptibility. This study investigated the influence of adding 1 wt.% yttrium (Y) and friction stir processing (FSP) on the microstructure and corrosion behavior of hot-rolled ZK40 magnesium alloy. Corrosion resistance was evaluated for both the base material (BM) and the stir zone (SZ) using electrochemical impedance spectroscopy (EIS), potentiodynamic polarization, immersion, and hydrogen evolution tests in 0.5 wt.% NaCl solution. FSP promoted the fragmentation and homogeneous redistribution of the yttrium-containing intermetallic phases. The ZK40-Y_SZ condition exhibited the highest corrosion resistance, with a corrosion current density of 0.26 μA cm−2 and a corrosion rate of 0.006 mm year−1. This superior performance was attributed to the combined effect of intermetallic fragmentation and redistribution, together with the formation of a more protective surface film.
Keywords:
Magnesium alloys; Friction stir processing; Corrosion; Intermetallic fragmentation
1. Introduction
Magnesium alloys have attracted considerable interest in applications such as structural components, particularly in the aerospace and automotive industries, due to their low density (1.74 g/cm3) and high specific mechanical strength1-4. However, the large-scale application of these alloys continues to face obstacles, mainly due to their high susceptibility to corrosion and poor hot weldability5-7.
The limited corrosion resistance of magnesium alloys is primarily attributed to their high chemical reactivity (standard electrode potential: −2.37 V vs. SHE) and the formation of a thin MgO/Mg(OH)2 surface film, which is generally porous and unstable and therefore provides limited protection in aggressive environments8,9. In addition, the presence of intermetallic particles and impurities promotes the formation of local microgalvanic couples between the magnesium matrix and the secondary phases, accelerating localized dissolution and hydrogen evolution10,11. The corrosion behavior of magnesium alloys is also strongly influenced by microstructural characteristics, including grain size, crystallographic texture, and the morphology and distribution of secondary phases12,13. To improve the performance of magnesium alloys, numerous studies have investigated the combined effects of rare-earth element additions and thermomechanical processing on their microstructure and corrosion behavior10,14-17. Among the rare earth elements, yttrium (Y) has stood out for its high solubility in the α-Mg matrix and its significant influence on increasing corrosion resistance, thermal stability, and hot workability of magnesium alloys2,18. These characteristics are achieved due to yttrium’s ability to facilitate recrystallization, forming new grains and resulting in a refined microstructure19-22. Yttrium also has the potential to improve the corrosion resistance of magnesium alloys, as it has a standard electrochemical potential (-2.372 V SHE) similar to that of magnesium (Mg). The presence of yttrium can facilitate the formation of a denser film on the surface of the magnesium alloy, providing it with a more effective protective layer against corrosive processes23.
Ansari et al.19 examined the influence of yttrium (Y) addition on the recrystallization, texture, and mechanical properties of Mg alloys with different Y contents (5% and 10% by weight), namely the Mg-5Y and Mg-10Y alloys. To observe recrystallization, the Mg-Y alloys used were rolled and annealed. The Mg-5Y alloy exhibited faster recrystallization kinetics than the Mg-10Y alloy, which was attributed to the effect of Y in retarding the recovery and recrystallization processes. The mechanical properties of the Mg-10Y alloy were significantly improved compared to the Mg-5Y alloy, which was attributed to the solid solution strengthening effect provided by the higher Y content.
Liu et al.22 investigated the effect of yttrium on the corrosion behavior of the Mg-Y magnesium alloy in a 3.5% (w/w) NaCl solution. The increase in Y content in the Mg-Y alloys led to the formation of Y-rich zones, which promoted corrosion reactions and decreased corrosion resistance. However, a suitable Y-rich structure improved corrosion resistance. The Y-rich zones at the grain boundaries acted as a barrier, reducing the corrosion rate. The galvanic effect caused by the Y-rich zone accelerated corrosion, but the barrier effect of the grain boundaries outweighed it, resulting in reduced corrosion.
Friction stir processing (FSP) has emerged as a solid-state processing technique capable of modifying the surface and microstructure of metallic materials without melting the substrate24. The severe plastic deformation and frictional heating generated during FSP promote dynamic recrystallization, grain refinement, and the fragmentation and redistribution of intermetallic particles within the material. These microstructural modifications can significantly influence corrosion behavior by reducing microstructural heterogeneities, promoting a more homogeneous distribution of intermetallic particles, and consequently altering the microgalvanic coupling responsible for accelerating the corrosion process25,26.
In this context, the present study aims to evaluate how the fragmentation and redistribution of yttrium-containing intermetallic phases, induced by hot rolling and friction stir processing, affect the corrosion behavior of the ZK40 magnesium alloy.
2. Materials and Methods
2.1. Hot rolling
The cast ZK40 and ZK40-Y alloys used in this work are the same as those presented by Buzolin et al.27 In their work, with the chemical composition described in Table 1. The ZK40 and ZK40-Y alloys were subjected to hot rolling. The furnace and rolling mill of the Center for Research and Analysis of Engineering Materials (CEPAME) of EESC-USP were used for this procedure. A resistive furnace was used with a temperature of 1000±2 ºC and a rolling mill with two symmetrical 75 mm diameter rolls and controllable rotation with a maximum speed of 13 rpm. The initial ZK40 and ZK40-Y plates, with sizes of 50x60x17 mm (width, length, and thickness), were hot rolled at 350 °C by applying a 10% reduction per pass and total reduction of approximately 65%.
2.2. Friction stir processing (FSP)
FSP was conducted using a RM1 machine at the National Center for Research in Energy and Materials (CNPEM), Campinas, Brazil. The ZK40-Y alloy sheets to be welded were 40 mm wide, 200 mm long, and 5 mm thick. A quenched and tempered AISI H13 steel tool was used with a 3° concave shoulder and a 5 and 5 mm high conical base insert pin. The plates were welded using a normal force of 15 kN, a rotational speed of 1200 rpm, and a feed rate of 400 mm/min with an inclination angle of 3°.
2.3. Microstructural characterization
Samples were extracted from the joint in cross-section and prepared metallographically by grinding with 320, 600, 1200, and #2000 sandpaper, followed by polishing with a silica colloidal suspension (OPU). The microstructural investigation was conducted using a HITACHI model TM-3000 Scanning Electron Microscope in (BSE) mode at the LabVale Laboratory of the Federal University of the Jequitinhonha and Mucuri Valleys -Diamantina Campus.
2.4. X-ray diffraction
Phase analyses were carried out by XRD at the LabVale Laboratory of the Federal University of the Jequitinhonha and Mucuri Valleys-Diamantina Campus using a Shimadzu XRD-6000 diffractometer equipped with Cu-Kα monochromatic radiation (λ = 0.15406 nm, 40 kV and 30 mA). Samples of the ZK40 and ZK40-Y alloys comprised base material (BM) and FSPs.
2.5. Residual stresses
Residual stresses (RS) were analyzed in the welded butt-joints of the ZK40-Y alloy at rotation of 1200 rpm and speed of 400 mm/min. A Panalytical MRD-XL X-ray diffractometer installed at the Center for Research and Analysis of Engineering Materials (CEPAME) of the São Carlos School of Engineering (EESC-USP) was used. RS analyses were conducted at a scan rate of 2.0 degrees/min over a 2-theta measurement range of 10° to 80°. The sin2ψ method was used with fixed energy and varying 2-theta, applying seven Psi spaced between 0° and 76°. Stress analysis was carried out with an incident beam every 4 mm along the weld bead.
2.6. Corrosion tests
Corrosion resistance was measured on the ZK40 and ZK40-Y alloys in the base metal (BM) and the stir zone (SZ) using electrochemical experiments, immersion, and hydrogen evolution tests. For this purpose, the samples were cut, sanded with 320, 600, 1200, and #2000 grit sandpaper, and polished with a silicon colloidal suspension (OPU). All corrosion experiments were performed in triplicate to ensure the reproducibility of the results. The values presented correspond to the mean ± standard deviation of three independent measurements.
2.6.1. Electrochemical tests
Electrochemical corrosion tests were also carried out in a 0.5% NaCl solution at room temperature using a Gamry Reference 600 potentiostat. A standard three-electrode cell was used, with a saturated calomel reference electrode, a counter electrode (platinum), and a working electrode. Electrochemical impedance spectroscopy measurements were carried out using a frequency range from 30 kHz to 10 mHz and considering a disturbance amplitude of 10 mV (RMS)21. The EIS data were fitted using the equivalent electrical circuits shown in Figure 1. Initially, different circuit models were evaluated using the Gamry Echem Analyst software, and the final circuits were selected based on the quality of the fit, as assessed by the chi-square (X2) value.

Equivalent electrical circuits used for fitting the EIS data. ZK40, ZK40-Y_BM, and ZK40-Y_SZ (a) 1 hour (b) 12 and 24 hours.
Potentiodynamic polarization curves were obtained at a scan rate of 1 mV/s over a voltage range of -1.5 to +1.5 V. The Tafel extrapolation method determined the corrosion potential and current density values for ZK40 and ZK40-Y base metal (BM) and stir zone (SZ) alloys.
2.6.2. Immersion tests
The immersion tests to assess mass loss were carried out on the samples in triplicate. Samples measuring 1.0 cm2 with a thickness of 0.5 cm were used for the ZK40 and ZK40-Y samples, and 0.5 cm2 with a thickness of 0.5 cm for the ZK40-Y_SZ samples. Solutions of 0.5% by weight of sodium chloride (NaCl) were prepared for immersion. The samples were weighed using a balance (SHIMADZU) and then hung by nylon threads in a 0.5% NaCl solution at a temperature of 25ºC for different exposures: 2, 24, 48, 72, 120, and 168 hours. The amount of immersion solution was defined in accordance with ASTM G31-72 in order to maintain a ratio of the amount of solution per sample area. To remove the corrosion products formed, they were mechanically cleaned using a cleaning brush and rinsed with distilled water before each weighing. The corrosion rate (mm/year) was calculated using the following relationship28:
Where
CR= Corrosion rate (mm/year)
= Loss of mass (g)= Constant (87600)
= Specific mass of alloy (g/cm3)
= Area (cm2)
= Time (hour)
2.6.3. Hydrogen evolution tests
The experimental apparatus shown in Figure 2 was used for the hydrogen evolution tests. The specimens were placed in the bottom of the beakers, the funnel was placed on top of the sample, and 200 mL of 0.5% NaCl solution was added. The burette was then filled with solution and placed upside down in the funnel. The initial volume of the burette and the initial time were recorded. The volume change was monitored at 15-minute intervals during the first hour, followed by 30-minute intervals over the next six hours, and then at 24-hour intervals.

With the variation in the volume of solution over time, the volume of hydrogen (mL.cm-2) and the corrosion rate (mm/year) were calculated by the evolution of hydrogen, using the following equations8:
3. Results
3.1. Hot rolling
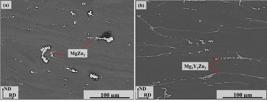
Acoording to Figures 3, the microstructure of the ZK40 and ZK40-Y alloys shows grains with intermetallic compounds elongated along the rolling direction and compressed along the normal direction, indicating that they also plastically deformed during hot rolling.

SEM-BSE micrographs and EDS mapping of hot-rolled alloys after 65% reduction: a) ZK40; b) ZK40-Y.
EDS elemental mapping confirmed the presence of Mg, Zn, Zr, and Y in the investigated alloys. Phase analysis revealed that the ZK40 alloy predominantly contained the MgZn2 phase, whereas the ZK40-Y alloy exhibited a Mg–Y–Zn ternary intermetallic phase identified as Mg3Y2Zn3, as confirmed by the XRD results shown in Figure 4. Zirconium was not detected as a constituent of these intermetallic phases, most likely because of its low concentration and its primary role as a grain refiner during solidification29.

As shown in Figure 5, the plastic deformation is primarily concentrated within the α-Mg matrix, indicating that the intermetallic compounds are likely harder than the surrounding matrix. In the ZK40 alloy (Figure 5a), a lower apparent fraction of intermetallic particles is observed, which may be associated not only with the fragmentation induced by hot rolling but also with the partial dissolution of the MgZn2 phase during processing at 350 °C. In contrast, the ZK40-Y alloy retained a more continuous intermetallic network aligned with the rolling direction. This behavior can be attributed to the higher thermal stability of the yttrium-containing intermetallic phases, which are less susceptible to dissolution and fragmentation during thermomechanical processing27.
3.2. Friction stir processing
Figure 6 shows the cross-sectional microstructure after FSP. The welded joint showed three regions with different microstructures: stirred zone (SZ), thermomechanical affected zone (TMAZ), and base material (BM) for the forward and reverse sides.

Micrographs of the cross-section of the welding region (SEM-BSE) (a) retreating side and (b) advancing side.
As shown in Figure 6a, b, the ZK40-Y alloy exhibited a microstructure in the stir zone (SZ) that was distinctly different from those observed in the base material (BM) and the thermomechanically affected zone (TMAZ). The SEM-BSE images reveal that the elongated microstructural features present in the rolled material were significantly modified during FSP, exhibiting a more fragmented and finely dispersed morphology within the processed region30. These microstructural changes are characteristic of the severe plastic deformation and localized heating associated with the FSP.
The Mg3Y2Zn3 intermetallic phase identified in the base material was also detected in the stir zone (SZ) after FSP, as shown in Figure 7. Changes in the diffraction peak intensities of both the α-Mg matrix and the Mg3Y2Zn3 phase were observed when comparing the ZK40-Y_BM and ZK40-Y_SZ conditions. The persistence of the characteristic Mg3Y2Zn3 diffraction peaks after FSP indicates that this intermetallic phase, which has a melting point of approximately 520 °C, was not completely dissolved during processing. Instead, the severe plastic deformation promoted its fragmentation and homogeneous redistribution throughout the magnesium matrix31.

3.3. Residual stresses
X-ray diffraction (XRD) using the sin2ψ method was used to determine the residual tension distribution in the FSP processed region. Figure 8 shows the residual stress graph for the ZK40-Y alloy after FSP. The shoulder region, which comprises the stirred zone (SZ), shows mostly tensile stresses. In contrast, compressive stresses predominate for the thermomechanical affected zones (TMAZ) and for the base metal on the forward and reverse sides. There is also a symmetrical trend, similar to an "M" shape for the graph. The maximum residual tensile stress occurring on the backward side was 50 MPa, and on the forward side, approximately 35 MPa.

The stress distribution observed is characteristic of the friction stir processing (FSP) technique and results from the combined effects of localized heating generated by tool friction and the severe plastic deformation imposed on the material during processing. These effects promote thermal expansion and contraction, which, upon cooling, lead to the redistribution of residual stresses throughout the processed region. Higher tensile residual stresses are generally expected on the advancing side (AS); however, in the present study, the highest tensile stress values were measured on the retreating side (RS). This observation suggests that the cooling rate, which increases with the peak temperature reached during processing, is higher on the advancing side, allowing this region to reach room temperature more rapidly. Consequently, the higher tensile residual stresses observed on the retreating side can be attributed to the final stage of thermal contraction experienced by this region during cooling, resulting in greater tensile stress development than on the advancing side32,33.
3.4. Corrosion behavior
3.4.1. Electrochemical impedance spectroscopy
Figures 9 shows the data obtained through electrochemical impedance spectroscopy analysis for the ZK40, ZK40-Y_BM, and ZK40-Y_SZ alloys after 1, 12, and 24 hours of immersion in 0.5% NaCl by weight. The first hour of immersion showed different behaviors from 12 to 24 hours for all the samples. At one hour, the Nyquist graph consists of two capacitive semicircles at high and medium frequencies. In contrast, at 12 and 24 hours, the graph shows capacitive behavior at high and medium frequencies, followed by inductive behavior at low frequencies. The high-frequency capacitive semicircle is probably related to charge transfer during the corrosion process, while the inductive semicircle may be related to localized corrosion produced by the adsorption of electrically active species such as Mg (OH)2 on the surface of the samples34.

Data obtained from electrochemical impedance spectroscopy alloy at immersion times of 1, 12, and 24 hours: ZK40 (a) Nyquist graph, (b,c) Bode graphs, ZK40-Y_BM (d) Nyquist graph, (e, f) Bode graphs and ZK40-Y_SZ (g) Nyquist graph, (f, i) Bode graphs.
After 1 hour of testing, the ZK40 and ZK40-Y_BM samples showed semicircles of greater magnitude compared to the 12- and 24-hour periods, suggesting more excellent corrosion resistance in the first hour of testing and a decrease with immersion time. In the case of samples from the weld region (ZK40-Y_SZ), the size of the semicircles increased with immersion time. The larger diameter of the capacitive semicircles shown by the ZK40-Y_SZ alloy samples demonstrates more excellent resistance to charge transfer and better corrosion resistance35. As the presence of inductive semicircles is indicative of localized corrosion, the absence of these semicircles in the first hour for all samples may be evidence of better corrosion resistance due to the breakdown and formation of a protective film during this time.
The bode plots, Figure 9b, e, h, show the relationship between the impedance modulus (|Z|) in relation to the variation in frequency. At low frequencies of 0.01 Hz, the ZK40-Y_SZ samples showed a higher impedance modulus at all immersion times (Table 2). According to Jiao et al.18, higher |Z| values at low frequencies indicate that the material has a better resistance to corrosion, reinforcing the answers obtained previously.
Data extracted from the Bode plots for the ZK40, ZK40-Y_BM and ZK40-Y_SZ alloys, at a frequency of 10 mHz, for immersion times of 1, 12, and 24 hours.
Two equivalent circuits were used to adjust the impedance spectroscopy data to better understand the corrosion phenomena occurring at the interface of the samples studied, as shown in Figure 1. For 1 h of immersion there is the equivalent circuit in Figure 1a, in which Rs is the resistance of the solution, Rct represents the resistance to charge transfer between the electrode interface and the solution, Rf is the resistance of the surface film formed, CPEf represents a constant phase element with non-ideal capacitive behavior and was introduced to compensate for the inhomogeneity of the electrochemical system and CPEdl is the double layer capacitance at the metal/electrolyte interface18.
The electrochemical behavior of the ZK40 and ZK40-Y alloys during immersion in a 0.5% NaCl solution. In both alloys, a decrease in solution resistance (Rs) was observed over time. Charge transfer resistance (Rct) exhibited different behavior throughout the immersion. Acoording to Table 3, in the ZK40 alloy, the Rct values decreased from approximately 2240 Ω·cm2 after 1 h to 1582 Ω·cm2 after 24 h. For the ZK40-Y alloy, a similar trend was observed, with Rct decreasing from 2247 Ω·cm2 to 1402 Ω·cm2 after 24 h. This decrease suggests that, in both alloys, the corrosion film formed during exposure to the electrolyte exhibits poor adhesion and stability to the surface and is unable to act as a protective barrier, which promotes charge transfer at the metal/electrolyte interface and the progression of the corrosion process. The ZK40-Y alloy exhibited Rct values very close to those observed for the ZK40 alloy, demonstrating that the addition of yttrium, under the rolled-only condition, did not increase corrosion resistance.
EIS experimental data fitting results for the ZK40, ZK40-Y_BM and ZK40-Y_SZ alloys, after immersion in 0.5% NaCl solution by weight for the 1, 12, and 24 hours.
For the times of 12 and 24 hours the proposed circuit, in addition to the components Rs, Rct and CPEdl, two new components were added to the system: RL ion diffusion resistance on the surface and L inductor element active at low frequencies (Figure 1b)21. The series combination of RL and L was used to simulate the inductive response of the system and is usually associated with the presence of reaction intermediates or adsorbed species on the electrode surface during the corrosion reaction.
The resistance to charge transfer (Rct) decreases with time in the ZK40 and ZK40-Y_BM alloys, while for the ZK40-Y_SZ alloy, this resistance increases with immersion time. The decrease in resistance to load transfer indicates a decrease in the protective capacity of the corrosion layer formed on the metal surface. Thus, with the immersion time in the ZK40-Y_SZ alloy, a denser oxide layer is formed, which offers more excellent protection to the alloy.
3.4.2 Potentiodynamic polarization curves
Figure 10 shows the polarization curves for the samples studied in 0.5% NaCl solution. The polarization curves were obtained 24 hours of immersion after the open circuit potential reached a steady state. The polarization curves comprise two distinct branches: the cathodic and anodic branches. The cathodic branch shows the hydrogen evolution, while the anodic branch shows the dissolution of the metal. It can be seen that the addition of Y had little effect on the cathodic process since the alloys studied showed very similar curves. However, the microstructural refinement promoted by FSP processing contributed to the curve shifting further to the left and reducing the corrosion current.

Acoording to Table 4, for the ZK40 and ZK40-Y_SZ samples, the Ecorr values were very similar and more positive compared to the ZK40-Y_BM samples, while the icorr values were much lower for ZK40-Y_SZ. The lower corrosion density values for the ZK40-Y_SZ alloy also suggest greater corrosion resistance. However, the data obtained from the Tafel curve does not provide accurate data for estimating corrosion resistance in Mg alloys. According to Curioni et al.36, the measurement of the anodic slope is difficult due to the "negative difference effect" where magnesium oxidizes under anodic polarization, resulting in the formation of hydrogen bubbles and alkalization near the electrode surface37.
3.4.3 Immersion test
Figure 11 displays the results of the immersion corrosion test for the ZK40, ZK40-Y_BM, and ZK40-Y_SZ alloys. In the first 24 hours of immersion, the ZK40-Y_BM alloys that have only undergone the rolling process show a lower corrosion rate than the ZK40 and ZK40-Y_SZ alloys. However, as time passes, the corrosion rate increases for all samples.

Corrosion rate graph (mm/year) of the samples, ZK40-Y_BM, ZK40-Y_SZ, immersed in a solution of 0.5% by weight of NaCl.
The addition of yttrium in this work was carried out to improve the hot workability of the ZK40 alloy and its corrosion resistance. In this process, yttrium tends to oxidize preferentially to magnesium, providing cathodic protection15,38. A more significant mass loss is observed over time for the ZK40-Y_BM alloy, demonstrating that adding Y to the alloy while rolled did not improve corrosion resistance. When comparing the three samples, ZK40-Y_ SZ shows lower mass loss with increasing exposure time. ZK40-Y_ BM and ZK40-Y_SZ have the same composition. However, the ZK40-Y_SZ samples experienced more significant deformation due to the rolling and welding process. As a result, the ZK40-Y_SZ samples have a more refined microstructure with even more dispersed intermetallics31,35,39,40.
3.4.4. Hydrogen evolution tests
The amount of hydrogen evolved and the rates of hydrogen evolution corrosion with the time of immersion in 0.5% NaCl solution by weight are shown in Figure 12. For the first few minutes of the test, there was no variation in the volume of hydrogen in the samples, which was observed after one day of testing. From the first day onwards, the variation in the volume of hydrogen and, consequently, the corrosion rate begins to decrease, especially for the ZK40-Y_SZ alloy.

Volume of hydrogen for samples ZK40, ZK40-Y_BM and ZK40-Y_SZ samples in 0.5% NaCl solution by weight.
Adding yttrium to magnesium alloys is expected to help increase their resistance to corrosion in two main ways: by reducing the formation of galvanic pairs and, secondly, by promoting the formation of a denser oxide layer on the surface of the alloys41. This oxide layer tends to reduce the evolution of hydrogen on the material's surface and reduce the corrosion rate over time. It can be seen that the corrosion rate (mm/per year), Figure 13, decreases for all the alloys, with the lowest recorded for the ZK40-Y_SZ alloy.

Hydrogen evolution rate for samples ZK40, ZK40-Y_BM and ZK40-Y_SZ in 0.5% NaCl solution by weight.
3.4.5. Characterization of the corrosion products
Figure 14 shows the morphology of the three alloys after immersion for 24 hours in a solution of 0.5% NaCl by weight. The surface of the samples shows a whitish layer, especially for the ZK40-Y_BM and ZK40-Y_SZ samples. Darker colored regions are also observed on the ZK40 alloy. Darker regions on the surface of magnesium alloys indicate that during the corrosion process, hydrogen evolution occurs mainly in these regions36,37.

Optical microscopy showing the surface morphology of the corroded samples after 24 hours immersion in 0.5% NaCl solution (a) ZK40, (b) ZK40-Y_BM, (c) ZK40-Y_SZ, (d) X-ray diffractograms of the corrosion layer on the samples after 24 hours immersion in 0.5% NaCl solution.
The X-ray diffractograms of the corrosion products, obtained after 24 hours of immersion in a 0.5% NaCl solution for 24 hours, can be seen in Figure 14d. The primary corrosion product identified was Mg(OH)2. No peaks of the MgCl2 phase were identified for any of the samples, however, the participation of Cl− ions in the corrosion process cannot be ruled out, as these species may be adsorbed onto the corrosion products, incorporated within the corrosion layer, or present in concentrations below the detection limit of the conventional XRD technique employed in this study. The whitish layer observed in Figure 14 for all samples is most likely associated with the accumulation of magnesium-based corrosion products, predominantly Mg(OH)2, as identified by XRD.
4. Discussions
Magnesium and its alloys are highly susceptible to corrosion in environments containing chloride ions. These ions promote the rupture of the Mg(OH)2 layer, exposing the metallic surface to the electrolyte17,42. The corrosion behavior of magnesium alloys is also strongly influenced by the distribution of microstructural constituents, such as secondary phases and intermetallic particles, which are electrochemically nobler than the magnesium matrix and therefore act as cathodic sites, while the magnesium matrix behaves as the anodic region, promoting microgalvanic corrosion34,43. Following rolling, the ZK40 alloy exhibited the MgZn2 phase, whereas the ZK40-Y alloy contained the Mg3Y2Zn3 phase, both distributed throughout the α-Mg matrix and aligned along the rolling direction. Since these intermetallic phases exhibit a different electrochemical potential from that of the α-Mg matrix, they can act as local cathodes, while the surrounding magnesium matrix serves as the anode, promoting localized dissolution, particularly at the intermetallic/α-Mg interfaces.
The results show that the addition of Y alone did not improve corrosion resistance, as the ZK40-Y_BM condition performed worse than the ZK40 alloy in the electrochemical, weight loss, and hydrogen evolution tests. This conclusion is consistent with the corrosion behavior previously reported for these alloys in their as-cast condition27. Although rolling promoted the flattening and orientation of the intermetallic network in the rolling direction, these modifications were not sufficient to reduce the formation of microgalvanic cells between the magnesium matrix and the yttrium-enriched regions.
After FSP, the SEM-BSE images revealed a significant qualitative change in the morphology of the intermetallic particles in the ZK40-Y alloy. The elongated microstructural features observed in the rolled material became more fragmented and homogeneously dispersed within the processed zone. XRD analysis confirmed the persistence of the Mg3Y2Zn3 phase after processing, indicating that it was not completely dissolved. These findings suggest that FSP promoted a more homogeneous redistribution of the intermetallic particles, reducing the density of localized cathodic sites and consequently favoring the formation of a more compact and protective surface film . According to Song et al.6, the corrosion of magnesium in aqueous solutions can be described by the following reactions:
In the presence of Cl− ions, the Mg(OH)2 layer formed during the corrosion of magnesium is unstable6,44. Chloride ions can penetrate through defects or less compact regions of the corrosion film, promoting its localized breakdown and exposing the underlying α-Mg matrix to the electrolyte11,42. As a result, both the anodic and cathodic reactions continue to occur, leading to the continuous dissolution of magnesium. In addition to the Mg(OH)2 phase identified by XRD, small amounts of yttrium-rich corrosion products may also have been incorporated into the corrosion layer. Previous studies on Y-containing Mg alloys22,45 have shown that the formation of a thin, poorly crystalline inner layer enriched in Y2O3 is possible. In the present study, however, such a layer was not detected by XRD, most likely because of the relatively low Y content (1 wt.%).
The ZK40-Y_SZ condition exhibited the highest charge-transfer resistance (Rct), the lowest corrosion current density (icorr), and the lowest weight-loss and hydrogen evolution rates, indicating that FSP promoted the formation of a corrosion product layer with enhanced barrier properties in the ZK40-Y alloy, most likely due to the presence of yttrium-containing oxides.
In addition to the modifications in the composition and protective properties of the corrosion product layer, another factor that may influence the corrosion behavior of the processed region is the residual stress introduced by the severe plastic deformation associated with FSP. Tensile residual stresses were detected in the stir zone (SZ), whereas the corrosion tests demonstrated that this region exhibited superior corrosion resistance. These results indicate that, under the conditions investigated, the influence of the residual stresses was outweighed by the beneficial microstructural changes induced by FSP. Similarly, Seifiyan et al.35 reported that the microstructural modifications introduced by processing had a greater influence on the corrosion resistance of magnesium alloys in NaCl solution than the residual stresses.
Overall, the results indicate that the improvement in the corrosion resistance of the ZK40-Y alloy after FSP cannot be attributed solely to the addition of yttrium. Rather, the combination of FSP and Y addition promoted significant microstructural modifications, characterized by the fragmentation and homogeneous dispersion of the Mg3Y2Zn3 intermetallic phase, together with the formation of a corrosion product layer exhibiting enhanced barrier properties. These combined effects reduced the dissolution rate of the magnesium matrix, as demonstrated by the electrochemical impedance spectroscopy (EIS), potentiodynamic polarization, weight-loss, and hydrogen evolution results.
5. Conclusions
Hot rolling and welding were successfully conducted to modify the microstructure of the ZK40 and ZK40-Y alloys, and the following conclusions could be drawn:
-
Friction stir processing (FSP), under the selected tool rotation and traverse speed conditions, promoted microstructural modifications that resulted in improved corrosion resistance of the stir zone (SZ) compared with the base material (BM).
-
Residual stress analysis revealed higher tensile residual stresses on the retreating side than on the advancing side, a characteristic stress distribution associated with the FSP process.
-
Whereas the corrosion resistance of the ZK40 and ZK40-Y_BM conditions decreased with increasing immersion time, the ZK40-Y_SZ condition exhibited the opposite behavior, suggesting the formation of a more protective surface film, most likely promoted by the more homogeneous distribution of the microstructural constituents.
-
The corrosion tests demonstrated that the addition of yttrium alone was insufficient to improve the corrosion resistance of the ZK40 alloy. The beneficial effect was observed only when the yttrium-containing intermetallic phases were fragmented and more homogeneously redistributed throughout the magnesium matrix as a result of friction stir processing.
6. Acknowledgements
The authors would like to thank PPGQ-UFVJM, the partners at EESC-USP and IPRJ-UERJ, the Magnesium and Hydrogen Research Group at UFVJM-Janaúba, as well as LMMA, which is sponsored by FAPEMIG [APQ-03088-2]. H.C.P. and I.N.B. are CNPq scholarship recipients. We are grateful for the financial support from CAPES—Funding Code [001] and FAPEMIG for the fellowships awarded to J.K.L.R., W.O.J., M.J.A.S., and N.M.C. We also thank CNPq and Faperj for the support provided for this work.
7. Data Availability
The entire dataset supporting the results of this study has been made available and can be accessed at [10.5281/zenodo.23369240].
8. References
-
1 Tan J, Ramakrishna S. Applications of magnesium and its alloys: a review. Appl Sci (Basel). 2021;11(15):6861. https://doi.org/10.3390/app11156861
» https://doi.org/10.3390/app11156861 -
2 Zhang C, Li Z, Zhang J, Tang H, Wang H. Additive manufacturing of magnesium matrix composites: comprehensive review of recent progress and research perspectives. J Magnes Alloy. 2023;11(2):425-61. https://doi.org/10.1016/j.jma.2023.02.005
» https://doi.org/10.1016/j.jma.2023.02.005 - 3 Mordike BL, Kainer KU. Magnesium alloys and their applications. Weinheim: Wiley-VCH Verlag GmbH; 2000.
-
4 Bai J, Yang Y, Wen C, Chen J, Zhou G, Jiang B, et al. Applications of magnesium alloys for aerospace: a review. J Magnes Alloy. 2023;11(10):3609-19. https://doi.org/10.1016/j.jma.2023.09.015
» https://doi.org/10.1016/j.jma.2023.09.015 -
5 Yang Y, Xiong X, Chen J, Peng X, Chen D, Pan F. Research advances in magnesium and magnesium alloys worldwide in 2020. J Magnes Alloy. 2021;9(3):705-47. https://doi.org/10.1016/j.jma.2021.04.001
» https://doi.org/10.1016/j.jma.2021.04.001 -
6 Song GL, Atrens A. Recently deepened insights regarding Mg corrosion and advanced engineering applications of Mg alloys. J Magnes Alloy. 2023;11(11):3948-91. https://doi.org/10.1016/j.jma.2023.08.012
» https://doi.org/10.1016/j.jma.2023.08.012 -
7 Olugbade TO, Omiyale BO, Ojo OT. Corrosion, corrosion fatigue, and protection of magnesium alloys: mechanisms, measurements, and mitigation. J Mater Eng Perform. 2022;31(3):1707-27. https://doi.org/10.1007/s11665-021-06355-2
» https://doi.org/10.1007/s11665-021-06355-2 -
8 Atrens A, Song GL, Liu M, Shi Z, Cao F, Dargusch MS. Review of recent developments in the field of magnesium corrosion. Adv Eng Mater. 2015;17(4):400-53. https://doi.org/10.1002/adem.201400434
» https://doi.org/10.1002/adem.201400434 -
9 Song Y, Liu Q, Wang H, Zhu X. Effect of Gd on microstructure and stress corrosion cracking of the AZ91-extruded magnesium alloy. Mater Corros. 2021;72(7):1189-200. https://doi.org/10.1002/maco.202112294
» https://doi.org/10.1002/maco.202112294 -
10 Gusieva K, Davies CHJ, Scully JR, Birbilis N. Corrosion of magnesium alloys: the role of alloying. Int Mater Rev. 2015;60(3):169-94. https://doi.org/10.1179/1743280414Y.0000000046
» https://doi.org/10.1179/1743280414Y.0000000046 -
11 Yan Q, Hou L, Sun J, Li D, Song J, Liu X, et al. Regulating the localized corrosion of grain boundary and galvanic corrosion by adding the electronegative element in magnesium alloy. Corros Sci. 2025;244:112667. https://doi.org/10.1016/j.corsci.2024.112667
» https://doi.org/10.1016/j.corsci.2024.112667 -
12 Xie J, Zhang J, You Z, Liu S, Guan K, Wu R, et al. Towards developing Mg alloys whith simultaneously improved strength and corrosion resistance via RE alloying. J Magnes Alloy. 2021;9(1):41-56. https://doi.org/10.1016/j.jma.2020.08.016
» https://doi.org/10.1016/j.jma.2020.08.016 -
13 Song GL. Corrosion prevention of magnesium alloys: a volume in woodhead publishing series in metals and surface engineering. USA: Elsevier Ltd; 2013. Corrosion behavior and prevention strategies for magnesium (Mg) alloys. p. 3-37. https://doi.org/10.1533/9780857098962.1.3
» https://doi.org/10.1533/9780857098962.1.3 -
14 Heidarzadeh A, Mironov S, Kaibyshev R, Çam G, Simar A, Gerlich A, et al. Friction stir welding/processing of metals and alloys: a comprehensive review on microstructural evolution. Prog Mater Sci. 2021;117:100752. https://doi.org/10.1016/j.pmatsci.2020.100752
» https://doi.org/10.1016/j.pmatsci.2020.100752 -
15 Zengin H, Turen Y. Effect of Y addition on microstructure and corrosion behavior of extruded Mg–Zn–Nd–Zr alloy. J Magnes Alloy. 2020;8(3):640-53. https://doi.org/10.1016/j.jma.2020.06.004
» https://doi.org/10.1016/j.jma.2020.06.004 -
16 Zengin H. Microstructure, corrosion and mechanical properties of magnesium alloys. Metals (Basel). 2023;13(9):1596. https://doi.org/10.3390/met13091596
» https://doi.org/10.3390/met13091596 -
17 Tian Y, Yang Z, Wang J, Zhang C, Xue C, Su H, et al. Designing ultra-high corrosion resistance Mg alloys by passivating cathodic activity and promoting RE oxide films. Corros Sci. 2025;257:113312. https://doi.org/10.1016/j.corsci.2025.113312
» https://doi.org/10.1016/j.corsci.2025.113312 -
18 Jiao ZJ, Yu C, Wang XM, Zhou YF, Guo L, Xia Y, et al. Corrosion resistance enhanced by an atomic layer deposited Al2O3/micro-arc oxidation coating on magnesium alloy AZ31. Ceram Int. 2024;50(3):5541-51. https://doi.org/10.1016/j.ceramint.2023.11.309
» https://doi.org/10.1016/j.ceramint.2023.11.309 -
19 Ansari N, Sarvesha R, Lee SY, Singh SS, Jain J. Influence of yttrium addition on recrystallization, texture and mechanical properties of binary Mg–Y alloys. Mater Sci Eng A. 2020;793:793. https://doi.org/10.1016/j.msea.2020.139856
» https://doi.org/10.1016/j.msea.2020.139856 -
20 Wang J, Song P, Gao S, Wei Y, Pan F. Influence of Y on the phase composition and mechanical properties of as-extruded Mg-Zn-Y-Zr magnesium alloys. J Mater Sci. 2012;47(4):2005-10. https://doi.org/10.1007/s10853-011-5998-2
» https://doi.org/10.1007/s10853-011-5998-2 -
21 Li Z, Peng Z, Qiu Y, Qi K, Chen Z, Guo X. Study on the treatment to improve the microstructure and corrosion behavior of ZK60 magnesium alloy. J Mater Res Technol. 2020;9(5):11201-19. https://doi.org/10.1016/j.jmrt.2020.08.004
» https://doi.org/10.1016/j.jmrt.2020.08.004 -
22 Liu X, Shan D, Song Y, Han E. Influence of yttrium element on the corrosion behaviors of Mg–Y binary magnesium alloy. J Magnes Alloy. 2017;5(1):26-34. https://doi.org/10.1016/j.jma.2016.12.002
» https://doi.org/10.1016/j.jma.2016.12.002 -
23 Coy AE, Viejo F, Skeldon P, Thompson GE. Susceptibility of rare-earth-magnesium alloys to micro-galvanic corrosion. Corros Sci. 2010;52(12):3896-906. https://doi.org/10.1016/j.corsci.2010.08.006
» https://doi.org/10.1016/j.corsci.2010.08.006 -
24 Akbari M, Abdollahzadeh A, Kazemi MA, Esfandiar M. A review of friction stir-based techniques for magnesium alloys: Welding, processing, recycling, and additive manufacturing. J Mater Res Technol. 2026;42:7449-98. https://doi.org/10.1016/j.jmrt.2026.05.068
» https://doi.org/10.1016/j.jmrt.2026.05.068 -
25 Sharma GK, Kumar K, Grewal NS. Microstructure Refinement and Augmenting Mechanical Properties of Mg Alloy Using Friction Stir Processing. J Mater Eng Perform. 2025;34(4):3391-406. https://doi.org/10.1007/s11665-024-09311-y
» https://doi.org/10.1007/s11665-024-09311-y -
26 Najar FA, Rathee S, Srivastava M. Recent advances in friction stir processing of magnesium alloys: microstructure, properties, and applications. Met Mater Int. 2026;32(6):1837-64. https://doi.org/10.1007/s12540-025-02092-6
» https://doi.org/10.1007/s12540-025-02092-6 -
27 Buzolin RH, Mohedano M, Mendis CL, Mingo B, Tolnai D, Blawert C, et al. Corrosion behaviour of as-cast ZK40 with CaO and Y additions. Trans Nonferrous Met Soc China. 2018;28(3):427-39. https://doi.org/10.1016/S1003-6326(18)64676-X
» https://doi.org/10.1016/S1003-6326(18)64676-X - 28 ASTM: American Society for Testing and Materials. ASTM: Standard Practice for Laboratory Immersion Corrosion Testing of Metals, G31-72. Annual Book of ASTM 19428. West Conshohocken: ASTM; 1999.
-
29 Song Y, Shan D, Chen R, Han EH. Effect of second phases on the corrosion behaviour of wrought Mg-Zn-Y-Zr alloy. Corros Sci. 2010;52(5):1830-7. https://doi.org/10.1016/j.corsci.2010.02.017
» https://doi.org/10.1016/j.corsci.2010.02.017 -
30 Xie GM, Ma ZY, Geng L, Chen RS. Microstructural evolution and mechanical properties of friction stir weded Mg-Zn-Y-Zr alloy. Mater Sci Eng A. 2007;471(1-2):63-8. https://doi.org/10.1016/j.msea.2007.03.041
» https://doi.org/10.1016/j.msea.2007.03.041 -
31 Ahmadkhaniha D, Fedel M, Heydarzadeh Sohi M, Deflorian F. Corrosion behavior of severely plastic deformed magnesium based alloys: a review. Surg Eng Appl Electrochem. 2017;53(5):439-48. https://doi.org/10.3103/S1068375517050039
» https://doi.org/10.3103/S1068375517050039 -
32 da Silva EP, Buzolin RH, Alfaro U, Requena G, Pinto HC. Microstructure and mechanical behavior of similar butt-joints of ZK60 and ZK60–1.5RE magnesium alloys produced by linear friction stir welding. J Magnes Alloy. 2021;9(5):1782-96. https://doi.org/10.1016/j.jma.2021.04.012
» https://doi.org/10.1016/j.jma.2021.04.012 -
33 da Silva EP, Oliveira VB, Pereira VF, Maluf O, Buzolin RH, Pinto HC. Microstructure and residual stresses in a friction stir welded butt joint of as-cast ZK60 alloy containing rare earths. Mater Res. 2017;20(3):775-9. https://doi.org/10.1590/1980-5373-mr-2016-0899
» https://doi.org/10.1590/1980-5373-mr-2016-0899 -
34 Cai S, Lei T, Li N, Feng F. Effects of Zn on microstructure, mechanical properties and corrosion behavior of Mg-Zn alloys. Mater Sci Eng C. 2012;32(8):2570-7. https://doi.org/10.1016/j.msec.2012.07.042
» https://doi.org/10.1016/j.msec.2012.07.042 -
35 Seifiyan H, Heydarzadeh Sohi M, Ansari M, Ahmadkhaniha D, Saremi M. Influence of friction stir processing conditions on corrosion behavior of AZ31B magnesium alloy. J Magnes Alloy. 2019;7(4):605-16. https://doi.org/10.1016/j.jma.2019.11.004
» https://doi.org/10.1016/j.jma.2019.11.004 -
36 Curioni M, Scenini F, Monetta T, Bellucci F. Correlation between electrochemical impedance measurements and corrosion rate of magnesium investigated by real-time hydrogen measurement and optical imaging. Electrochim Acta. 2015;166:372-84. https://doi.org/10.1016/j.electacta.2015.03.050
» https://doi.org/10.1016/j.electacta.2015.03.050 -
37 Curioni M. The behaviour of magnesium during free corrosion and potentiodynamic polarization investigated by real-time hydrogen measurement and optical imaging. Electrochim Acta. 2014;120:284-92. https://doi.org/10.1016/j.electacta.2013.12.109
» https://doi.org/10.1016/j.electacta.2013.12.109 -
38 Liu M, Schmutz P, Uggowitzer PJ, Song G, Atrens A. The influence of yttrium (Y) on the corrosion of Mg-Y binary alloys. Corros Sci. 2010;52(11):3687-701. https://doi.org/10.1016/j.corsci.2010.07.019
» https://doi.org/10.1016/j.corsci.2010.07.019 -
39 Bahmani A, Lotfpour M, Taghizadeh M, Kim WJ. Corrosion behavior of severely plastically deformed Mg and Mg alloys. J Magnes Alloy. 2022;10(10):2607-48. https://doi.org/10.1016/j.jma.2022.09.007
» https://doi.org/10.1016/j.jma.2022.09.007 -
40 Torbati-Sarraf H, Torbati-Sarraf SA, Poursaee A, Langdon TG. Electrochemical behavior of a magnesium ZK60 alloy processed by high-pressure torsion. Corros Sci. 2019;154:90-100. https://doi.org/10.1016/j.corsci.2019.04.006
» https://doi.org/10.1016/j.corsci.2019.04.006 -
41 Jiang P, Blawert C, Hou R, Scharnagl N, Bohlen J, Zheludkevich ML. Microstructural influence on corrosion behavior of MgZnGe alloy in NaCl solution. J Alloys Compd. 2019;783:179-92. https://doi.org/10.1016/j.jallcom.2018.12.296
» https://doi.org/10.1016/j.jallcom.2018.12.296 -
42 Cao F, Song GL, Atrens A. Corrosion and passivation of magnesium alloys. Corros Sci. 2016;111:835-45. https://doi.org/10.1016/j.corsci.2016.05.041
» https://doi.org/10.1016/j.corsci.2016.05.041 -
43 Olugbade TO, Omiyale BO, Ojo OT. Corrosion, corrosion fatigue, and protection of magnesium alloys: mechanisms, measurements, and mitigation. J Mater Eng Perform. 2022;31(3):1707-27. https://doi.org/10.1007/s11665-021-06355-2
» https://doi.org/10.1007/s11665-021-06355-2 -
44 Song G, Atrens A. Understanding magnesium corrosion: a framework for improved alloy performance. Adv Eng Mater. 2003;5(12):837-58. https://doi.org/10.1002/adem.200310405
» https://doi.org/10.1002/adem.200310405 -
45 Zhang Y, Gao Y, Shao D, Liang J. Simultaneously optimizing mechanical properties and corrosion resistance of magnesium-yttrium alloy via adding calcium and rolling at low temperature. J Alloys Compd. 2025;1039:183046. https://doi.org/10.1016/j.jallcom.2025.183046
» https://doi.org/10.1016/j.jallcom.2025.183046


