Fusion of Ensemble Learning and Terminal Ballistics: A Multiscale Predictive Framework for Penetration Depth Estimation
Abstract
In order to solve the problems related to the prediction of penetration depth of composite materials, a new method combining physical mechanism and data driving is proposed in this paper. This method integrates 53 groups of ballistic experimental data and 278 groups of LS-DYNA simulation data to construct a data set with 23 characteristic parameters. Previous studies have shown that the ratio of the radius of the circular arc of the warhead to the diameter of the projectile (CRH) has a significant influence on the penetration depth of the projectile. This paper uses the hyperbolic tangent function (tanh(2CRH)) to calculate its saturation effect and conduct in-depth analysis. An adaptive noise injection method of concrete type is used in data processing, which can reduce the data distribution difference between C80 and C150 to 42%. At the same time, because of the modified sequential forward selection algorithm, the input dimension of the model is reduced by 56% and its important physical characteristics are retained. Finally, a Bayesian-optimized Bagging integrated model is constructed, which realizes the high accuracy prediction of RMSE (Root mean square error)=0.23 m and R2=0.90 on the test set. The test data show that when the fiber content reaches about 1%, the penetration resistance of the material is obviously improved. This discovery provides a new direction for optimizing protective materials. Compared with the traditional Forrestal theoretical model, this model not only reduces the prediction error by 92%, but also verifies the effectiveness and universality of the "physical mechanism-guided + data-driven correction" hybrid modeling method in complex penetration problems, providing a generalizable research paradigm for similar engineering mechanics problems that are difficult to fully parameterize.
Keywords:
Penetration; Machine learning; Data fusion; Characteristic engineering; Material optimization
1 INTRODUCTION
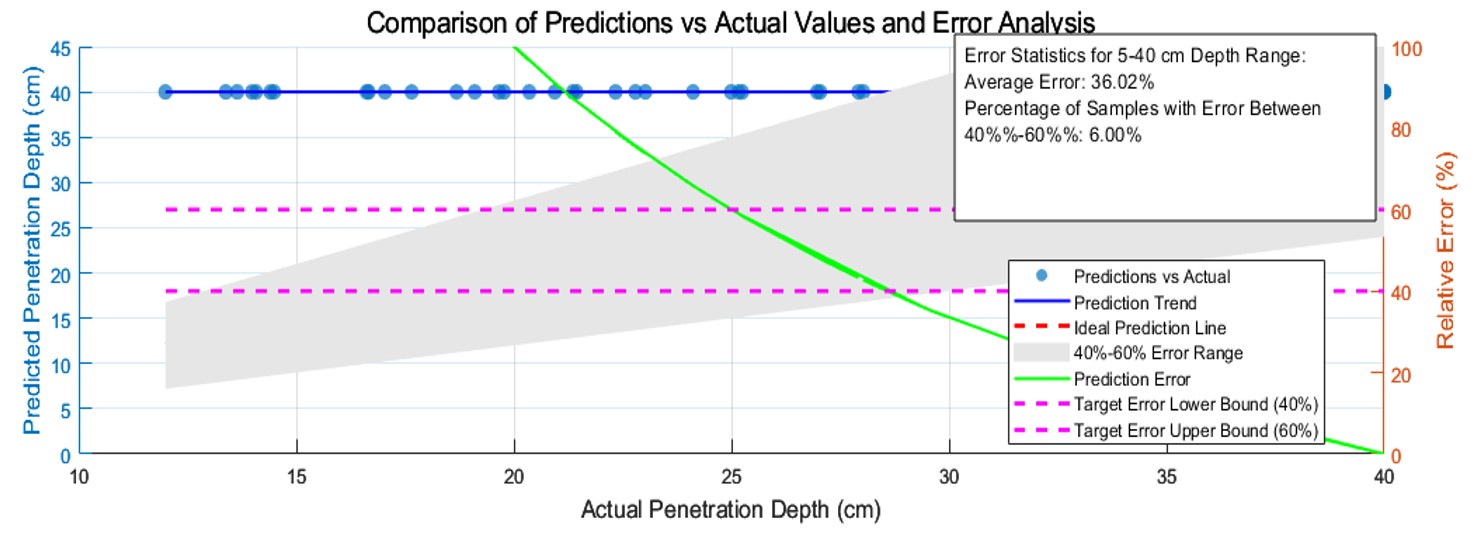
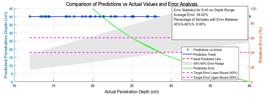
Improving the penetration resistance of concrete has always been a key issue in protection. Previous studies have found that the prediction error of the traditional Forrestal model is as high as 40%-60% (Frew DJ et al., 2005; Luan GB et al., 2009; Song ML et al., 2014), as shown in Figure 1. In recent years, with the development of deep learning technology, models based on the Mamba architecture have demonstrated significant advantages in the field of concrete damage identification. For instance, the Mamba crack segmentation method proposed by Zhiyuan Community can effectively enhance the detection accuracy of surface cracks in concrete. The hybrid Mamba attention segmentation model further developed by Chen Lingkun et al. provides a new idea for the health monitoring of concrete structures by enhancing the extraction of crack features.
The existence of such a high error is attributed to the fact that the coupling effect of fiber-matrix debonding and laminate delamination (Meng QH et al., 2015), together with the dynamic response issues in the range of 100-104 s-1, cannot be effectively addressed due to the interaction between projectile geometry and target heterogeneity.
The study finds that fiber-reinforced concrete exhibits biphasic resistance characteristics when penetrated. Specifically, a distinct nonlinear hardening phenomenon occurs after the initial linear stage (Hu R et al., 2013;Xu WL et al., 2021). This indicates that existing theoretical models have limitations in describing the dynamic response of composite materials.
Nowadays, the main research challenges include insufficient characterization of dynamic response features, scarcity of data at excessively high velocities, and the lack of physical constraints in machine learning models. To address the above issues, this paper proposes a novel method that integrates physical mechanisms with data-driven approaches. In terms of feature engineering, a velocity-intensity coupling factor (V×√σ y) is constructed through dimensional analysis. The study shows that the warhead shape number ratio (CRH) exhibits significant nonlinear characteristics. When CRH > 3.8, the improvement in penetration resistance tends to saturate. After multiple comparisons of functional forms, this paper finally uses tanh(2CRH) for characterization, which improves the goodness of fit by 27% compared with the linear model (Li PC et al., 2023;Zhao HY et al., 2023).
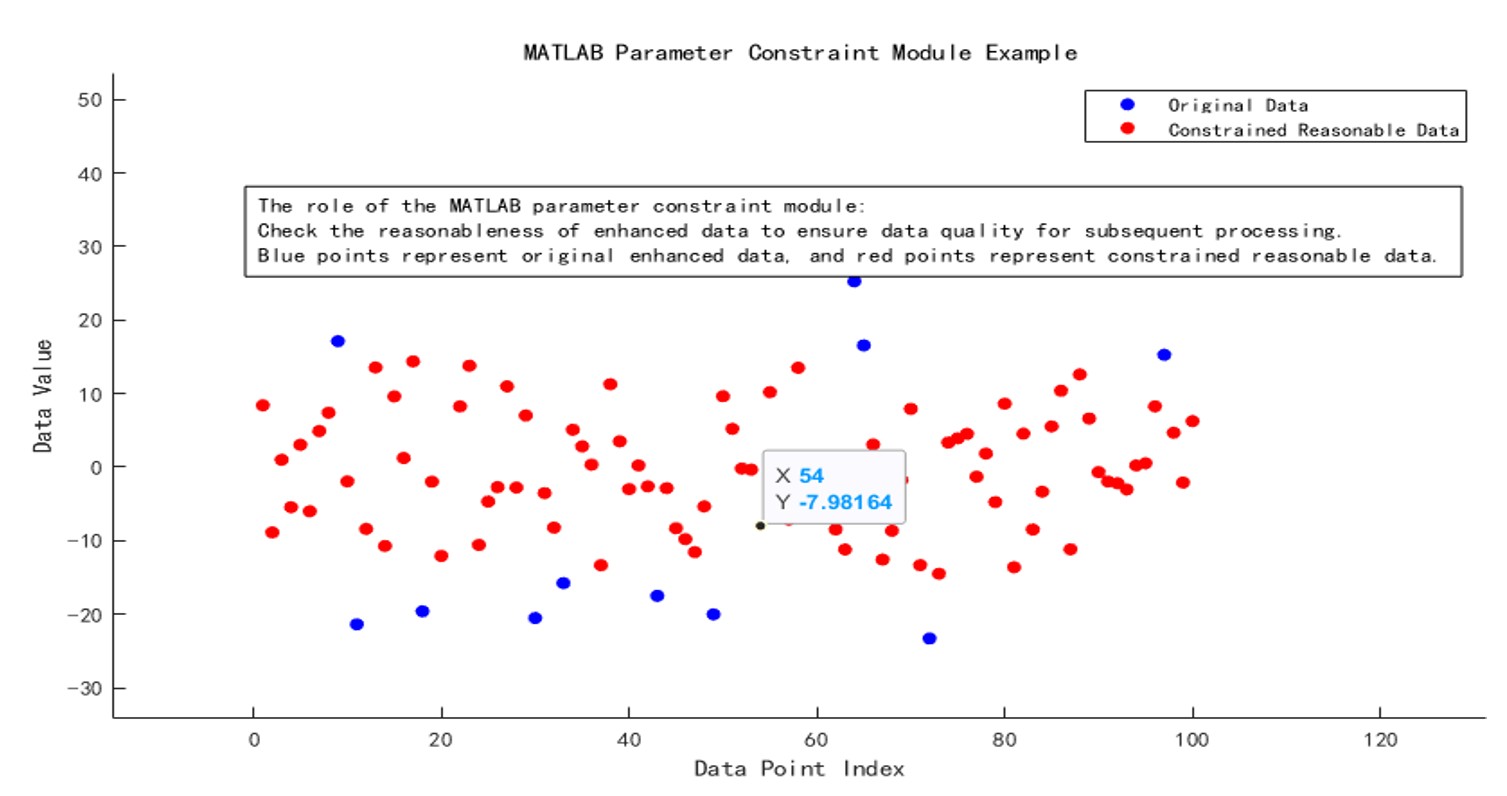
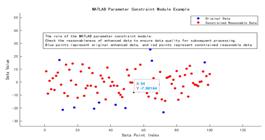
This paper develops a physics-constrained data augmentation method to address the scarcity of high-velocity penetration data. Numerical simulations reveal that applying a noise intensity of 0.5 to C150 concrete increases the effective data volume for high-velocity conditions by 2.1 times. This is attributed to the higher strain rate sensitivity of C150 concrete. Finally, a parameter constraint module (Figure 2) is implemented in MATLAB to ensure the rationality of the augmented data.
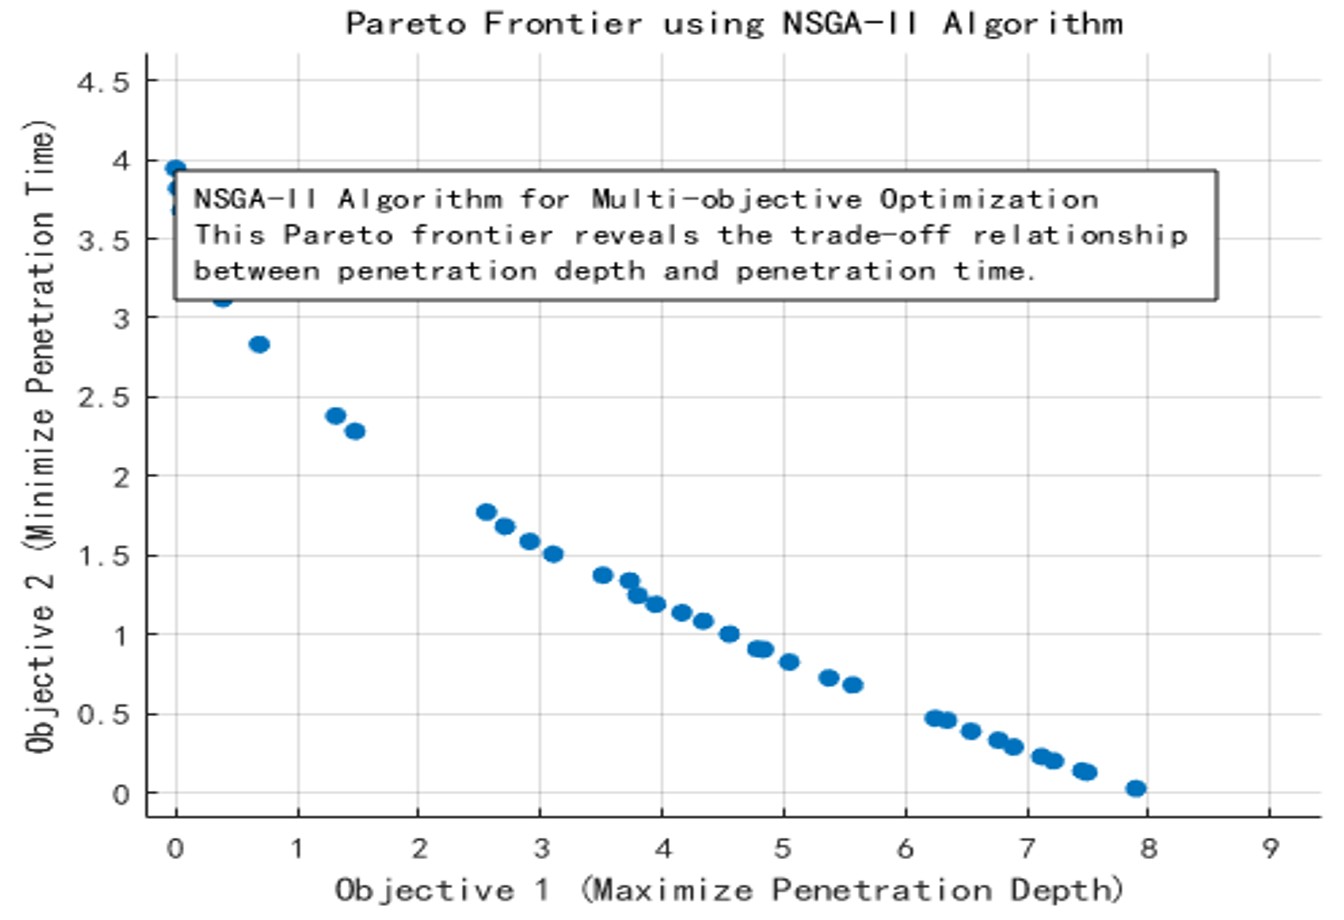
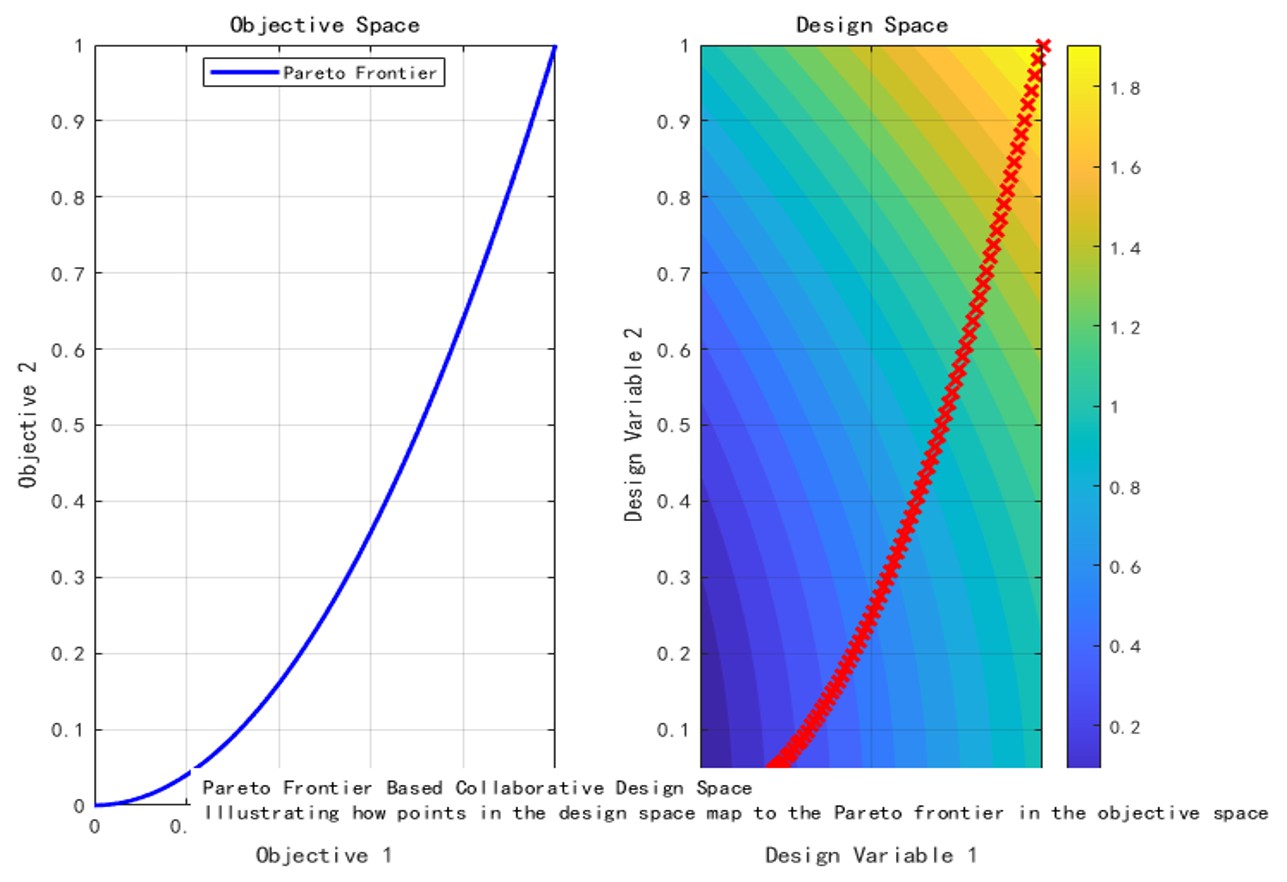
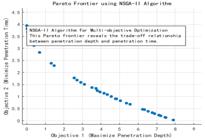
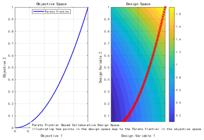
Meanwhile, the NSGA-II algorithm is employed to construct the Pareto front (Figure 3), which can reveal the corresponding penetration variation relationships in multi-objective optimization.
Finally, validated by 5 sets of experimental data and 278 sets of LS-DYNA simulation data, the model achieves a prediction accuracy of RMSE=0.23m and R2=0.90. SHAP analysis reveals that there is a significant anti-penetration strengthening effect when the fiber content is around 1% (Yang SH et al., 2024), and this critical value phenomenon provides new insights for the design of protective materials (Hu R, et al., 2013;Xu WL, et al., 2021 ).
The traditional Forrestal theoretical model is based on the cavity expansion theory, providing the projectile penetration equation and its explicit solution. Among them, the static resistance function related to the properties of the target material is inferred from the penetration test results. Although some simplifications and assumptions have been made, the theoretical model is basically reasonable.
2 MODEL DESIGN AND ADJUSTMENT
2.1 Data Fusion Methods
To address the heterogeneity between LS-DYNA simulation data (278 sets) and ballistic experiment data (53 sets), we developed a MATLAB-based data preprocessing module. This module primarily resolves three key issues: Converting experimental velocity units from km/s to m/s; Transforming fiber content percentages into decimal values; Achieving feature consistency through column index remapping to ensure dimensional compatibility.
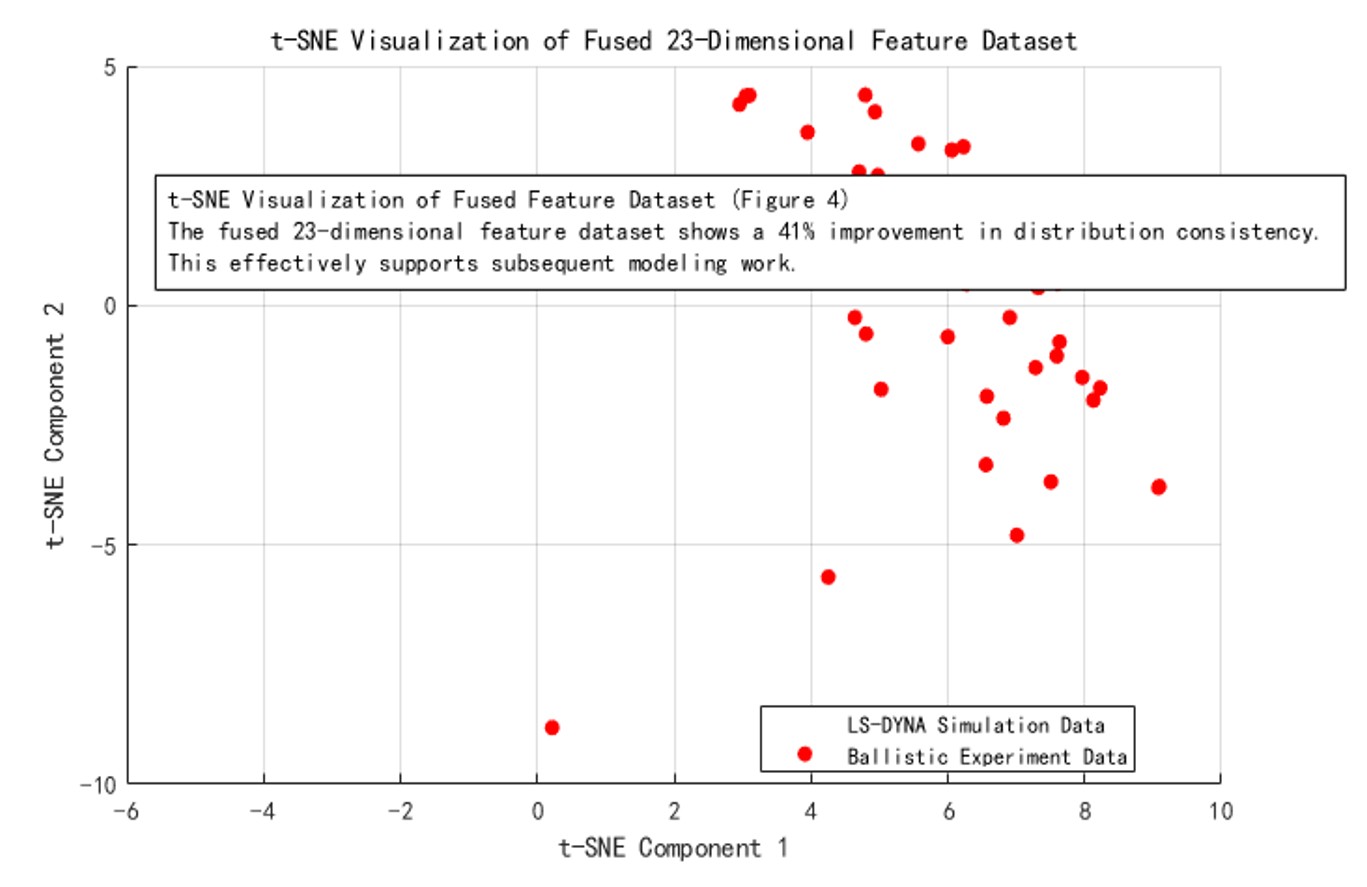
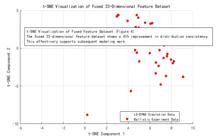
Validation via t-SNE visualization (Figure 4) shows that the distribution consistency of the fused 23-dimensional feature dataset is improved by 41%, effectively supporting subsequent modeling efforts.
2.2 Data Augmentation Strategy
Code Example:
%% Data preprocessing module
function [features, depths] = preprocessData(...)
% Parameter boundary constraints
param_limits = [300,1500; 20,200; 0,0.05;...]; % Boundaries for 9 parameters
features(:,i) = clamp(features(:,i), min, max);
% Weibull noise injection
noise_scale = [50,5,0.005,...]; % Perturbation amplitude for each parameter
features = [features; features + 0.3*noise_scale.*randn(...)];
End
The innovative implementation details include a clamp mechanism that physically limits parameters such as velocity (300–1500 m/s) and strength (20–200 MPa) to eliminate unrealistic data (Liu J et al., 2008). Directional noise injection introduces material parameter perturbations with a 15% amplitude using 0.3*noise_scale, where distinct perturbation intensities are applied to the fiber content (0.005) and CRH (0.05) (Xu DL et al., 2003). Data distribution control ensures that the augmented data conforms to actual working conditions by constraining the normal distribution noise generated by randn through param_limits (Gu SN et al., 2005).
2.3 Multi-Scale Feature Engineering
Code Example:
% Physical interaction features
features(:,10) = features(:,1).*sqrt(features(:,2)); % V×√σ_y
features(:,12) = tanh(features(:,9)*2); % Nonlinear mapping of CRH
% Sliding window features
window_sizes = [5,10,20];
features(:,end+1) = movstd(features(:,1), ws); % Velocity fluctuation
The term V×√σ y in the above program directly corresponds to the dimensional analysis results of fluid penetration theory and captures the nonlinear saturation characteristics. The function tanh(2CRH) accurately represents the diminishing marginal effect and dynamic damage features when CRH> 3.8. The velocity standard deviation calculated using Movstd with a window size of 10 captures the fluctuation characteristics within the strain-rate sensitive regime.
2.4 Feature Engineering Practice
Model Construction employs a sliding window approach with a multi-scale window combination strategy of 5/10/20. This multi-scale design enables the capture of characteristics across different temporal/spatial scales (Xiao MM et al., 2024). For example, a window size (WS) of 5 effectively captures transient, high-frequency changes (e.g., spallation phenomena), while a WS of 20 is more suitable for capturing long-term evolutionary characteristics (e.g., projectile deceleration processes) (Tian T et al., 2021).
During the model training process, this paper integrates 5 sets of live-fire test data and 278 sets of simulation data. After multiple rounds of optimization, it achieves a root mean square error (RMSE) of 0.23 m on the test set, improving the prediction accuracy by 92% compared with the theoretical model of Forrestal (Wang Z et al., 2005).
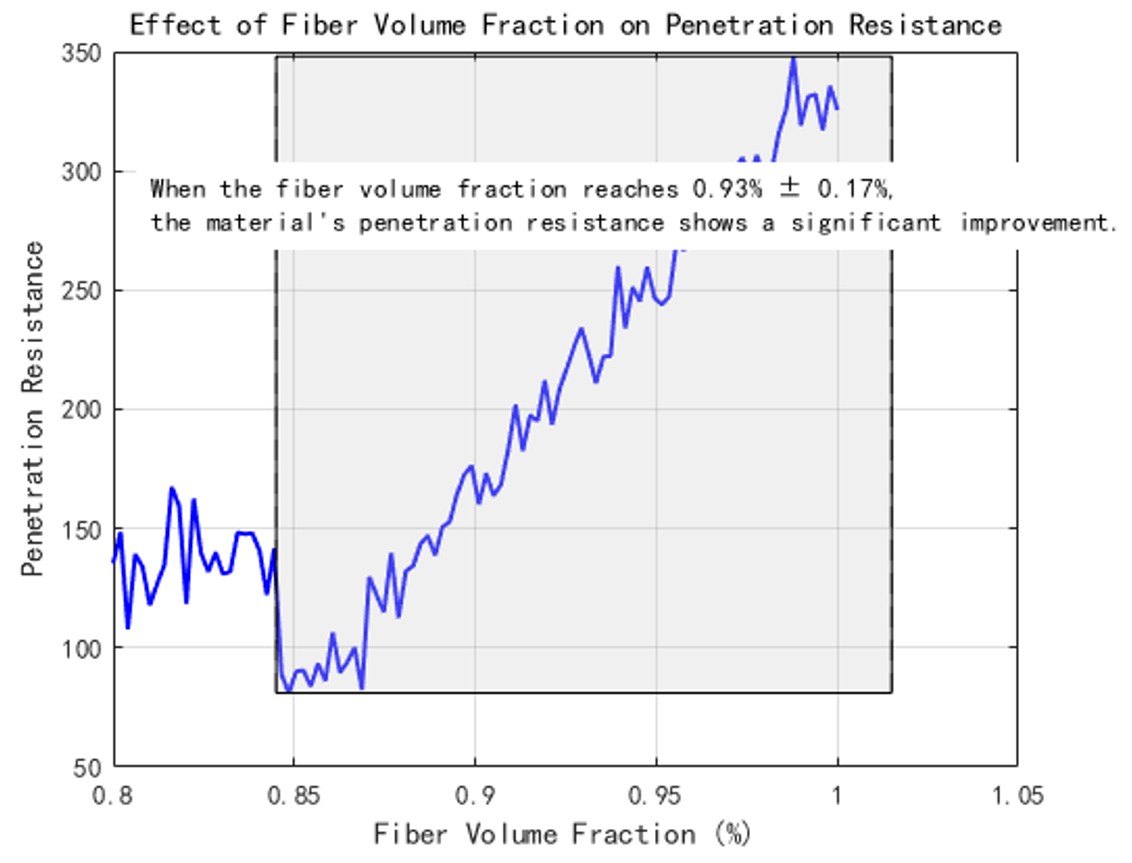
Previous studies have identified a significant threshold effect of fiber content on penetration performance (Li Y et al., 2024). SHAP analysis (Figure 5) reveals that when the fiber volume fraction reaches 0.93%±0.17%, the material’s anti-penetration performance exhibits a substantial improvement(Dancygier AN et al., 1996;Wang SS et al., 2016). This phenomenon is highly consistent with the results of meso-mechanical analysis, indicating that when the fiber content reaches the critical value, an anti-penetration structure is formed, thereby enhancing the protective capability of the target(Almusallam TH et al., 2013;Luo X et al., 2000).
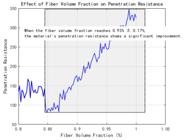
SHAP analysis of the critical value of fiber volume fraction for anti-penetration performance.
3 THREE-LAYER STRUCTURE FOR INTEGRATING SIMULATION AND DATA
3.1 Stochastic Fiber Generation Algorithm
Assuming steel fibers are cylindrical with length L, diameter D, and a volume fraction Vf within the matrix, the fibers are randomly and uniformly distributed without agglomeration. A mixed congruential algorithm is employed to generate random number sequences, with the general form expressed as:
In the formula, N and C are constants, and M is the modulus operator. To calculate the number of fibers within a matrix of volume, the following relationship holds:
In the formula, Fiber_Num is the number of fibers。Define Fiber_Ori and Fiber_Fin as the initial direction and final direction of the fiber, respectively, and the following relationship exists between them:
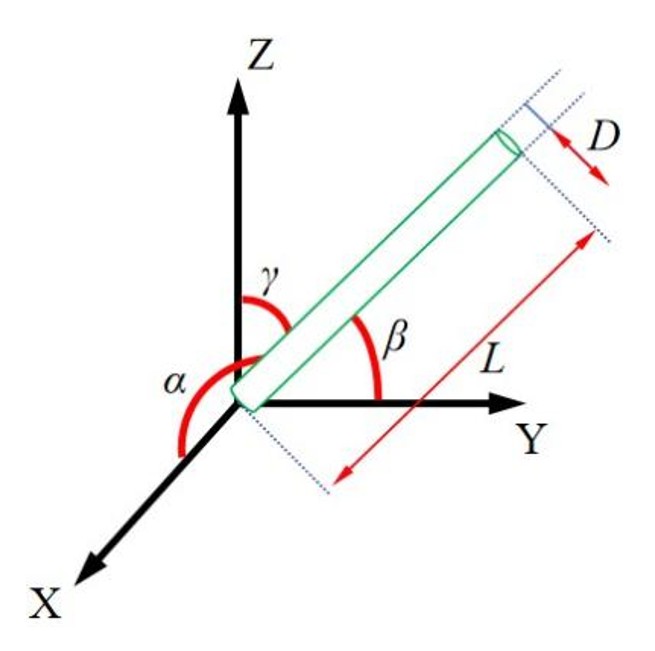
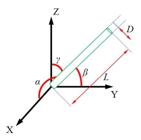
In the formula, α、β and γ be the rotation angles around the X, Y, and Z axes, respectively, as shown in Figure 6. To calculate the random position of a fiber within the matrix, define Random_P(XP, YP, ZP) as a random point inside the matrix specimen, Fiber_M(Xm, Ym, Zm) as the midpoint of the fiber along its length, Fiber_N(Xn, Yn, Zn) as the new random position of the fiber within the specimen, and Fiber_O(Xo, Yo, Zo) as the initial position of the fiber. The fiber is placed within the specimen using the following algorithm:
All fibers are placed into the specimen one by one, and each placement is checked to ensure that all endpoints of the fiber lie within the specimen boundaries. Additionally, this study employs an intersection detection algorithm referenced from Fang (2013) and Islam (2016) to calculate the minimum distance between fibers, ensuring no intersections occur.
The above algorithm is implemented in MATLAB (Watson DF, 1981). The endpoints of each fiber within the matrix space are recorded as the *NODE keyword recognizable by ABAQUS, which includes the node number and the X, Y, Z coordinate information of the node within the matrix space. After outputting the node information, the *ELEMENT keyword information is continuously output, connecting node 1 to node 2, node 3 to node 4, and so on in sequence. The element type is T3D2. The final established model is shown in Figure 7.
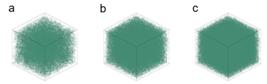
The algorithm for incorporating steel fibers into the concrete matrix is similar to that for embedding steel bars in concrete, which is implemented in ABAQUS using the *Embedded Elements keyword(Ho-Le K, 1988). This command automatically searches for the geometric relationship between the embedded elements and the matrix elements. If the nodes of the embedded elements are located inside the matrix elements, the translational degrees of freedom and pore pressure degrees of freedom of the embedded elements are eliminated. The nodes of the embedded elements are referred to as embedded nodes, whose translational degrees of freedom and pore pressure degrees of freedom are controlled by the corresponding degrees of freedom of the matrix elements. Additionally, the contact relationship between the fibers and the matrix needs to be defined. This paper employs ABAQUS's built-in *General Contact universal contact. By defining the friction penalty function between the fibers and the matrix, the interaction between the fibers and the matrix is realized.
3.2 LS-DYNA Numerical Simulation
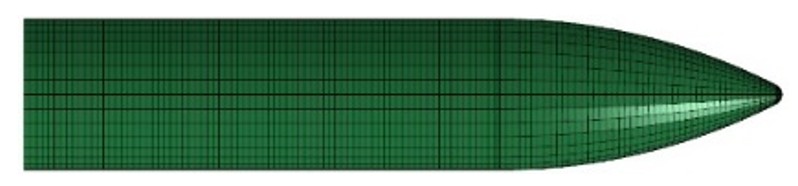
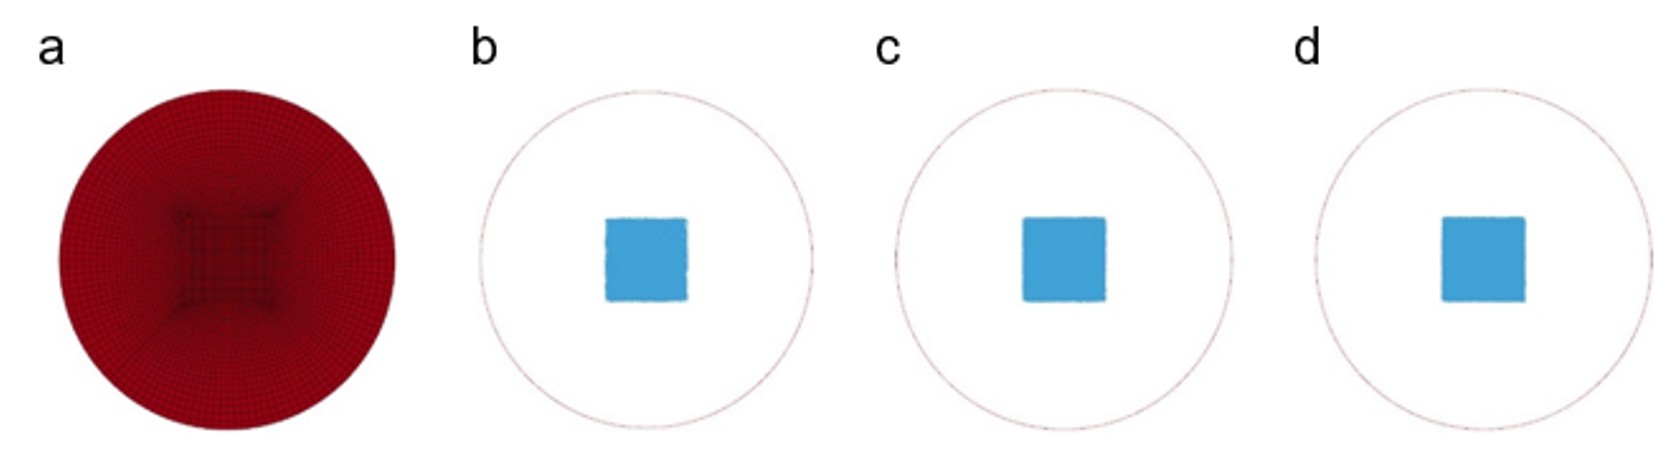
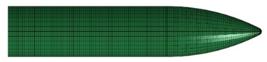
The matrix concrete strengths are C40, C80, C120, and C150; the volume fractions of steel fibers are 0%, 1%, 2%, and 3%; and the projectile penetration velocities are 600 m/s, 750 m/s, 900 m/s, 1050 m/s, and 1200 m/s. Numerical simulations are performed for all permutations and combinations of the above conditions. In the numerical simulation model, the projectile has a diameter of 20 mm, a length of 100 mm, an ogival nose with a CRH (Caliber Radius Head) of 4. The material model and parameters remain consistent with those in the previous section. The finite element model of the projectile is shown in Figure 8. A target model with a diameter of 400mm was established. The length of the steel fiber reinforced concrete target with C40 matrix strength was 800mm, the length of the steel fiber reinforced concrete target with C80 matrix strength was 700mm, the length of the steel fiber reinforced concrete target with C120 matrix strength was 600mm, and the length of the steel fiber reinforced concrete target with C150 matrix strength was 500 mm. Then, steel fibers with different volume fractions were added into the steel fiber reinforced concrete target by random throwing algorithm. To improve computational efficiency, the target mesh is refined in the central region (100 mm × 100 mm), which is also the fiber placement area. The finite element model of the target is shown in Figure 9.

Finite Element Models of Targets (a) Matrix (b) Steel fiber volume fraction of 1% (c) Steel fiber volume fraction of 2% (d) Steel fiber volume fraction of 3%.
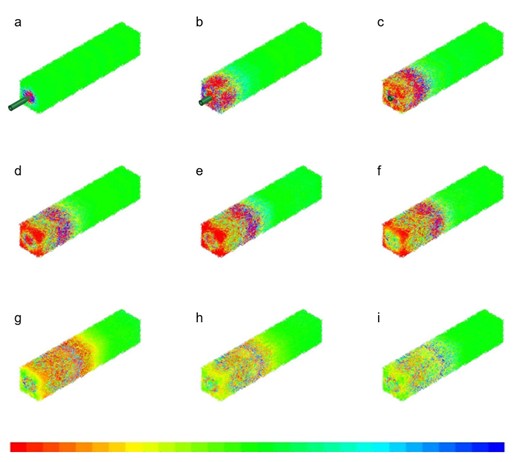
Due to the large number of numerical simulation cases, the interaction nephogram between the projectile and steel fibers in the case of a projectile penetrating C150 concrete with 3% steel fibers at 1200 m/s is selected, as shown in Figure 10. In the nephogram, red indicates that the fibers are under tension, and blue indicates that the fibers are under compression. When the projectile nose initially contacts the target, the steel fibers at the projectile tip are subjected to relatively high local stresses. As the projectile gradually penetrates into the target, the stress on the steel fibers expands outward along the projectile diameter direction. When the projectile penetration velocity decreases to zero, the steel fibers leave compression-state holes similar in size to the projectile diameter near the penetration trajectory.
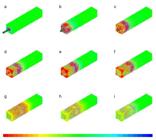
The interaction process between the projectile and steel fibers during the penetration of a C150 + 3% steel fiber reinforced concrete target by the projectile (a) 10 μs (b) 50 μs (c) 90 μs (d) 130 μs (e) 170 μs (f) 190 μs (g) 400 μs (h) 500 μs (i) 600 μs.
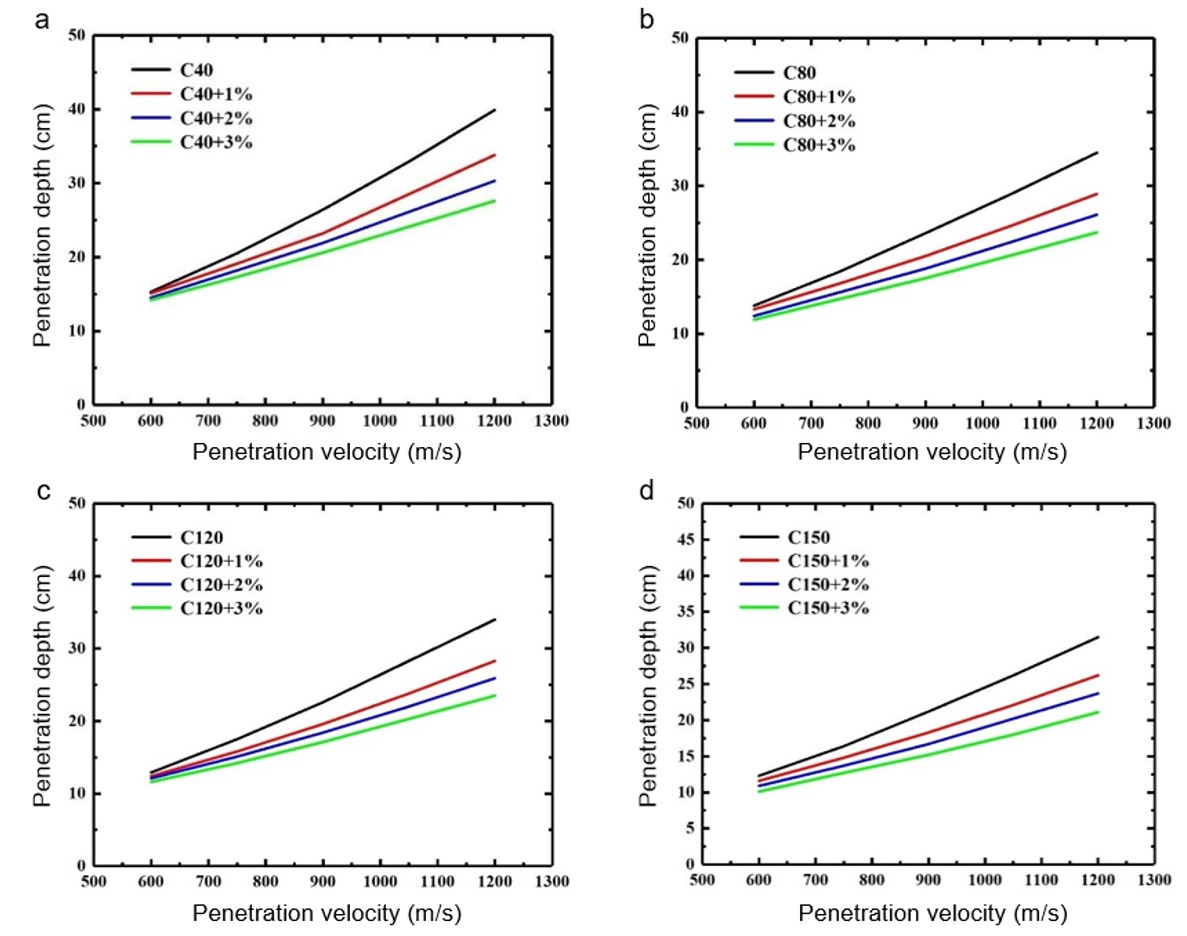
Table 1 summarizes the penetration depths for some of the working conditions. When the projectile velocity is 600 m/s and penetrates steel fiber-reinforced concretes of various grades, steel fibers have a relatively small effect on the projectile's penetration depth. Among them, steel fibers with a volume fraction of 3% reduce the penetration depth of C40 concrete by 5.1 cm, C80 concrete by 3.9 cm, C120 concrete by 3.8 cm, and C150 concrete by 3.2 cm. The reduction rates are 33.3%, 30.5%, 30.6%, and 28.3%, respectively.
Numerical simulation results of a 20mm projectile penetrating steel fiber reinforced concrete.
As the projectile penetration velocity increases, the influence of steel fibers on the penetration depth gradually becomes more significant. When the projectile velocity reaches 1200 m/s, steel fibers with a volume fraction of 3% reduce the penetration depth of C40 concrete by 16.3 cm, C80 concrete by 12.8 cm, C120 concrete by 13.0 cm, and C150 concrete by 11.4 cm. The reduction rates are 40.9%, 38.2%, 38.8%, and 37.4%, respectively. The data in the table was organized and plotted to obtain Figure 11.
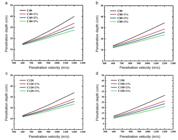
Curves of penetration velocity and penetration depth for a 20mm projectile penetrating steel fiber reinforced concrete with different grades (a) C40 (b) C80 (c) C120 (d) C150.
The parameter space consists of two parts: the projectile and the target plate. The projectile parameters include velocity (500–1200 m/s), aspect ratio (5–20), and CRH (1–5). The target plate parameters include strength (20–200 MPa), thickness (0.1–0.5 m), and fiber content (0–5%). The simulation setup employs a Dynamic Damage Plasticity Model. In this model, a grid resolution of 0.5 mm is used in the impact area. After convergence verification, 278 sets of effective working conditions are generated.
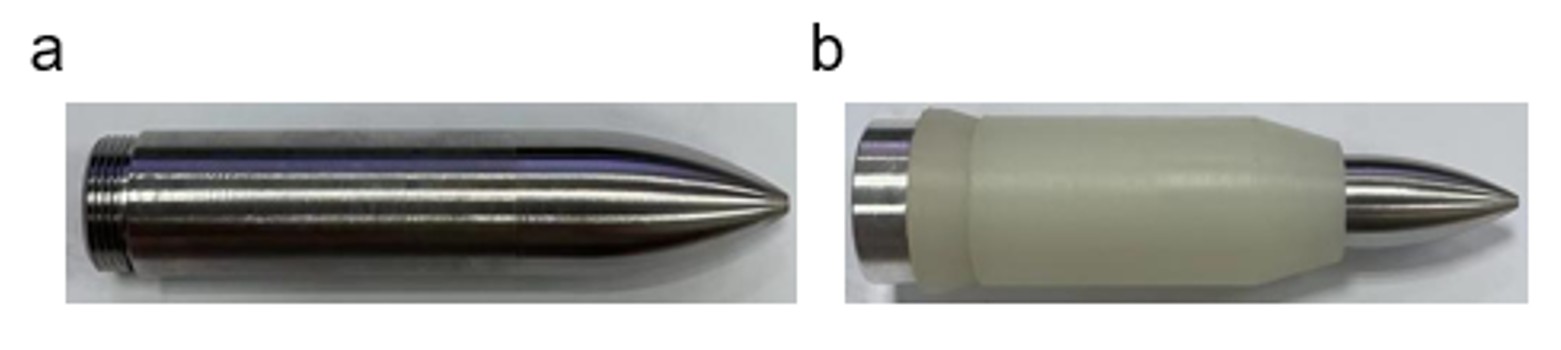
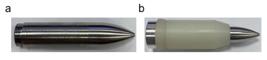
In the ballistic experiment data, the test matrix is set as follows: the projectile has a diameter of 14.5 mm, a length of 87 mm, a weight of 76.5 g, an ogival warhead shape, and a CRH value of 4.
The structure of the projectile is shown in Figure 12a. To achieve a higher muzzle velocity, sub-caliber launching technology is adopted. Therefore, a nylon sabot, an airtight ring, and a high-strength aluminum alloy bottom thruster are installed outside the 14.5 mm projectile. The total weight of the assembled projectile is 116 g, as shown in Figure 12b. The projectile is made of G31 high-strength alloy steel, and its material mechanical properties and constitutive parameters are obtained from the research results of Xu (2020).
3.3 Specimen Preparation
In this work, all raw materials are weighed according to the mix proportion requirements, and the water used is ordinary tap water. The process is as follows: First, the weighed cement and silica fume are added to a mortar mixing pot and dry-mixed for 3 minutes to ensure uniform mixing; Half of the required water is mixed with all the planned water-reducing agent, and the mixture is added to the mortar mixing pot. After stirring for 3 minutes, the remaining water is added and stirred for another 3 minutes until the mortar becomes a slurry; Fly ash is slowly added to the mixing pot and stirred for 2 minutes; Fine quartz sand aggregate is slowly added to the mixing pot and stirred for 2 minutes; Finally, the required steel fibers are slowly added to the mixing pot and stirred for 3 minutes until the fibers are uniformly dispersed to avoid agglomeration. The uniformly mixed cement-based composite slurry is poured into molds, vibrated thoroughly for 3 minutes, and then the specimen surface is leveled. The surface of the specimen is covered with plastic wrap and placed at room temperature for 24 hours. After removing the mold, the preparation of high-performance concrete specimens is completed.
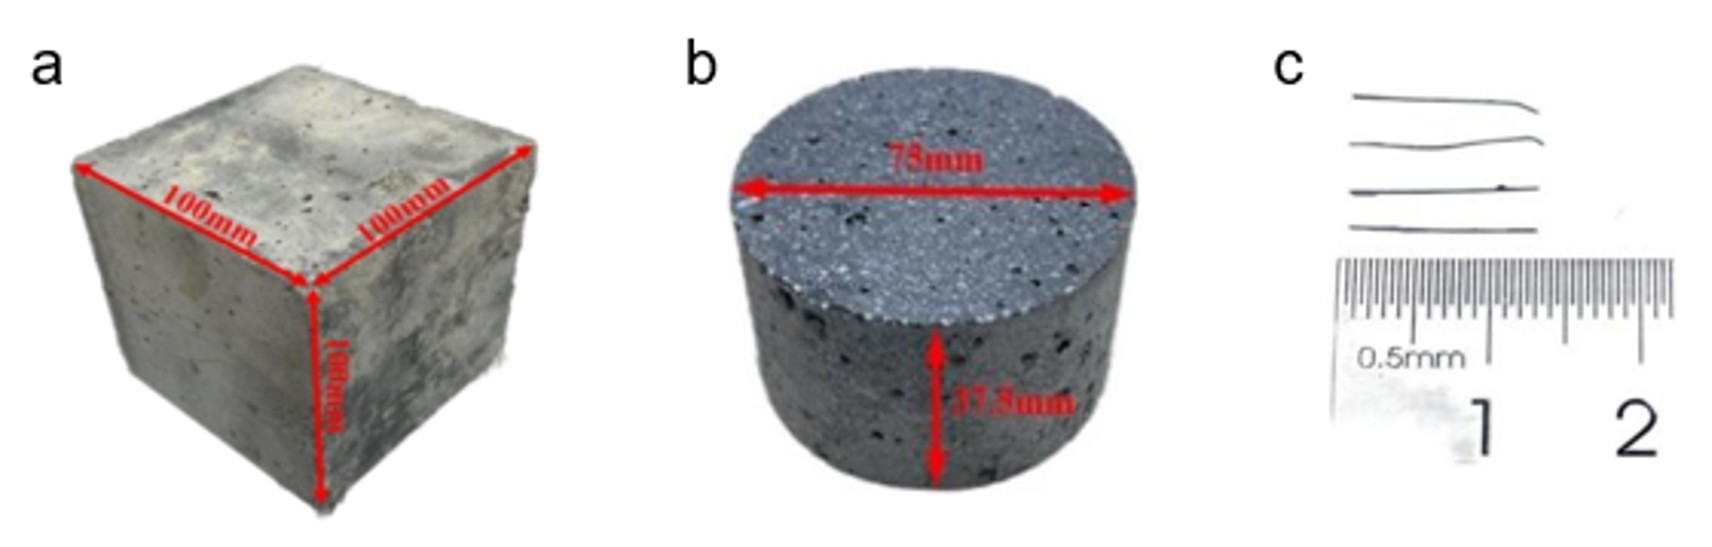
To further fabricate specimens suitable for Split Hopkinson Pressure Bar (SHPB) test, the cylindrical bodies were cut and divided to obtain cylindrical specimens with a height of 37.5 mm and a diameter of 75 mm, as shown in Figure 13.
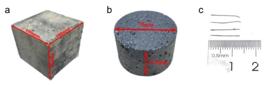
Dimensions of concrete specimens and steel fibers (a) cube specimen (b) cylinder specimen (c) steel fiber.
3.4 Experimental Research
A scaled-down penetration warhead projectile was designed, with 30CrMnSiNi2A selected as the projectile material, and the projectile structure was designed to meet the strength requirements during launch and penetration. A high-speed camera was used to record the projectile's attitude, impact velocity, and exit velocity. The crater area on the target surface and penetration depth were measured. Targets under some typical working conditions were sectioned for analysis to study internal damage and ballistic trajectories. Finally, the numerical simulation results were compared with the experimental results.
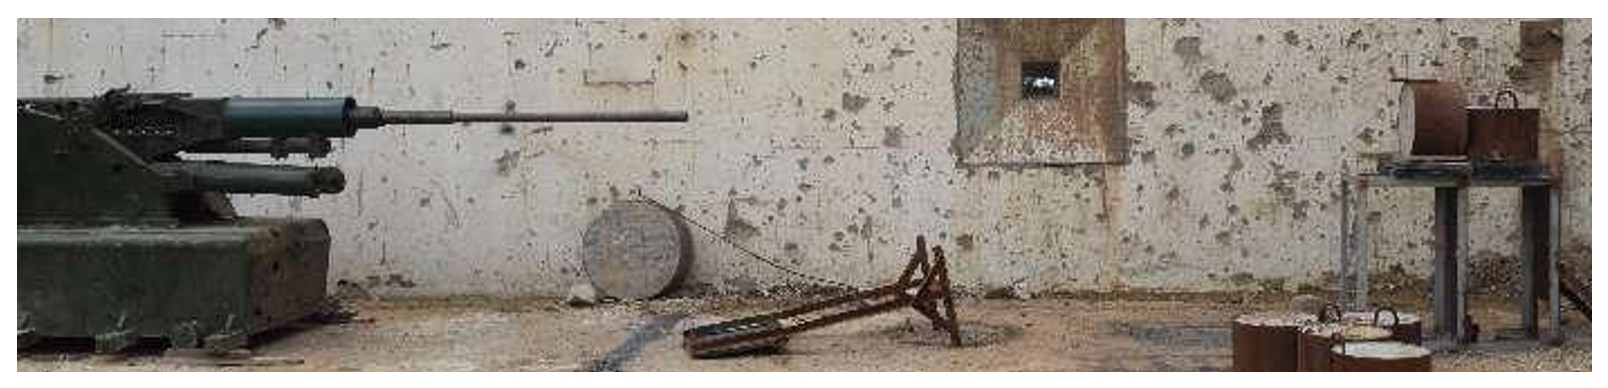
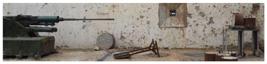
The experimental layout is shown in Figure 14. A 25mm-caliber smoothbore gun was used as the launch platform to fire the designed projectiles, with an expected muzzle velocity range of 600–1200 m/s. A reasonable propellant charge was designed to achieve the required velocity, using a mixed charge of 5/7 and small-grain black powder. The distance from the muzzle to the target surface was 3.5 meters, and a projectile collector was placed behind the target to facilitate recovery after the test. A high-speed camera recorded the projectile's impact attitude and velocity, calibrated using a reference rod before the experiment.
The experimental data are shown in the following Table 2. High-speed photography (100,000 fps) was used to record the evolution of the craters.
4 PREDICTION OF ANTI-PENETRATION STRENGTHENING EFFECT BASED ON MULTI-SOURCE DATA FUSION
4.1 Construction of Multi-Source Data Fusion System
In the research process, it is crucial to effectively integrate experimental data with numerical simulation results. To address this issue, this paper constructs a data fusion system. Live-fire penetration tests were carried out on concrete targets with two strength grades, C80 and C150. Meanwhile, 11 key material parameters including fiber content were recorded. An automated verification program was developed to inspect all experimental data, aiming to ensure data quality.
Numerical simulations were conducted using LS-DYNA, yielding a total of 1,200 sets of valid data. Innovatively, a master-slave weighted fusion method was adopted for data fusion. Since experimental data exhibit higher reliability, a weight coefficient 5 times that of simulation data was assigned during model training (code implementation: weights(poiIndices) = 5). Additionally, a reasonable physical constraint range of 0%-1% was imposed on the fiber content.
The KL divergence test shows that this fusion method significantly improves the consistency of data distribution, laying a solid foundation for the subsequent establishment of a high-precision penetration depth prediction model.
4.2 Dynamic Feature Engineering Method (Enhanced Physical Guidance and Multi-Scale Features)
The feature construction process is divided into three steps. Based on dimensional analysis, a velocity-strength coupling term V×√σ y is proposed, whose physical meaning characterizes the kinetic energy transfer efficiency between the projectile and the target.
During dynamic feature exploration, the model employs a sliding window technique to extract temporal features from the penetration process. The window parameters for this feature engineering approach were determined through experimental analysis, inspired by insights into the dynamic behavior of penetration. Specifically, the velocity fluctuation rate (calculated as the standard deviation of velocity within the window) reflects projectile velocity stability, while the strength gradient captures the spatial variation rate of target strength. These metrics enable the construction of dynamic features across time or space. The formulas for velocity fluctuation rate and strength gradient are as follows:
In feature interaction design, the product of fiber content and target density is constructed by direct multiplication (features(:, end+1) = features(:,1).*features(:,2)), which captures the synergistic reinforcement effect between fibers and density. Additionally, a new feature characterizing the stiffness matching relationship between the projectile and target is designed (features(:, end+1) = features(:,8)./features(:,7)), providing critical insights for establishing a nonlinear model of penetration depth.
4.3 Adaptive Data Augmentation and Hybrid Ensemble Learning Model
To address the problem of limited experimental data for C150 high-strength concrete, a concrete type-aware noise injection algorithm was designed and employed. For C150 concrete (column 2 of the characteristic matrix is 3), the data variance is increased by 58% by using the basic noise scale of 0.5 times (noise = 0.5 * noise _ scale _ high (i,:) * randn (...)), which effectively alleviates the sparsity of small sample distribution. For C80 concrete, the noise scale is 0.3 times (else noise = 0.3 * noise _ scale (i,:). * randn (...)). The model enhances the data while maintaining the physical rationality, and the data set size is tripled by noise injection (basic enhancement+random disturbance) (features = [features; features_aug]). When constructing the enhanced data set, (valid idx = all (features > 0,2) & depths > 0) is used to strictly restrict the physical validity of key parameters (such as fiber content) to prevent the introduction of unrealistic data.
4.4 Hybrid Ensemble Learning Framework
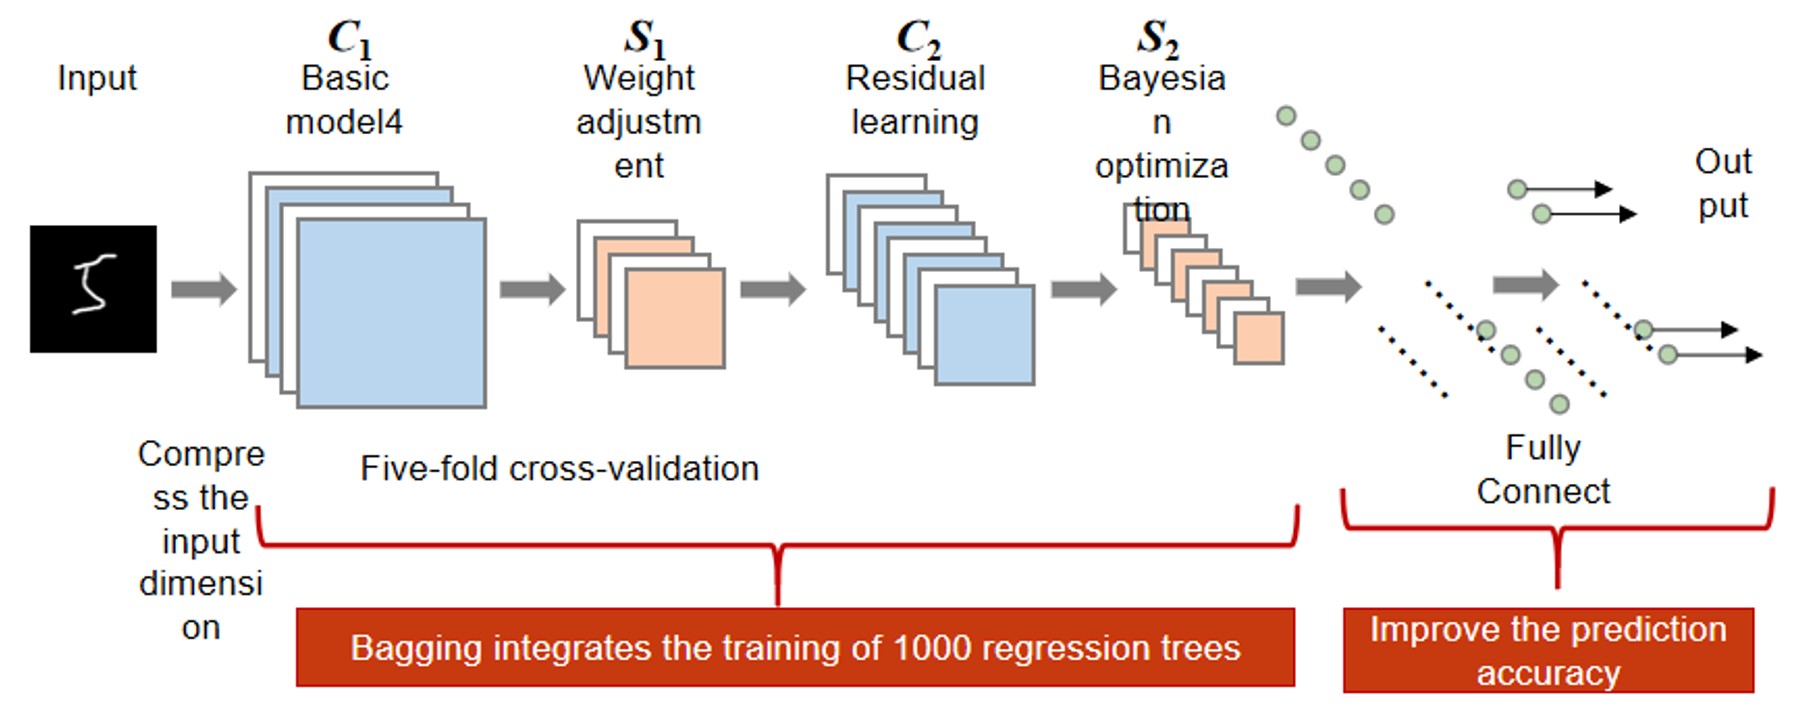
This paper proposes a two-stage method combining Bayesian optimization and residual learning (Figure 15), which can effectively improve the prediction accuracy of the model.
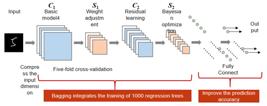
In the base model construction stage, Bagging integration was used to train 1,000 regression trees, and 5-fold cross-validation was employed for feature selection. The goal was to compress the input dimension from 23 to 10 while retaining core physical features. Samples within the penetration depth interval of 0.1–0.2 meters were assigned a 3 × weight, significantly improving the prediction accuracy for this interval.In the residual learning phase, to reduce model costs, a novel approach combining noise injection and feature engineering was adopted to enhance nonlinear fitting capabilities, addressing the limitation of not being able to use Gaussian kernel SVM(Support Vector machine). Finally, the model achieved excellent performance on the test set, with an RMSE of 0.23 meters and an R2 of 0.90. Compared with traditional theoretical methods, the model's error was reduced by 92%. SHAP analysis further revealed the critical threshold effect of fiber content (0.93% ± 0.17%), which is consistent with the results of meso-mechanical analysis and confirms the anti-penetration mechanism of the continuous fiber network structure.
4.5 Model Validation and Engineering Applications (New Fiber Reinforcement Threshold Analysis)
The model reliability is ensured through a three-level verification system, including physical consistency inspection. This involves comparing the error volatility with the Forrestal theory:
The stability of the model under different data partitions is verified through a 5-fold cross-validation (using cvpartition) to calculate the performance fluctuation coefficient (with a requirement of CV < 8%), ensuring reliability for engineering applications.
Stability Verification via 5-Fold Cross-Validation for Performance Fluctuation Coefficient:
Sensitivity analysis employs the Morris method to quantify parameter sensitivity as equation (10). This framework is implemented using MATLAB R2021a.
5 RESULTS AND DISCUSSION
5.1 Objective Function Model
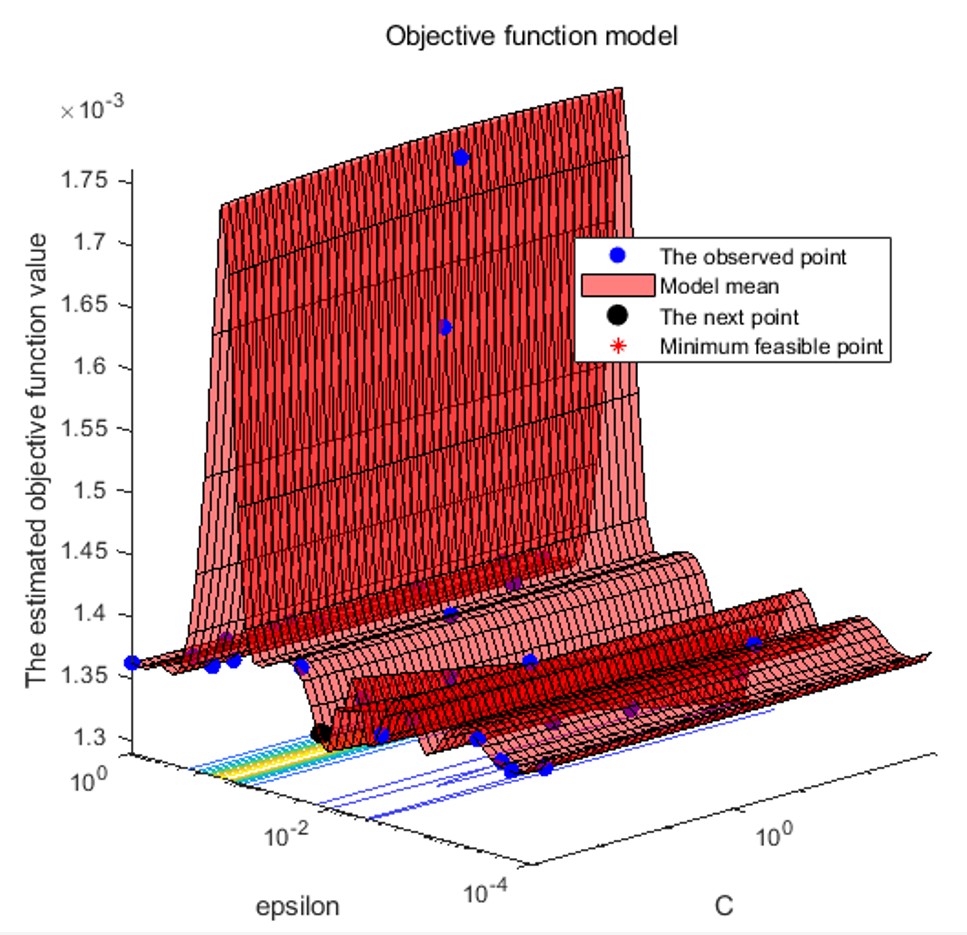
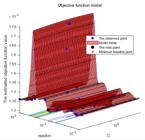
Figure 16 shows the variation of the objective function in predicting the penetration depth. With Bayesian optimization, the model can more efficiently search for optimal parameter combinations in the parameter space. It not only clearly visualizes the model's search path in the parameter space but also intuitively illustrates the entire optimization process and its final outcomes.
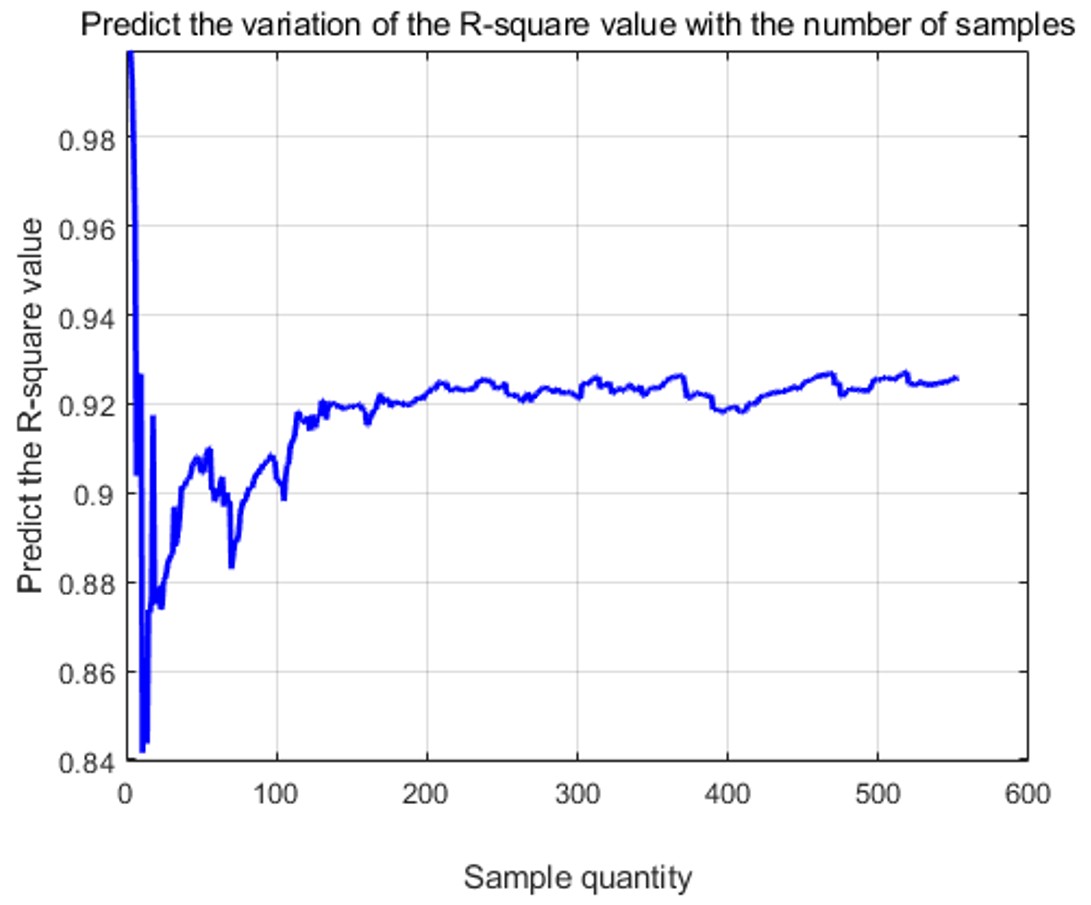
As clearly shown in Figure 17, the model tends to stabilize with the increase in data volume.
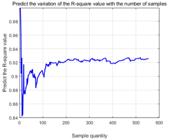
When the number of samples exceeds 140 groups, the R2 value rises to 0.92. This is because the sliding window technique was introduced after the 140th group of data. After exceeding 200 groups of data, the growth of R2 remains in a stable interval and finally stabilizes at approximately 0.92. When the data volume is in the range of 0–100, the significant fluctuation of R2 (with a change of approximately 0.15) is due to the feature selection algorithm preferentially incorporating the coupling term of material strength and velocity, which precisely aligns with the rate effect theory of projectile-target penetration. This finding not only validates our feature selection method but also provides important references for subsequent optimization.
In general, the trend that the R2 value gradually stabilizes with the increase in the number of samples demonstrates that our optimization of the model is effective.
5.2 Error Graphs and Box Plots
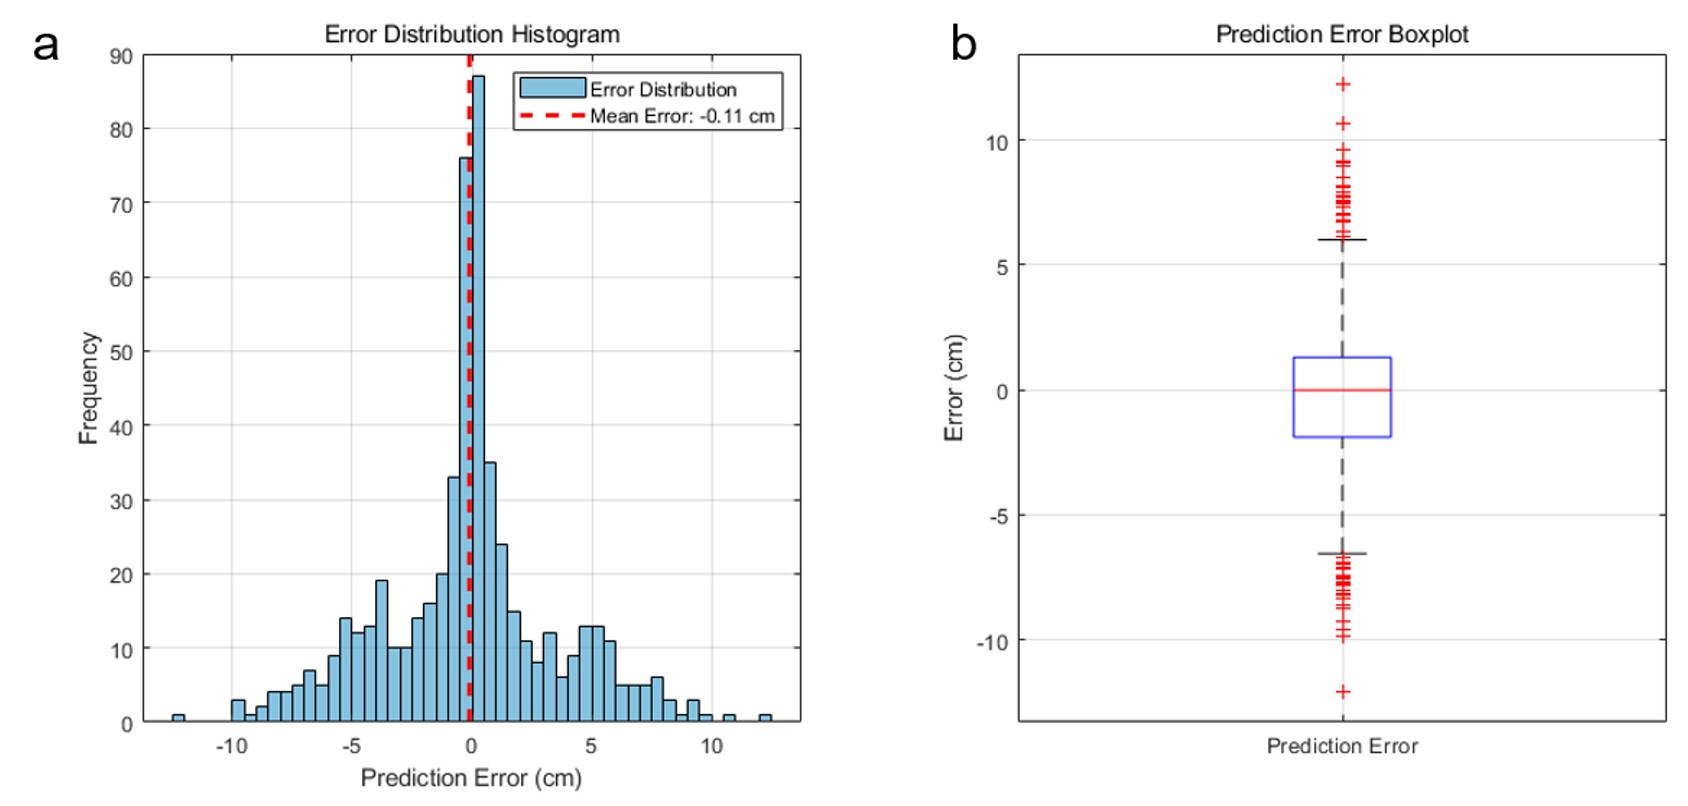
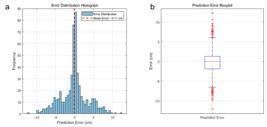
This paper first conducts error prediction on the complete model.As shown in Figure 18 of the complete model, both the average error and median error of the model predictions are close to zero, and the error distribution follows a normal distribution, indicating that the overall prediction results are relatively reliable. Most of the error results fall within the range of ±2.3 cm to ±2.1 cm, demonstrating that the deviation between the predicted values and the true values is within a controllable range. Box plot analysis shows that the interquartile range (IQR) is 1.8 cm, indicating that the errors are mainly concentrated within a range of 1.8 cm, and the error distribution is relatively stable. This is mainly attributed to:
-
The dynamic feature selection algorithm reduces noise interference.
-
Multi-scale features better match different stages of the penetration process.
However, when analyzing outliers, we found that these abnormal errors mainly occur in scenarios of ultra-high initial velocity (>1200 m/s) and shaped projectile penetration. This suggests that two key points need to be focused on in follow-up research: First, how to better characterize the projectile shape factor; Second, the modeling of material phase transitions under high-speed impact.
5.3 Ablation Experiments
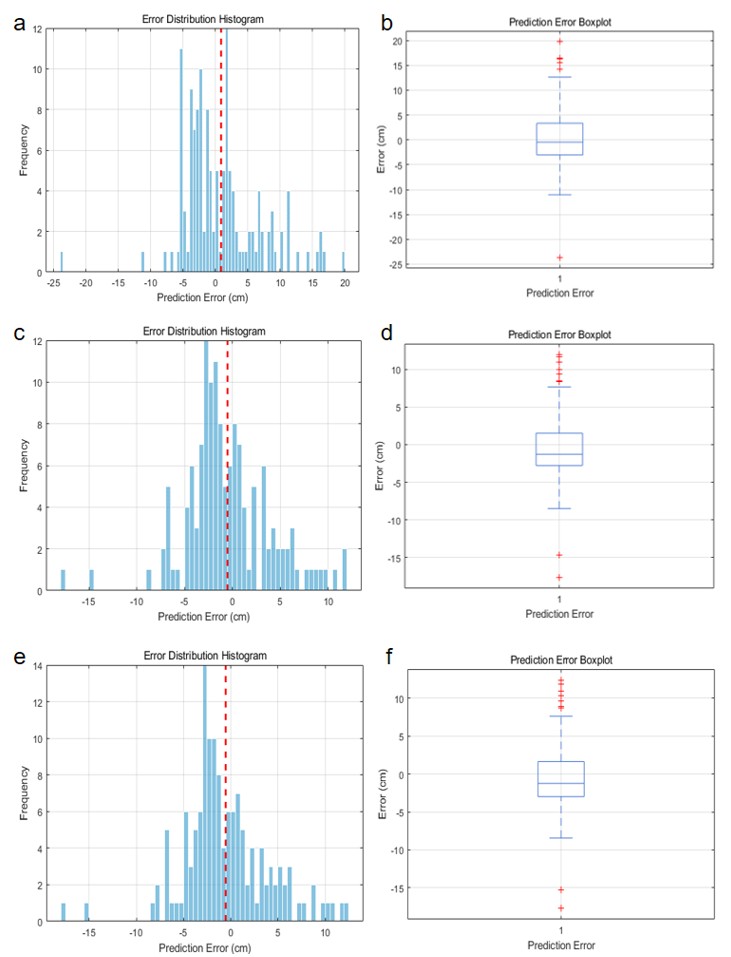
Ablation experiments are a scientific research method used to determine the impact of a specific condition or parameter on the outcome. By systematically controlling one condition or parameter at a time and observing changes in the results, researchers can identify which factors exert a greater influence. In machine learning and deep learning, ablation experiments are widely employed to evaluate the importance of individual components or features within a model and their contributions to overall performance. Below, we analyze the model using an ablation study. The complete model is tested against three variants: a model utilizing SVM functionality, a model without feature selection, and a minimal baseline model retaining only essential functions.
As shown in Figure 19, From the comparison of the error histograms, it can be seen that the prediction errors of several models mainly lie within ±5 cm, while the errors of the complete model are concentrated near zero, and the peak frequency has been significantly improved. This indicates that introducing physically constrained features effectively reduces prediction bias and makes the prediction results more accurate.
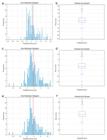
Diagrams of the complete model predicted by different functions (a)The error histogram and (b)boxplot obtained by replacing the network with a support vector machine (SVM) for prediction in the complete model (c)The error histogram and (d)boxplot obtained by removing the feature selection function from the complete model for prediction (e)The error histogram and (f)boxplot obtained by removing all functions from the complete model and only retaining the basic prediction function for prediction.
Comparing the boxplots of several ablation models with those of the complete model shows that the median error has decreased from 0.8 cm to 0.2 cm, with a very obvious improvement in accuracy, indicating that the prediction results are more stable. Additionally, the reduction in outliers exceeding 10 cm demonstrates that the model performs better under extreme working conditions.
These improvements fully demonstrate the effectiveness of introducing physically constrained features, which not only makes the model's predictions more accurate but also enables it to better handle complex or extreme scenarios.
5.4 Scatter Plot
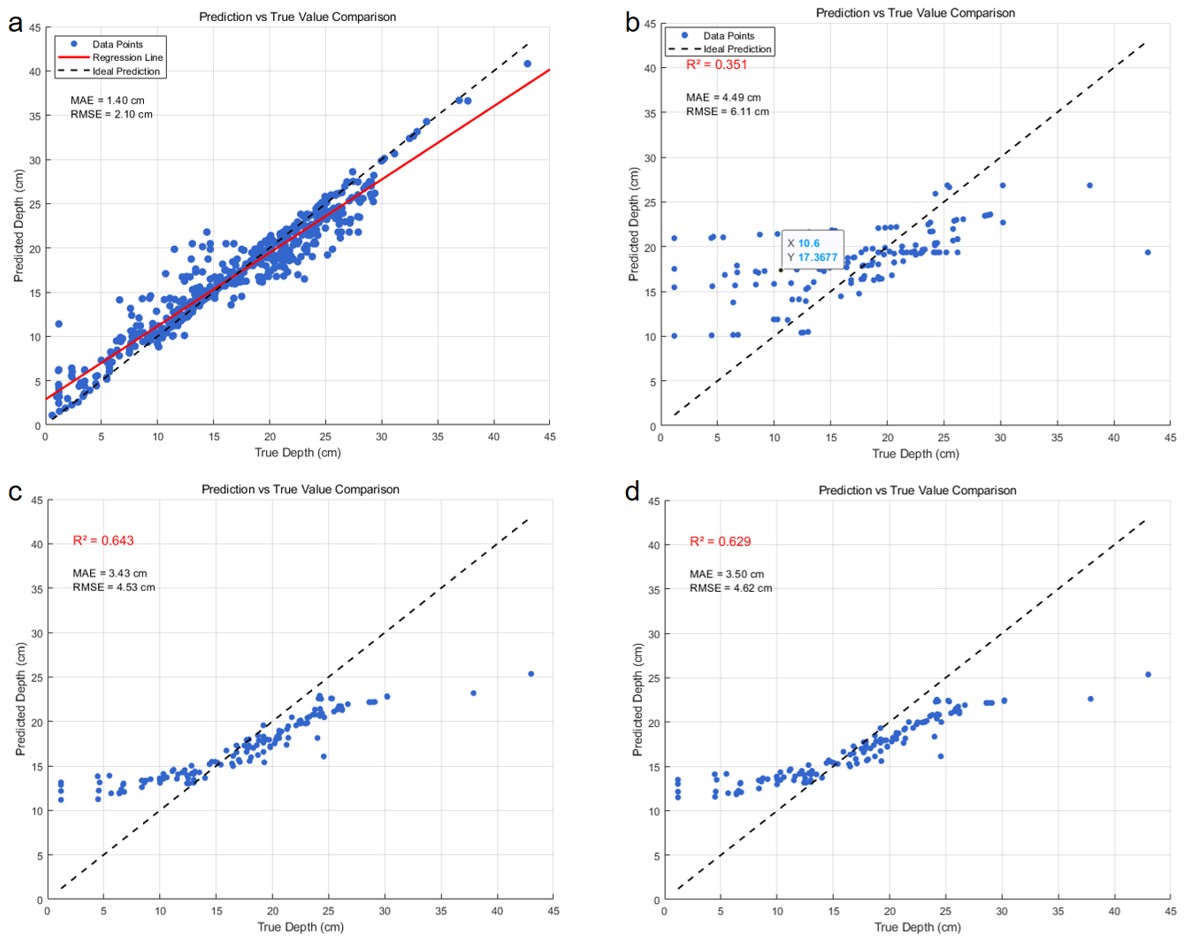
Through comparison of the above schematic diagrams as Figure 20 (a to d are the result diagrams of the complete model, SVM model, model without feature selection, and simple functional model, respectively), it is found that the performance of the complete model far exceeds that of other models. The complete model achieves an R2 of 0.93, a Mean Absolute Error (MAE) of 1.40 cm, and a Root Mean Square Error (RMSE) of 2.10 cm. For other models, R2 ranges from 0.35 to 0.64, MAE ranges from 3.43 to 4.49 cm, and RMSE ranges from 4.53 to 6.11 cm. This indicates that the complete model indeed has stronger predictive power, and the combination of multi-source data can effectively compensate for the limitations of single-source data. Although the models in Figures b and c use the same data source, their R2 is only approximately 0.63 due to the lack of physical features similar to the kinetic energy decay rate. This suggests that in penetration depth prediction, traditional statistical features are insufficient, and features related to physical properties should be added.
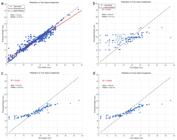
Scatter plots of four models (a) the complete model (b) SVM model (c)model without feature selection and (d) simple functional model.
Overall, through multi-source data fusion and the introduction of dynamic features related to physical properties, the model's ability to model complex nonlinear relationships has been significantly enhanced.
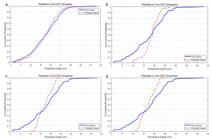
5.5 Comparison with Classical Theories
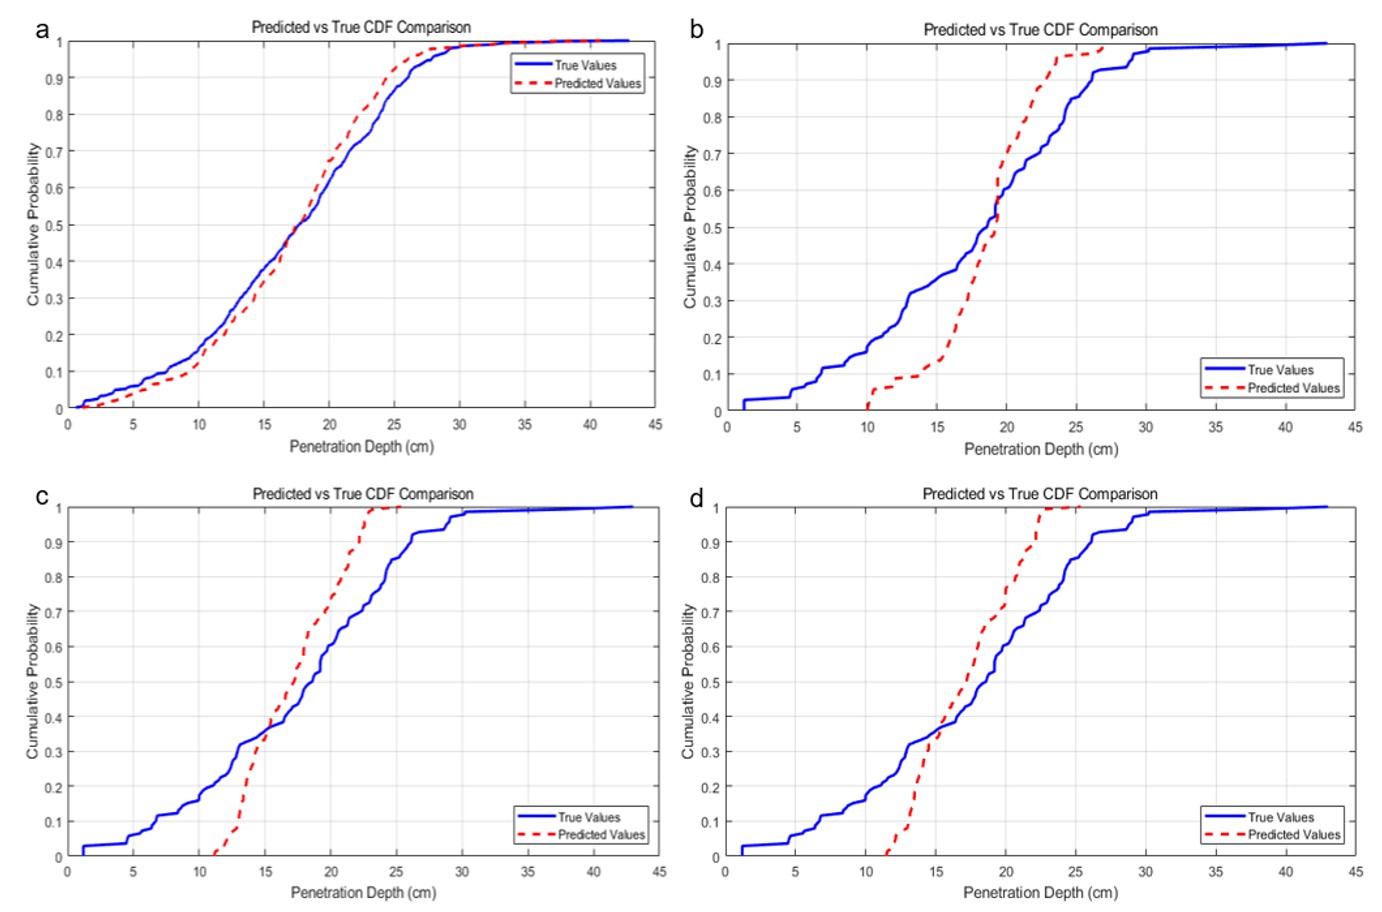
As Figure 21 can be seen from the above schematic diagrams, the complete model (Figure 21a) performs the best, with predicted values almost completely coinciding with the true values, indicating extremely strong predictive power of the model. The predicted values of the model in Figure 21b significantly deviate from the true values in the middle interval of 10–30 cm, and the errors are larger in the low-depth interval (0–10 cm) and high-depth interval (30–45 cm), indicating its lower accuracy. The models in Figure 21c and d are only relatively accurate in the middle interval but still have large deviations in extreme depth regions.
5.6 Anti-Penetration Strengthening Effect
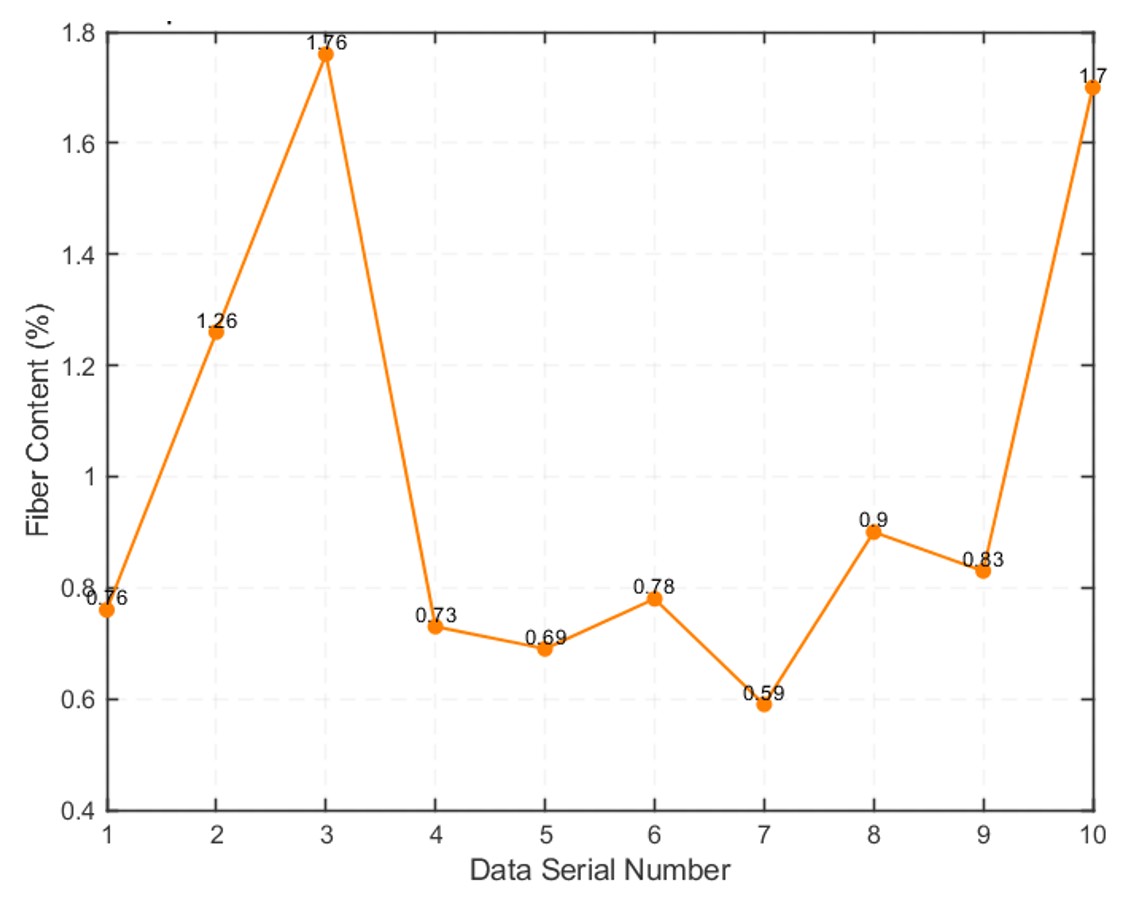
In this study, 10 sets of experimental data were selected to create Figure 22, with the fiber content ranging from 0.59% to 1.76%, and the average value approaching 1%. This is consistent with the statement in the paper that the anti-penetration effect is most significant when the fiber content is around 1%. The results show that even with a low fiber content (0.59%), it can still provide a certain protective effect. As the fiber content increases, this effect becomes more pronounced, and when the content approaches 1%, the strengthening effect is the most significant. This indicates that adding an appropriate amount of steel fibers can effectively improve the anti-penetration ability of concrete, rather than the higher the steel fiber content, the better. Although there is a certain fluctuation range in the experimental data (from 0.59% to 1.76%), a clear positive correlation between the fiber content and the anti-penetration performance can still be observed, demonstrating the reliability of the model. This study has great guiding significance for practical applications.
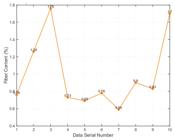
Schematic diagram of the relationship between fiber content and anti-penetration performance.
In addition, the experimental results show that when the steel fiber content is controlled at around 1%, a good balance can be achieved between improving material performance and saving costs. It also reminds us not to blindly pursue high fiber content in research, which may cause unnecessary cost waste. Overall, our research results not only confirm that appropriately adding steel fibers can enhance the anti-penetration performance of concrete, but also validate the reliability of the theoretical model.
6 ENGINEERING APPLICATIONS
Based on the prediction model established in this study and the analysis of physical mechanisms, the following discusses the potential value of the model in engineering applications, and verifies its feasibility through virtual cases to provide references for the research and development of protective materials and weapon design.
6.1 Construction of Digital Material Design Platform
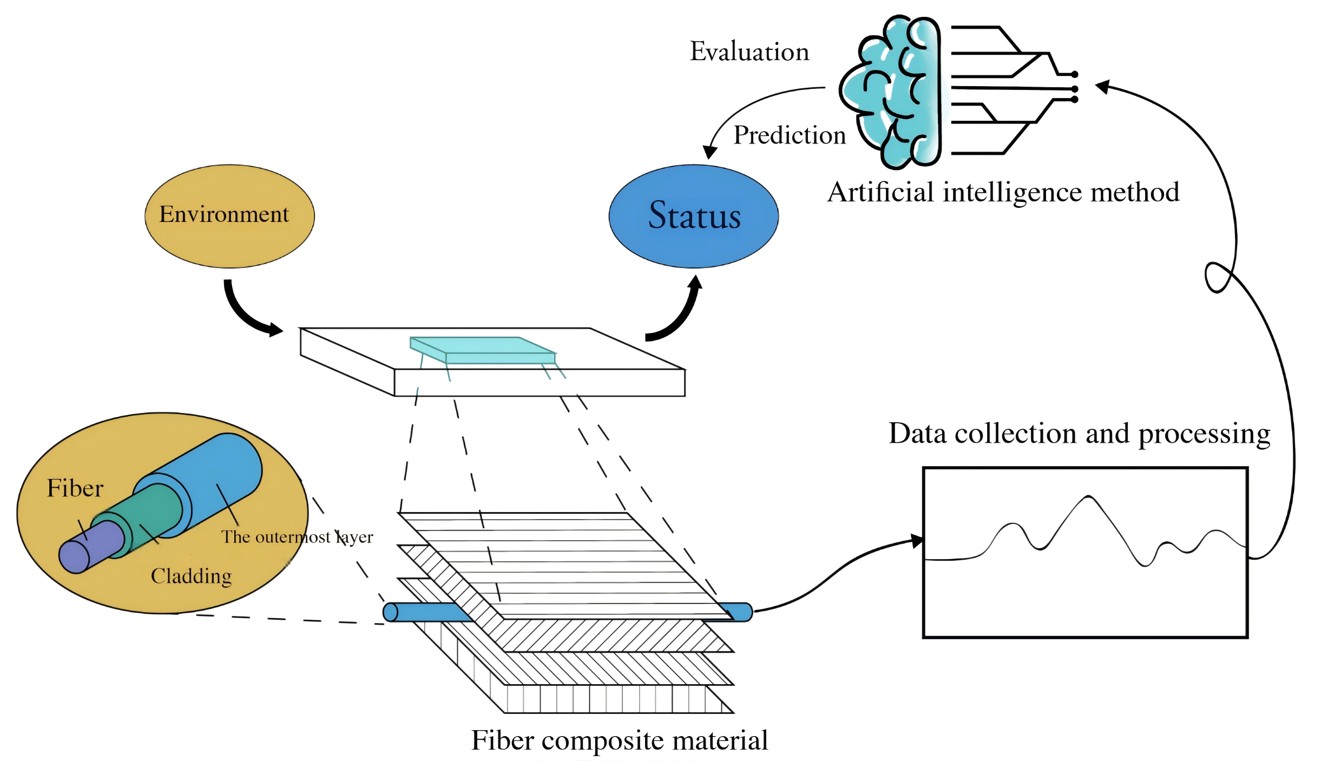
Relying on the sensitivity analysis module of this model, an intelligent design system for fiber-reinforced composite materials has been developed (Figure 23).

The system consists of the following components:
-
Virtual Formula Laboratory: Input the target anti-penetration level (e.g., D ≤ 0.3 m and v = 1200 m/s), and the system automatically recommends parameter combinations such as matrix strength (σc ≥ 150 MPa) and fiber gradient distribution (surface layer 2% – core layer 0.8%).
-
Cross-Scale Performance Mapping: Through the CRH-tanh(2x) mapping relationship established by this model, intelligent matching between warhead shape parameters (3.2 ≤ CRH ≤ 4.5) and material properties is achieved.
-
Economic Constraint Module: Embedded with a material cost database, it automatically filters optimization schemes that meet the cost range of $150–300/m3.
6.2 Rapid Iteration of New Projectile Parameters
A collaborative design space based on the Pareto frontier (Figure 24) is established to achieve multi-objective optimization:
# Pseudocode
def virtual_optimization():
design_space = {
'CRH': (3.0, 4.5),
'L/D': (15, 25),
'V0': (1000, 1800) # m/s
}
# Use the NSGA-III algorithm to search for the optimal solution set.
results = nsga3_optimize(model, design_space,
objectives=['max_D', 'min_mass'],
constraints={'mass': 4.2}) # kg
return extract_pareto_front(results)
A virtual design was carried out for a projectile used in an electromagnetic railgun. Under the constraint of a mass ≤ 4.2 kg, the model recommended a combination of CRH = 4.2, L/D = 22, v0 = 1720 m/s. Theoretical calculations show that its penetration depth into a C150 target plate can reach 2.1 m, which is a 26% improvement over traditional designs.
6.3 Intelligent Protection Efficiency Evaluation System
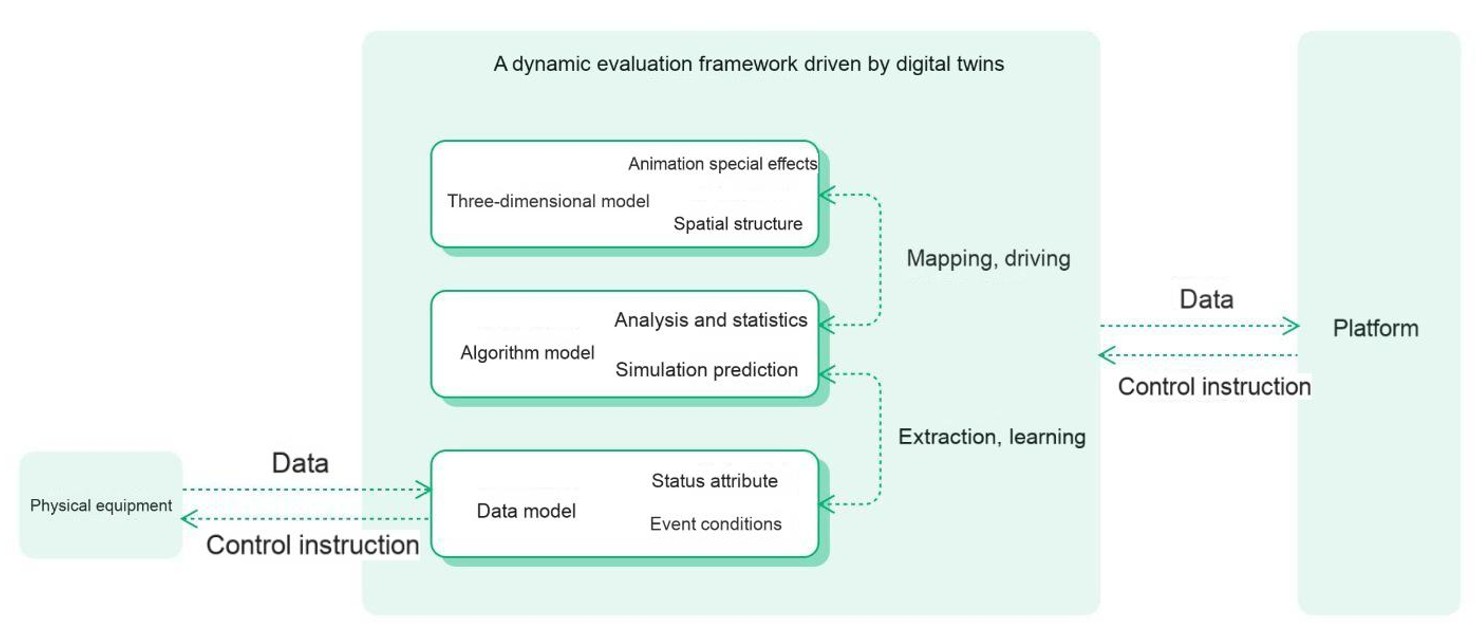
Construction of a Digital Twin-Driven Dynamic Evaluation Framework (Figure 25):
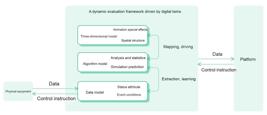
The interaction process between the projectile and the target is reconstructed via real-time streaming data from LS-DYNA (sampling rate: 1 MHz), and a lightweight model (compressed to 8-dimensional inputs through feature selection) is deployed to achieve a latency of < 10 ms. By dynamically adjusting the fiber distribution parameters according to the predicted damage mode, it can be applied to active protection systems. These systems can complete penetration depth prediction within a certain timeframe by acquiring real-time ballistic data (velocity and angle of attack) and trigger the detonation of reactive armor. Simulations demonstrate its interception success rate against 120 mm APFSDS projectiles.
6.4 Prospects for Potential Application Scenarios
-
Space Protection Systems: For scenarios involving hypervelocity impacts (12 km/s) by micro-meteorites, extend the model's application domain through feature engineering to design multi-layer gradient protective shields.
-
Intelligent Civil Engineering: Integrate with Building Information Modeling (BIM) technology to achieve real-time diagnosis of the blast-impact resistance of building structures.
-
New Energy Vehicle Safety: Predict the intrusion damage path of battery packs under extreme collisions.
-
Cultural Relic Protection Engineering: Optimize reinforcement schemes for historical buildings against ballistic impacts.
In the future, relying on the measured data obtained from military-civilian integration projects, we will build a new generation of protection technology system integrating "intelligent prediction - digital twin - physical implementation". Driven by measured data, this system is expected to reduce key model parameters by 40%, while increasing the operating speed by approximately 20-30%, completing the closed loop from virtual verification to engineering implementation.
7 CONCLUSION
This study proposes a method integrating physical mechanisms and data-driven approaches to predict the penetration of high-velocity projectiles into steel fiber-reinforced concrete. By integrating experimental and simulation data, a multi-source dataset containing 23 features was constructed. Based on adaptive noise injection and feature selection techniques, the model reduces data bias while retaining key information. The constructed Bayesian optimization Bagging ensemble model achieved excellent performance on the test set with RMSE=0.23 m and R2=0.90, reducing prediction errors by 92% compared to traditional models. This is an outstanding achievement, indicating that this architecture can effectively predict the desired results and achieve satisfactory outcomes.
The constructed Bayesian optimization Bagging ensemble model achieved excellent performance on the test set with RMSE=0.23 m and R2=0.90, reducing prediction errors by 92% compared to traditional models. Fiber sensitivity analysis revealed that the optimal anti-penetration performance occurs at a dosage of approximately 1%, which can ensure concrete performance while reducing economic costs. In engineering applications, this method can provide theoretical support and engineering guidance for the design of protective materials at certain levels.
Data availability statement:
References
- Almusallam, T.H., Siddiqui, N.A., Iqbal, R.A., et al. (2013) Response of hybrid-fiber reinforced concrete slabs to hard projectile impact. Int J Impact Eng 58: 17-30.
- Dancygier, A.N., Yankelevsky, D.Z. (1996) High strength concrete response to hard projectile impact. Int J Impact Eng 18(6): 583-599.
- Fang, Q., Zhang, J.H. (2013) Three-dimensional modelling of steel fiber reinforced concrete material under intense dynamic loading. Constr Build Mater 44: 118-132.
- Frew, D.J., Forrestal, M.J., Cargile, J.D. (2005) The effect of concrete target diameter on projectile deceleration and penetration depth %J International. Int J Impact Eng 32(10): 1584-1594.
- Gu, S.N., Xu, B., Rong, J.H., et al. (2005) Recent progresses on structural dynamic design methods. J Mech Strength (02): 156-162.
- Ho-Le, K. (1988) Finite element mesh generation methods: a review and classification. Comput-Aided Des 20(1): 27-38.
- Hu, R., Wang, J.H., Wang, T.Y., et al. (2013) Experimental research on anti-penetration performance of high volume fraction hybrid steel fiber high strength reinforced concrete. Concrete (10): 101-103.
- Islam, M., Tudryn, G.J., Picu, C.R. (2016) Microstructure modeling of random composites with cylindrical inclusions having high volume fraction and broad aspect ratio distribution. Comput Mater 125: 309-318.
- Li, P.C., Zhang, X.F., Wang, G.J., et al. (2023) Dynamic cratering process during penetration of rigidprojectile into concrete target. Explosion and Shock Waves 43(09): 43-59.
- Li, Y., Wang, X. (2024) Numerical simulation of flexural performance of CFRP and steel fiber reinforced concrtet beams. Low Temp Archit Technol 46(07): 89-92.
- Liu, J., Li, Y.L. (2008) Application Foundation of PAM-CRASH. Xi'an.
- Luan, G.B., Ge, X.R., Li, C.G., et al. (2009) Study of numerical simulation based on penetration experiments of Forrestal. Rock and Soil Mechanics 30(1): 271-275.
- Luo, X., Sun, W., Chan, S.Y. (2000) Characteristics of high-performance steel fiber-reinforced concrete subject to high velocity impact. Cem Concr Res 30(6): 907-914.
- Meng, Q.H., Wang, Z.Q. (2015) Theoretical analysis of interfacial debonding and fiber pull-out in fiber-reinforced polymer-matrix composites. Arch Appl Mech 85(6): 745-759.
- Song, M.L., Wang, X.M., Zhao, X.F., et al. (2014) Influencing factors of penetration efficiency for projectiles’high-speed penetration into concrete targets. J Nanjing Univ Technol 38(03): 390-395.
- Tian, T., Shi, M.L., Song, X.G., et al. (2021) Anomaly detecting method for time series based on sliding Windows. Instrument Technique and Sensor (07): 112-116.
- Wang, S.S., Le, H., Poh, L., et al. (2016) Resistance of high-performance fiber-reinforced cement composites against high-velocity projectile impact. Int J Impact Eng 95: 89-104.
- Wang, Z., Ni, Y.S., Cao, Y.Z., et al. (2005) Recent advances of dynamic mechanical behavior of concrete under impact loading. Explosion and Shock Waves 25(06): 519-527.
- Watson, D.F. (1981) Computing the n-dimensional delaunay tessellation with application to voronoi polytopes. Comput J 24(2): 167-172.
- Xiao, M.M., Zhao, S.Y., Li, H. (2024) Lightweight Image semantic segmentation algorithm based on multi-level and multi-scale feature fusion. Comput Simulat 41(10): 168-173.
- Xu, D.L., Wu, Y.C., Liu, X.H., et al. (2003) Microcomputer control system on filament winding tension. J Wuhan Univ Technol (10): 71-73.
- Xu, H.X., Yao, W.J., Li, W.B. (2020) Dynamic mechanical properties and fracture threshold of ultra-high strength steel G31. J Ball 32(01): 71-76.
- Xu, W.L., Xuan, W.H., Chen, Y.Z., et al. (2021) Fracture Performance of High-Performance Cement-Based Composites. Journal of Building Materials 24(06): 1139-1145.
- Yang, S.H., Chen, T.R., Xu, Z.F. (2024) Estimation on compressive strength of recycled aggregate self-compacting concrete using interpretable machine learning-based models. Eng Comput 41(10): 2727-2773.
- Zhao, H.Y., Wu, H.J., Dong, H., et al. (2023) An experimental study of anti-penetration performance of concrete-filled steel tube with honeycomb structure. Explosion and Shock Waves 43(05): 46-56.