Predicting the Punching Shear Capacity of RC Slab-Column Connections with FRP Bars Using Machine Learning Based Algorithms
Abstract
In this study, two novel machine learning (ML) models, developed using Gene Expression Programming (GEP) and Multi Expression Programming (MEP) algorithms, are proposed for predicting the punching shear capacity of reinforced concrete (RC) slab-column connections with fiber reinforced polymers (FRP) as longitudinal bars. Using the GEP and MEP models, the values of statistical indicators obtained from the training dataset were very close to those values obtained from the testing dataset. In addition, a comparative study was conducted on experimental results and prediction results from the design codes, existing models in the literature and proposed ML models. The comparison revealed that the two models with the highest coefficient of determination (R2) and the lowest mean absolute percentage error (MAPE), root mean square error (RMSE), and coefficient of variation (COV) values belong to the GEP and the MEP model. The results indicated that the proposed GEP and MEP models outperformed the other models in terms of prediction accuracy and robustness. Finally, sensitivity and parametric analyses were conducted.
Keywords:
Punching shear capacity; FRP bars; gene expression programming; multi expression programming; sensitivity; parametric

1 INTRODUCTION
The fact that steel bars are weak in terms of corrosion is important trouble for the solidity of RC structures (Truong et al., 2022a). Over time, corrosion leads to serious deterioration in RC structures. It disrupts adherence (Fang et al., 2006; Blomfors et al., 2018). It reduces load-bearing capacity of RC structures because of decrease in cross-sectional area of the steel (Almusallam, 2001; Fernandez et al., 2015). Diverse ways are used to eliminate this problem, including the use of stainless or coated steel bars, impermeable or slightly impermeable concrete and deep concrete cover or sealants (Smith and Virmani, 2000; Patel, 2019). FRP bars have been frequently used as reinforcement to eliminate the corrosion risks. FRP bars are preferred not only for their resistance to corrosion, but also for their high strength-to-weight ratio, lightweight nature, high tensile strength, without any magnetic belongings, ease of production, and ease of transportation. FRP types commonly mentioned in the literature are glass (GFRP), carbon (CFRP), basalt (BFRP) and aramid (AFRP) (Almomani et al., 2024; Sengun and Arslan, 2024; Sengun and Arslan, 2022; Keskin et al., 2017; Mahmoud et al., 2024; Aydin et al., 2022; Cakir et al., 2021; Cakir et al., 2023; Akkaya et al., 2022a; Akkaya et al., 2022b; Akkaya et al., 2024) .
Structural elements using FRP bars as reinforcement have been the research topic of numerous experimental studies to understand the influence of FRP bars to their structural behavior (Tarawneh and Majdalaweyh, 2020; Tomlinson and Fam, 2015; Hassan et al., 2013a). One of these research topics is the punching shear behavior at slab-column connection areas. It is critical to be able to correctly describe the punching shear behavior because shear failure does not give warning during failure of the structural integrity and its effects can be chaotic (Kang and Wallace, 2006; Kim et al., 2014). Bouguerra et al. (2011) carried out a study to understand the punching shear behavior of FRP-RC bridge deck slabs. The parameters of this experimental study are effective slab thickness, concrete compressive strength, FRP bars ratio and FRP type. Shear failure was observed in all experimental specimens. It was concluded in the study that effective slab thickness and concrete compressive strength had the greatest influence parameters on punching shear behavior. It is also observed that the crack widths in the slab increase as the FRP bar ratio decreases. Another conclusion is that FRP bars with a similar axial stiffness value have a similar effect on punching shear behavior, regardless of the type of FRP. Hassan et al. (2013a) concluded that increasing the GFRP bars ratio in slab enhances the punching shear capacity. Additionally, the punching shear behavior of RC slab-interior column connections was researched by Kurtoğlu et al. (2013). According to this research, it was understood that specimens with GFRP bars had a higher deformation capacity, but a lower punching shear capacity, than those with steel bars. In another similar experimental research (Junaid et al., 2024), it was reported that column dimensions and the location of punching shear perimeter have a substantial impact on punching shear capacity. Lee et al. (2009, 2010) explained the effect of parameters such as the type of reinforcement (FRP or steel) and the reinforcement concentration near the column area on punching shear behavior. Moreover, Dulude et al. (2013) mentioned that effective slab thickness and column dimensions are the most determining parameters in understanding the punching shear behavior of FRP-RC slab-column connection areas. Similarly, another study (Hassan et al. 2013b) reported that concrete compressive strength is also among the key parameters affecting punching shear capacity.
Machine Learning (ML) is a domain of artificial intelligence. ML can discover and enhance the complex relationship between the parameters in elaborate datasets by using algorithms. Then, ML makes predictions according to the patterns of these algorithms. Today, ML is widely used in many disciplines such as medicine, finance, and civil engineering. In recent years, many studies (Badra et al., 2022; Abood et al., 2024; Alkhawaldeh, 2024; Yan et al., 2024; Momani et al., 2024; Xu and Shi, 2024) have employed ML algorithms to predict punching shear capacity, which is considered a theoretically complex design aspect within structural engineering, a subfield of civil engineering. Truong et al. (2022b) examined the applicability of machine learning for the prediction of punching shear capacity of FRP-RC slabs. Support Vector Regression (SVR), Random Forest (RF), and Extreme Gradient Boosting (XGBoost) were applied to a dataset of 104 specimens collected from the literature to predict punching shear capacity using three machine learning algorithms. The study concluded that the XGBoost-based model provided the highest prediction accuracy for punching shear capacity among all models evaluated. Doğan and Arslan (2022) conducted a study to evaluate the prediction performance of punching shear capacity in slabs reinforced with either FRP or steel bars, using data collected from the literature. The collected dataset was analyzed using five ML algorithms such as Multiple Linear Regression (MLR), Bagging-Decision Tree Regression (Bagging-DT), RF, SVR and XGBoost. Evaluating the prediction performance of these five ML algorithms, SVR yielded the best prediction results, especially for specimens incorporating GFRP bars. Other studies (Derogar et al., 2024; Salihi and Hamad, 2024) have also reported that artificial intelligence applications are sufficient for the prediction of punching shear capacity. Furthermore, another study in the literature (Yan et al., 2024) found that the Gradient Boosting Regression Tree (GBRT) model achieved the best agreement between predicted and actual results.
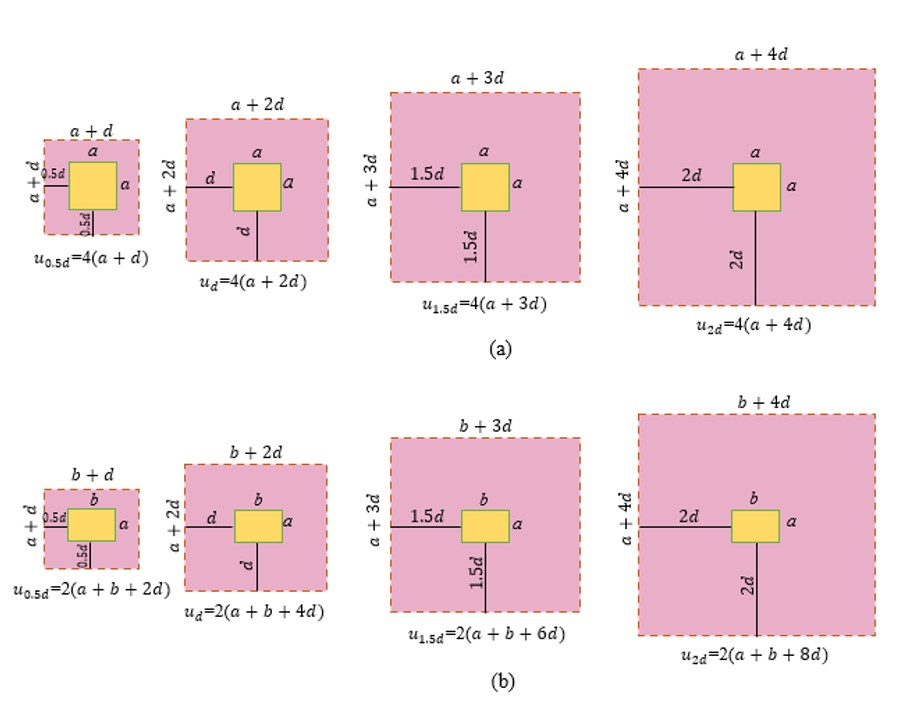
Experimental studies (Elgabbas et al., 2016; Gouda, and El-Salakawy, 2016; Hussein and El-Salakawy, 2018; AlHamaydeh and Anwar Orabi, 2021; Eladawy et al., 2019) have concluded that specimens with FRP bars exhibit lower punching shear capacity compared to their counterparts with steel bars. Furthermore, existing design models for predicting the punching shear capacity of FRP-RC slab-column connections are generally adapted from models originally developed for connections using steel reinforcement. This approach raises concerns about its adequacy in capturing the unique punching shear behavior. Accurately predicting the punching shear capacity of RC slab-column connections is critical for structural safety. Therefore, achieving high prediction performance for the punching shear capacity is significant. Additionally, most ML algorithms used in the literature for predicting the punching shear capacity of FRP-RC slab-column connections provide direct numerical predictions rather than generating explicit equations. Studies that employ ML algorithms to produce predictive equations for FRP-RC slab-column connections remain limited. To address this gap, the present study proposes predictive equations derived from different ML algorithms for estimating the punching shear capacity of FRP-RC slab-column connections. The algorithms used in this study are GEP and MEP. A total of 136 specimens of FRP-RC two-way slab–interior column connections without shear reinforcement were collected from the literature. The proposed equations are valid for the specimens illustrated in Figure 1. The predictions obtained using the proposed equations were statistically compared with those generated by twenty different models available in design codes or previous studies. Finally, Sensitivity and parametric analyses are performed on the proposed models.

2 COLLECTIONS OF DATASET AND PREDICTIVE MODELS
2.1 Collection of Dataset
An extensive dataset was compiled by reviewing numerous research papers focused on the experimental investigation. The final dataset consists of 136 experimental specimens collected from studies available in the literature (Hassan et al., 2013a; Bouguerra et al., 2011; Kurtoğlu et al., 2023; Junaid et al., 2024; Lee et al., 2010; Hassan et al., 2013b; Elgabbas et al., 2016; Gouda, and El-Salakawy, 2016; Hassan et al., 2014; Abduljaleel et al., 2017; El-Gamal et al., 2005a; Banthia et al., 1995; El-Ghandour et al., 2003; El-Tom, 2007; El-Gamal et al., 2007; Jacobson et al., 2005; Salama, 2009; Nguyen-Minh and Rovňák, 2013; Ju et al., 2018; Hemzah et al., 2019; Dulude et al., 2011; Salihi and Hamad, 2023; Ospina et al., 2003; Ahmad et al., 1994; Zhang et al., 2005; Zhang, 2006; Bank and Xi, 1995; Hussein et al., 2004; Zhu et al., 2012; Zaghloul and Razaqpur, 2003; Zaghloul et al., 2007). All columns in the experimental specimens are interior columns with either square or rectangular cross-sections. The specimens were subjected to monotonic, concentric loading without eccentricity. FRP bars are used as flexural reinforcement in the two-way RC slabs, and no shear reinforcement is provided. The primary input parameters influencing the punching shear capacity can be identified as the concrete compressive strength used in the slab , effective slab thickness (), punching perimeter (), FRP bar ratio (), and the elastic modulus of FRP (). The location of the punching shear perimeter varies across different shear models and is determined by offsetting the effective slab thickness () from each edge of the column by 0.5, 1, 1.5, and 2 times, corresponding to , , and , respectively.
In this study, the input parameters used for developing the ML models were determined based on experimental studies, existing design codes, and previous ML-based research. In addition to the experimental studies mentioned in the Introduction section, Experimental studies (Ahmad et al., 1994; Banthia et al., 1995; Bank and Xi 1995; Ospina et al., 2003) shown that concrete compressive strength is an effective parameter on the punching shear capacity of FRP-reinforced concrete slab-column connections. Furthermore, Louka Thesis (1999) and El-Gendy and El-Salakawy (2014) state that the elastic modulus of the FRP bar has a positive relationship with the shear capacity of RC slab-column connections. Moreover, Deifalla (2022) mentioned the mechanisms and parameters affecting the punching shear capacity. These mechanisms and parameters are described as follows: the crack surface friction mechanism related to concrete compressive strength, the dowel effect mechanism related to FRP bar ratio, the FRP type related to elastic modulus of FRP, the fracture surface related to the punching perimeter, and the size effect related to the effective slab thickness of the RC slab. Alateyat et al. (2024) reported that the primary parameters in the calculation of the punching shear capacity are , , , , and . Based on the examining of design codes, theoretical and analytical studies in the literature presented in this study, it was concluded that the primary parameters are , , , , and . Finally, Researchers have used , , , , and as the primary input parameters to develop ML models on predicting the punching shear capacity of FRP-RC slabs through several ML studies in the existing literature (Momani et al., 2024; Salihi and Hamad, 2024). (Figure 2)

Calculation of the punching perimeter; (a) square column section, (b) rectangular column section
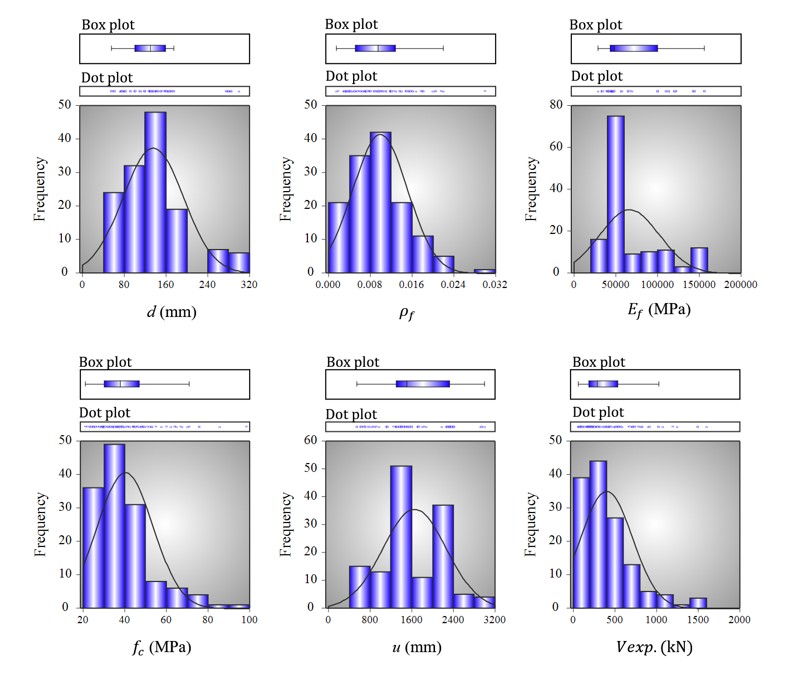
The properties of the 136 specimens, along with the experimentally obtained punching shear capacity values, are presented in Table 1. Histograms showing the distributions of the design parameters and punching shear capacity are provided in Figure 3. Moreover, the applicability range of the equations derived in this study, as well as the analysis results and evaluations, are valid within the limits specified in Table 1. The dataset includes three types of FRP bars, where GFRP is the most common with 89 specimens, followed by CFRP with 31 and BFRP with 16 specimens.

As evident from Table 1 and Figure 3, the minimum and maximum values of the design parameters cover a sufficiently wide range. The effective slab thickness ranges from 55 mm to 300 mm, the reinforcement ratio from 0.0015 to 0.0300, the elastic modulus of FRP () from 28400 MPa to 156000 MPa, the concrete compressive strength () from 21.10 MPa to 98.30 MPa, and the punching perimeter at from 544 mm to 3000 mm. The application ranges of the two proposed equations in Equations (21) and (22), which were generated using the GEP and MEP algorithms respectively, cover the above-given limits.
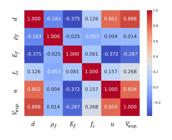
The punching shear capacity ( also exhibits a wide range, varying from 57200 N to 1600000 N. In addition, the dataset contains a high proportion of specimens made with normal-strength concrete. Approximately 80% of the specimens fall within the normal-strength concrete range (, 15% are made with high-strength concrete (, and 5% with low-strength concrete (. All specimens examined in the experimental studies exhibited shear failure, and rupture of the FRP bars was also observed. Moreover, Figure 4 illustrates the relationship between the input parameters and the output parameter, as quantified by the Pearson correlation coefficient. This coefficient ranges from -1 to 1, where values close to zero indicate a weak correlation, and values close to one indicate a strong correlation. As shown in Figure 4, the parameter with the weakest correlation with the punching shear capacity is . In addition, the fact that the Pearson coefficients between the punching shear capacity and parameters and are over 0.8 indicates that these parameters have a strong correlation with the punching shear capacity.
2.2 Predictive Models in Literature
In this study, twenty models were employed to predict the punching shear capacity. Among these, three models (ACI 440. 1R-15, 2015; JSCE, 1997; CAN/CSA S806, 2012) were obtained from widely adopted design codes in the literature, while the remaining seventeen models (Jacobson et al., 2005; Dulude et al., 2011; Ospina et al., 2003; Zhang, 2006; Zaghloul and Razaqpur, 2003; Alateyat et al., 2024; El-Ghandour et al., 1999; El-Ghandour et al., 2000; Matthys and Taerwe, 2000; El-Gamal et al., 2005b; Metwally, 2013; Kara and Sinani, 2016; Hassan et al., 2017; El-Gendy and El-Salakawy, 2020; Ju et al., 2021; Salama et al., 2021; Alrudaini, 2022) were sourced from previous research studies. These FRP-based models were generally developed using various approaches, including modifications of models originally created for steel reinforcement, empirical formulations, and fracture mechanics principles. In developing these models, the mechanical advantages of FRP bars were also taken into consideration. One of the referenced models was derived empirically using experimental data and incorporates the axial stiffness of FRP bars, expressed as the ratio of neutral axis depth to the depth of FRP reinforcement. The model proposed by JSCE (1997) is also based on empirical methodology, similar to ACI 440.1R (2015), but additionally considers axial stiffness through the modulus ratio between FRP and steel, along with the FRP reinforcement ratio. The model proposed in the CAN/CSA S806-12 code (2012) distinguishes itself by incorporating the cube root of the concrete compressive strength when calculating punching shear capacity. It recommends three different equations, advising the selection of the one that yields the minimum value. Like the JSCE code, this model also accounts for axial stiffness effects. Table 2 presents the equations used by the twenty models to estimate punching shear capacity. As illustrated, the most used parameters across all models include effective slab thickness , FRP reinforcement ratio , modulus of elasticity of FRP (), concrete compressive strength (), and the punching perimeter (). Although these parameters are consistent, the coefficients and root expressions within the equations vary due to differences in experimental data and theoretical approaches used during model development.
As shown in Table 2, the influence of concrete compressive strength is typically accounted for using square or cubic root formulations. Similarly, slab dowel action is considered in many models through square or cubic roots of the FRP reinforcement ratio. The modulus of elasticity of FRP is included either directly or as a ratio relative to the modulus of elasticity of concrete or steel. Regarding punching perimeter, all design codes and nearly half of the other models adopt . When alternative values are used, is the most common, followed by , which appears in only a few models. Finally, the size effect is incorporated in many models by applying an exponent to the effective slab thickness, with the exponent values varying across different equations.
2.3 ML Models
Two ML models, GEP and MEP, were developed to estimate the punching shear capacity of FRP-RC slabs. These models were chosen for their ability to capture complex, non-linear relationships between input parameters. The development process and predictive equations of both models are given in the subsections.
GEP, presented by Ferreira (Ferreira, 2001), is an ML algorithm that allows solving complex problems even without a large database (Cevik and Sonebi, 2008). The GEP model is developed in consequence of a process that selects the most appropriate model by trying various combinations of the parameters in the input dataset. The GEP model is an effective tool for suggesting equations in cases where the equations in codes or literature are insufficient in terms of reliability. Various programming languages are used in the GEP model. VBA, Matlab, C++ are examples of programming languages that can be used in the GEP model. Genes and chromosomes are fixed in length. They form an expression tree (ET). This is integrated into the GEP model. The ET originates from differences in size and shape of non-linear entities. Each gene is characterized by a head and a tail, and the quantity of genes can be one or more in the GEP model. The head of the gene is represented by function and terminal symbols, while the tail of the gene is represented by terminals such as constant and variable. The use of functions such as addition, subtraction, multiplication and division is for the connecting of genes. The GEP model requires a balance. This is in terms of the number of genes and chromosomes. Increasing the number of genes can result in overly long and complex expressions, whereas increasing the number of chromosomes can increase computational time and reduce efficiency. The following is a summary of the simplified procedures for generating a GEP model; the fitness function is determined, chromosomes are generated according to the selected terminals and functions, the number and head length of genes and chromosons are determined, and link functions and function sets are selected. Figure 5a illustrates the flowchart of this modeling process. The GEP modeling framework consists of five essential components: the function set, terminal set, fitness (or conformance) function, control parameters, and termination condition. The function set typically includes a range of mathematical operators, and users define the number of constants to be used within each gene (Murad et al., 2021; Jumaa and Yousif, 2018).

The flowcharts of the GEP and MEP models (a) GEP model (Ferreira, 2001) (b) MEP model (Fallahpour et al., 2021)
Predictive modelling of structural element capacities has been increasingly enabled by the application of GEP in civil engineering. For instance, Alacalı et al. (2024) developed three GEP models to predict the contribution of FRP sheets to shear capacity in reinforced concrete beams. Their results demonstrated that the GEP models outperformed both design code equations and models proposed in previous studies. Numerous researchers (Alacali and Arslan, 2024; Aydogan et al., 2023; Alacali, 2022; Murad et al., 2020; Azim et al., 2020; Murad, 2020; Aval et al., 2017; Alacalı and Arslan, 2025; Akkaya and Alacalı, 2025) have identified GEP as a promising and reliable approach for various civil engineering applications. GeneXproTools (2025) was employed to develop the GEP model in this study. To ensure model robustness, a total of 136 experimental specimens collected from the literature were randomly divided into a training set (75%) and a test set (25%). The optimal GEP model was obtained by systematically adjusting key parameters such as the number of genes, number of chromosomes, head size, and linking functions. The final model was selected based on its predictive performance. The configuration settings of the selected GEP model are provided in Table 3, and its corresponding expression tree is illustrated in Figure 6. The mathematical expression derived from the final model is presented in Equation 21.

MEP, introduced to the literature by Oltean and Dumitrescu (Oltean and Dumitrescu, 2002), is a symbolic regression technique used to generate new mathematical expressions for solving complex problems. The most distinguishing feature of MEP compared to GEP is that MEP can encode more than one solution in a single chromosome. This is achieved through linear chromosomes, where each gene encodes a partial solution, and the most suitable one is selected based on the fitness of individuals (Zhang et al., 2016). This capability helps to control the complexity of generated expressions and avoid overly complicated models. Another key advantage of MEP is its flexibility in solving complex optimization problems without relying on predefined mathematical models or assumptions. This feature positions MEP as a powerful and sophisticated optimization technique. The basic steps of the MEP algorithm are illustrated in the flowchart shown in Figure 5b. The process begins with the generation of a population of random individuals. Next, two individuals are selected for pairwise competition, followed by a crossover operation that produces two offspring. These offspring are then subjected to mutation, after which weaker individuals in the population are replaced by stronger ones. This iterative cycle continues until an optimal solution is reached (Oltean and Dumitrescu, 2002; Inqiad et al., 2023). The iterative nature of the MEP algorithm has been recognized in several studies (Oltean and Dumitrescu, 2002; Chisari and Bedon, 2016; Gandomi et al., 2015) as an effective approach for developing feasible mathematical expressions for complex problems. Recently, MEP has been applied to various civil engineering domains, including materials (Jin et al. 2023), geotechnical engineering (Zhang and Xue, 2022), transportation (Awan et al., 2022), and structural engineering (Arabshahi et al., 2020). Similar to GEP, MEP constructs predictive equations that mathematically model complex relationships between parameters with high accuracy. However, its application in civil engineering remains more limited compared to GEP. Inqiad et al. (2023) practiced the MEP algorithm to predict the compressive strength of self-compacting concrete, demonstrating its effectiveness for predictive modeling. Chu et al. (2021) compared GEP and MEP algorithms for estimating the compressive strength of geopolymer concrete containing fly ash. Their findings revealed that the prediction accuracy of the MEP-based model was statistically comparable to that of the GEP-based model. Similarly, a recent study (Khan et al. 2024) reported that both GEP and MEP equations predicted the flexural capacity of FRP reinforced concrete beams with high accuracy.
The robustness of the MEP model depends on the suitable selection of the various MEP setup parameters. In this study, parameters such as population size, number of generations, and operator sets were determined based on literature recommendations and initial trials. An increase in population size generally improves model accuracy, but it may also lead to increased complexity and a risk of overfitting (Zhang and Huo, 2024). The specific parameter settings used for the MEP model in this study are summarized in Table 4. The mathematical operators used in the model include basic functions such as addition, subtraction, multiplication, and division. The number of generations reflects the level of refinement expected from the final solution; thus, the algorithm must run over multiple generations to minimize prediction error. Various parameter combinations were tested to obtain the most accurate model, and the configuration with the lowest error was selected. As with the GEP model, the dataset was divided into training (75%) and testing (25%) subsets. The MEP model was developed using the MEPX v1.0 software. The final equation, derived using the MEP algorithm, is presented in Equation 22.
3 RESULTS
Statistical indices were used to measure the accuracy of the predicted values obtained from the proposed equations and to compare them with those derived from existing literature. The first index, the mean value (MV), is calculated as the ratio of the experimental value to the predicted value. An MV close to 1 indicates strong agreement, while values above or below suggest either inefficiency or reliability issues. Other indices used include standard deviation (SD), mean absolute percentage error (MAPE), root mean square error (RMSE), coefficient of determination (R2), and coefficient of variation (COV). The relevant equations for these indices can be found in the literature (Aydogan et al., 2023; Zhang and Huo, 2024). An R2 value near 1 and a COV close to 0 indicate high correlation and model consistency. Lower SD, RMSE, and MAPE values imply greater model reliability. The statistical values of ML models for the training and test datasets are presented in Table 5. The two novel models were developed using the GEP and MEP algorithms with a training dataset consisting of 102 specimens. Then, the robustness of the developed models was controlled statistically using a test dataset consisting of 34 specimens. According to the values presented in Table 5, for the GEP model, the R2, MAPE, and RMSE values for the training dataset are 0.947, 16.540, and 69.794, respectively, while for the testing dataset, they are 0.947, 14.880, and 75.605. These values indicate that the model performs well in both training and testing datasets. Furthermore, based on the values obtained in Table 5, for the MEP model, the R2, MAPE, and RMSE values for the training dataset are 0.941, 16.183, and 74.558, respectively; for the testing dataset, these values are 0.917, 13.984, and 95.407. The similarity in the statistical values of the GEP and MEP models for both the training and test datasets indicates that the developed models have strong predictive and generalization capabilities, making them reliable for new data. Additional statistical indices such as MV, SD, and COV further support the robustness of the proposed GEP and MEP models. According to Tables 5, for the GEP model, the training dataset yields an MV of 1.014, SD of 0.198, and COV of 0.186, while the corresponding values for the test dataset are 1.012, 0.188, and 0.186, respectively. For the MEP model, the MV, SD, and COV values are 0.988, 0.189, and 0.191 for the training dataset, and 1.005, 0.187, and 0.186 for the testing dataset. These values are close to those obtained from the GEP model, supporting the conclusion that the MEP model demonstrates similar performance. As can be seen in Table 5, the statistical values obtained from the train dataset using the developed ML models were highly similar values to those obtained from the test dataset. These similar values indicate that the complex relationships between the data were accurately identified during the training process. Based on the values obtained in Table 5, it was concluded that there was no overfitting problem with the train and test data of the developed models and that the models were usable in terms of accuracy and robustness.
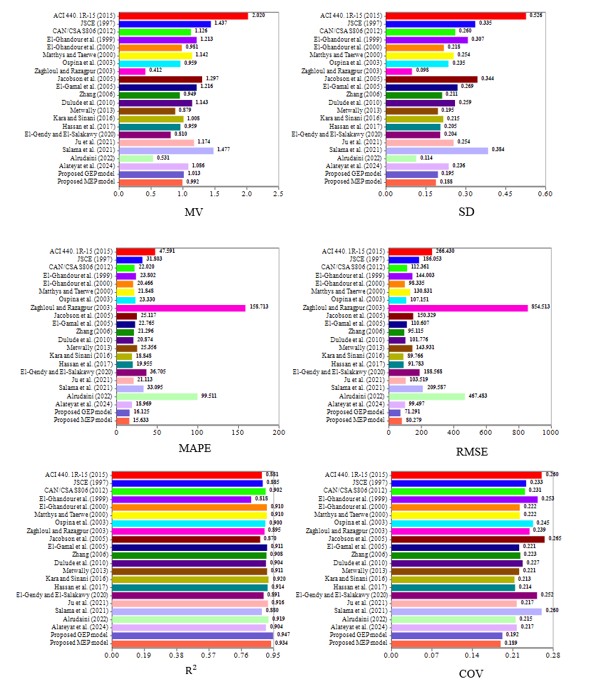
The accuracy of the proposed GEP and MEP models is evaluated by comparing its predictions of the punching shear capacities of RC slab-column connections with those calculated using the ACI 440. 1R-15, 2015; JSCE, 1997; CAN/CSA S806, 2012 design codes and Jacobson et al., 2005; Dulude et al., 2011; Ospina et al., 2003; Zhang, 2006; Zaghloul and Razaqpur, 2003; Alateyat et al., 2024; El-Ghandour et al., 1999; El-Ghandour et al. 2000; Matthys and Taerwe, 2000; El-Gamal et al., 2005b; Metwally, 2013; Kara and Sinani, 2016; Hassan et al., 2017; El-Gendy and El-Salakawy, 2020; Ju et al., 2021; Salama et al., 2021; Alrudaini, 2022 existing equation from researchers. Table 6 provides statistical indicators for the prediction results of all equations and ML models used in this study. In addition, the graphical representation of statistical results based on all datasets is shown in Figure 7. The evaluation excludes material and strength reduction factors to provide a direct comparison with experimental results. As can be seen in Table 6 and Figure 7, the two best models with a strong correlation between the predicted and experimental punching shear capacity are the GEP and MEP models. Comparing the R2 values of all models, the models with the highest R2 values are GEP and MEP, with values of 0.947 and 0.934, respectively. Furthermore, the proposed ML models have minimal MAPE, RMSE, and COV values compared to the other models in Table 6 and Figure 7. The SD values of the ML models are also low. Considering the MV values, it is seen that the prediction results of the GEP model (1.013) and the MEP model (0.992) are very close to the experimental results. From all these results, the prediction accuracy of both the GEP and MEP models is superior to the equations investigated in this study. Using all value in dataset, the scatter plots that presented the relationship between the predicted and experimental values for the punching shear capacity based on the proposed ML models, design codes, and existing equations from the researchers are given in Figure 8. Figure 8 shows that the two models with the least dispersion belong to the GEP and MEP models. Therefore, it can be said that the proposed GEP and MEP models demonstrate high efficiency in predicting punching shear capacity.


The CAN/CSA S806 (2012) model has high R2 value with 0.902 and minimal value for MARE, RMSE and COV among the design codes. This model shows the best agreement with the experimental data, while ACI 440.1R-15 (2015) demonstrates the lowest predictive accuracy among the design codes. As can be seen in Figure 7 that The MV value of ACI 440.1R-15 (2015) is 2.020 for all data. This MV is the largest value seen in Table 6 and Figure 7. This value indicates that the predictions are overly conservative and highly scattered in Figure 8. This suggests that using ACI 440.1R-15 (2015) may lead to uneconomical structural designs. One possible reason for this outcome is that the equation does not adequately capture the effect of the axial stiffness of the FRP bar in the cracked section during shear failure (Truong et al., 2022b). In contrast, the JSCE (1997) model, which explicitly includes the axial stiffness effect in its formulation, yields better results than ACI 440.1R-15 (2015). According to the comparison results in Tables 6, the lowest R2 values among the existing models from researchers were obtained by El-Ghandour et al. (1999), with 0.818 for all data. In contrast, the highest R2 values were achieved by Kara and Sinani (2016), with a value of 0.920 for all data. With respect to the coefficient of variation (COV), the lowest values were observed in Kara and Sinani (2016), reporting 0.213 for all data. On the other hand, the highest COV values were found in Jacobson et al. (2005), with 0.265 for all data. Despite these variations, the range between the minimum and maximum values remains relatively narrow in both R2 and COV across the models. In Table 6, the MV value closest to 1 belongs to Kara and Sinani (2016) with 1.008 among all models. In addition, it can be seen that the dispersion of the model belonging to Kara and Sinani (2016) is low in Figure 8. Taking into account all statistical indicators, including SD, MAPE and RMSE, the models proposed by Kara and Sinani (2016) demonstrate the highest prediction accuracy among the existing models from researchers. Figure 7 and Table 6 show clearly that the lowest MV values, being 0.412 and 0.531, belong to Zaghloul and Razagpur (2003) and Alrudaini (2022) models, respectively. Prediction by Zaghloul and Razagpur (2003) and Alrudaini (2022) models exhibit overly unconservative and highly scattered in Figure 8. In addition, their MAPE and RMSE values are significantly higher than those of the other models as seen in Figure 7.
3.1 Bland–Altman Analysis for Model Validation
To further evaluate the agreement between the predicted and experimental results, Bland–Altman analyses were conducted for both training and testing datasets, as shown in Figure 9. This method, proposed by Bland and Altman (1986) graphically represents the differences between predicted and actual values against their mean. For both GEP and MEP models, the vast majority of data points lie within the ±1.96 standard deviation limits, with mean differences close to zero. This indicates that both models provide consistent predictions without significant bias, supporting the reliability of the proposed models alongside the statistical indices.

3.2 Sensitivity and Parametric Analysis
Sensitivity analysis (SA) examines the influence of input variables on output variation in machine learning models. The following equations can be used to represent SA: (Gandomi et al., 2011; Aslam et al., 2022; Iftikhar et al., 2022; Khan et al., 2021)
where and represent the maximum and minimum values of the output of the predictive models. Furthermore, i represents the input domain, while the rest of the input variables are kept constant their mean values (Aslam et al., 2022). Figure 10 shows the SA results, illustrating the relative contributions of the input parameters to the punching shear capacity () predicted by the GEP and MEP models.

As shown in Figure 10, the contribution of the effective slab thickness () is the most dominant parameter in both models and is determined as 47.12% in the GEP model and 50.29% in the MEP model. This high relative contributions compared to other parameters show that the punching shear capacity is significantly dependent on the effective slab thickness. The contribution of the percentage of FRP flexural reinforcement ( is 10.02% in the GEP model and 13.78% in the MEP model.
The elasticity modulus ( was determined as the parameter with the lowest effect in the sensitivity analysis with a contribution rate of 2.01% in the GEP model and 1.07% in the MEP model. This result indicates that the is not a dominant factor on the punching capacity compared to other parameters. The contribution of the concrete compressive strength () is 14.92% in the GEP model and 12.32% in the MEP model. The contribution of concrete compressive strength on punching shear capacity is similar in GEP and MEP models. The punching perimeter () contributes 25.93% in the GEP model and 22.54% in the MEP model. As the second most influential parameter after effective slab thickness, the punching perimeter () enhances the shear capacity of the slab by expanding the load distribution.
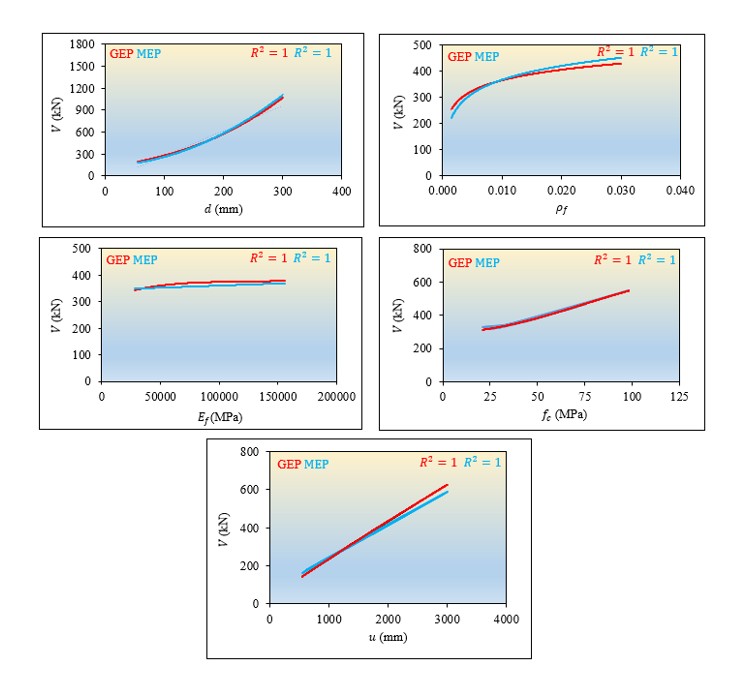
Parameter analysis (PA) helps to determine the effect of input parameters on the output parameter (). Similar to the sensitivity analysis, in the parametric analysis each input variable was varied individually within its experimental range, while all other variables were fixed at their mean values to observe the effect of that parameter on the punching shear capacity () (Aslam et al., 2022). The mean constant values used in the analysis were obtained from the experimental dataset and correspond to an effective slab thickness of 135.52 mm, a reinforcement ratio of 0.0099, an elasticity modulus of 66464.12 MPa, a concrete compressive strength of 40.25 MPa, and a punching perimeter of 1654.22 mm. For each parameter, the selected variable was changed between its minimum and maximum experimental limits, while the remaining parameters were kept constant at these mean values. This procedure was applied for both the GEP and MEP models, ensuring that the influence of each parameter on the predicted punching shear capacity was evaluated under identical and consistent conditions The results of the parameter analysis for various input values of both models are presented in Figure 11.

As seen in Figure 11, the effective slab thickness () is the most dominant variable in both models, and as increases, the shear capacity increases nonlinearly. This increase is sharper in the GEP and MEP models than the other parameters, and it is observed that the predicted punching shear capacity increases much faster at high effective slab thicknesses. In the GEP and MEP model, the punching shear capacity increase is more gradual, as the reinforcement ratio () increases and it is observed that the capacity increase slows down after a certain value. At FRP reinforcement percentages, the predictions of both models give similar results. As seen in the sensitivity analysis, the effect of the increase in the elasticity modulus () on the punching shear capacity is very limited and the GEP and MEP models exhibit similar trends in punching shear capacity. In both the GEP and MEP models, shear capacity increases as concrete compressive strength () increases. As the punching perimeter () increases, the shear capacity increases significantly in both models.
4 CONCLUSION
In this study, two different equations are proposed to predict the punching shear capacity using both GEP and MEP algorithms. A comprehensive experimental data set is used to derive these equations. The prediction results of the proposed equations are compared with the prediction results of existing equations in literature. Finally, sensitivity and parametric analyses of the proposed equations are performed. The following is a summary of the conclusions.
-
The statistical results in using the GEP model for predictions, the R2, MAPE, RMSE, MV, SD and COV values for the training dataset are 0.947, 16.540, 69.794, 1.014, 0.198 and 0.186, respectively, while for the testing dataset, they are 0.947, 14.880, 75.605, 1.012,0.188 and 0.186, respectively.
-
The statistical results in using the MEP model for predictions, R2, MAPE, RMSE, MV, SD and COV values for the training dataset are 0.941, 16.183, 74.558, 0.988, 0.189 and 0.191 respectively, while for the testing dataset, these values are 0.917, 13.984, 95.407, 1.005, 0.187 and 0.186, respectively.
-
The statistical results obtained from the training and test datasets are very close in value. This indicates that the developed GEP and MEP models possess strong predictive capabilities. Furthermore, it can be stated that the models are reliable in terms of accuracy and robustness when applied to new data.
-
As a result of a comparison study using all experimental results in the data, the statistical results obtained for the predictions of the design codes, existing literature from researchers, and the proposed GEP and MEP models show that the two best models having the highest R2 are the GEP model with the 0.947 value and the MEP model with the 0.934 value. Furthermore, the models having minimal MAPE, RMSE, and COV values are the GEP and MEP models. Therefore, the proposed GEP and MEP models outperform the design codes and existing literature from researchers investigated in this study.
-
The comparison study shows that the SDs of the GEP and MEP models are also low. Furthermore, the MV values for the GEP and MEP models are 1.013 and 0.992, respectively. The proximity of these values to 1 indicates that predictions made using the GEP and MEP models closely align with experimental values.
-
In the light of the statistical results, it can be said that GEP and MEP models show similar performances in terms of accuracy and robustness.
-
Among the design codes evaluated, the CAN/CSA S806 (2012) code demonstrated the highest agreement with experimental results. In contrast, ACI 440.1R-15 (2015) showed the lowest prediction accuracy.
-
The model with the highest MV value belongs to ACI 440.1R-15 (2015) with 2.020. Therefore, the predictions using ACI 440.1R-15 (2015) may be overly conservative and economically inefficient
-
In the light of all statistical indicators using in this study, the models proposed by Kara and Sinani (2016) demonstrate the highest prediction accuracy among the existing models from researchers.
-
The lowest MV values, being 0.412 and 0.531, belong to Zaghloul and Razagpur (2003) and Alrudaini (2022) models, respectively. Predictions using by Zaghloul and Razagpur (2003) and Alrudaini (2022) models exhibit overly unconservative and highly scattered. In addition, their MAPE and RMSE values are significantly higher than those of the other models.
-
Sensitivity analysis revealed that effective slab thickness ( was the most dominant parameter, contributing 47.12% in the GEP model and 50.29% in the MEP model. The modulus of elasticity () was found to have the least influence, with contribution rates of 2.01% and 1.07% in the GEP and MEP models, respectively.
-
Parametric analysis indicated that variations in effective slab thickness ( and punching perimeter ( significantly affect the predicted punching shear capacity in both models.
-
Data Availability:
Research data is available in the body of the article
References
- ACI Committee 440. (2015). Guide for the design and construction of structural concrete reinforced with fiber-reinforced polymer FRP bars. American Concrete Institute.
- Abduljaleel, M. T., Mahmoud, A. S., & Yousif, A. (2017). Experimental investigation of two-way concrete slabs with openings reinforced with glass fiber reinforced polymer bars. Journal of Engineering Science and Technology, 12(4), 898-912.
- Abood, E. A., Abdallah, M. H., Alsaadi, M., Imran, H., Bernardo, L. F. A., De Domenico, D., & Henedy, S. N. (2024). Machine Learning-Based Prediction Models for Punching Shear Strength of Fiber-Reinforced Polymer Reinforced Concrete Slabs Using a Gradient-Boosted Regression Tree. Materials, 17(16), 3964.
- Ahmad, S. H., Zia, P., Yu, T. J., & Xie, Y. (1994). Punching shear tests of slabs reinforced with 3-dimensional carbon fiber fabric. Concrete international, 16(6), 36-41.
- Akkaya, H. C., Aydemir, C., & Arslan, G. (2022a). An experimental research on reinforced concrete deep beams fully wrapped with fiber reinforced polymers against shear. Case Studies in Construction Materials, 17, e01198.
- Akkaya, H. C., Aydemir, C., & Arslan, G. (2022b). Investigation on shear behavior of reinforced concrete deep beams without shear reinforcement strengthened with fiber reinforced polymers. Case Studies in Construction Materials, 17, e01392.
- Akkaya, H. C., Aydemir, C., & Arslan, G. (2024). Evaluation of shear behavior of short-span reinforced concrete deep beams strengthened with fiber reinforced polymer strips. Engineering Structures, 299, 117145.
- Akkaya, H. C., & Alacalı, S., (2025). Developing a New Model Using Gene Expression Programming on the Prediction of Moment Capacity of Ferrocement Elements. Bitlis Eren Üniversitesi Fen Bilimleri Dergisi, 14(2), 713-731.
- Alacali, S., Akkaya, H. C., Sengun, K., & Arslan, G. (2024). Proposal and evaluation of new models for predicting the FRP contribution to shear strength in reinforced concrete beams using gene expression programming. Neural Computing and Applications, 36(25), 15515-15544.
- Alacali, S., & Arslan, G. (2024). A prediction model for plastic hinge length of rectangular RC columns using gene expression programming. Neural Computing and Applications, 36(16), 9481-9501.
- Alacali, S. (2022). A prediction model for strength and strain of CFRP-confined concrete cylinders using gene expression programming. Computers and Concrete, 30(6), 377-391.
- Alacalı, S., & Arslan, G., (2025). Assessment of shear strength of steel fiber reinforced concrete (SFRC) beams using gene expression programming. Computers and Concrete, 35(5).
- Alateyat, A., Awad, R., Ibrahim, B., Junaid, M. T., Altoubat, S., Maalej, M., & Barakat, S. (2024). Punching shear strength of fiber-reinforced polymer concrete slabs: Database-driven assessment of parameters and prediction models. Engineering Structures, 315, 118511.
- AlHamaydeh, M., & Anwar Orabi, M. (2021). Punching shear behavior of synthetic fiber–reinforced self-consolidating concrete flat slabs with GFRP bars. Journal of Composites for Construction, 25(4), 04021029.
- Alkhawaldeh, S. M. A. (2024). Enhancing flat slab design: machine learning and metaheuristic approaches to predict punching shear strength. Asian Journal of Civil Engineering, 25(3), 2459-2469.
- Almomani, Y., Alawadi, R., Tarawneh, A., Alghossoon, A., & Aldiabat, A. (2024). Punching Shear of FRP-RC Slab–Column Connections: A Comprehensive Database. Journal of Composites Science, 8(4), 145.
- Almusallam, A. A. (2001). Effect of degree of corrosion on the properties of reinforcing steel bars. Construction and building materials, 15(8), 361-368.
- Alrudaini, T. M. S. (2022, March). A rational formula to predict punching shear capacity at interior columns connections with RC flat slabs reinforced with either steel or FRP bars but without shear reinforcement. In Structures (Vol. 37, pp. 56-68). Elsevier.
- Arabshahi, A., Gharaei-Moghaddam, N., & Tavakkolizadeh, M. (2020, February). Development of applicable design models for concrete columns confined with aramid fiber reinforced polymer using Multi-Expression Programming. In Structures (Vol. 23, pp. 225-244). Elsevier.
- Aslam, F., Elkotb, M. A., Iqtidar, A., Khan, M. A., Javed, M. F., Usanova, K. I., & Shamim, H. (2022). Compressive strength prediction of rice husk ash using multiphysics genetic expression programming. Ain Shams Engineering Journal, 13.
- Aval, S. B., Ketabdari, H., & Gharebaghi, S. A. (2017, November). Estimating shear strength of short rectangular reinforced concrete columns using nonlinear regression and gene expression programming. In Structures (Vol. 12, pp. 13-23). Elsevier.
- Awan, H. H., Hussain, A., Javed, M. F., Qiu, Y., Alrowais, R., Mohamed, A. M., ... & Alzahrani, A. M. (2022). Predicting marshall flow and marshall stability of asphalt pavements using multi expression programming. Buildings, 12(3), 314.
- Aydin, M. R., Acar, V., Cakir, F., Gündoğdu, Ö., & Akbulut, H. (2022). Comparative dynamic analysis of carbon, aramid and glass fiber reinforced interply and intraply hybrid composites. Composite Structures, 291, 115595.
- Aydogan, M. S., Alacali, S., & Arslan, G. (2023, January). Prediction of moment redistribution capacity in reinforced concrete beams using gene expression programming. In Structures (Vol. 47, pp. 2209-2219). Elsevier.
- Azim, I., Yang, J., Iqbal, M. F., Javed, M. F., Nazar, S., Wang, F., & Liu, Q. F. (2020, October). Semi-analytical model for compressive arch action capacity of RC frame structures. In Structures (Vol. 27, pp. 1231-1245). Elsevier.
- Badra, N., Haggag, S. A., Deifalla, A., & Salem, N. M. (2022). Development of machine learning models for reliable prediction of the punching shear strength of FRP-reinforced concrete slabs without shear reinforcements. Measurement, 201, 111723.
- Bank, L.C., and Xi, Z., (1995). 43 punching shear behavior of pultruded frp grating reinforced concrete slabs. In Non-Metallic (FRP) Reinforcement for Concrete Structures: Proceedings of the Second International RILEM Symposium; CRC Press: Boca Raton, FL, USA, 1995; Volume 29, p. 360.
- Banthia, N., Al-Asaly, M., & Ma, S. (1995). Behavior of concrete slabs reinforced with fiber-reinforced plastic grid. Journal of materials in civil engineering, 7(4), 252-257.
- Bland, J. M., & Altman, D. G. (1986). Statistical methods for assessing agreement between two methods of clinical measurement. The Lancet, 327(8476), 307–310.
- Blomfors, M., Zandi, K., Lundgren, K., & Coronelli, D. (2018). Engineering bond model for corroded reinforcement. Engineering Structures, 156, 394-410
- Bouguerra, K., Ahmed, E. A., El-Gamal, S., & Benmokrane, B. (2011). Testing of full-scale concrete bridge deck slabs reinforced with fiber-reinforced polymer (FRP) bars. Construction and building materials, 25(10), 3956-3965.
- Cakir, F., Acar, V., Aydin, M. R., Aksar, B., & Yildirim, P. (2021). Strengthening of reinforced concrete beams without transverse reinforcement by using intraply hybrid composites. Case Studies in Construction Materials, 15, e00700.
- Cakir, F., Aydin, M. R., Acar, V., Aksar, B., & Akkaya, H. C. (2023). An experimental study on RC beams shear-strengthened with intraply hybrid U-jackets composites monitored by digital image correlation (DIC). Composite Structures, 323, 117503.
- Canadian Standards Association. (2012). Design and construction of building structures with fibre-reinforced polymers. Canadian Standards Association
- Cevik, A., & Sonebi, M. (2008). Modelling the performance of self-compacting SIFCON of cement slurries using genetic programming technique. Computers and Concrete, 5(5), 475-490.
- Chisari, C., & Bedon, C. (2016). Multi-objective optimization of FRP jackets for improving the seismic response of reinforced concrete frames. American Journal of Engineering and Applied Sciences, 9(3), 669-679.
- Chu, H. H., Khan, M. A., Javed, M., Zafar, A., Khan, M. I., Alabduljabbar, H., & Qayyum, S. (2021). Sustainable use of fly-ash: Use of gene-expression programming (GEP) and multi-expression programming (MEP) for forecasting the compressive strength geopolymer concrete. Ain Shams Engineering Journal, 12(4), 3603-3617.
- Deifalla, A. (2022). Punching shear strength and deformation for FRP-reinforced concrete slabs without shear reinforcements. Case Studies in Construction Materials, 16, e00925.
- Derogar, S., Ince, C., Yatbaz, H. Y., & Ever, E. (2024). Prediction of punching shear strength of slab-column connections: A comprehensive evaluation of machine learning and deep learning based approaches. Mechanics of Advanced Materials and Structures, 31(6), 1272-1290.
- Doğan, G., & Arslan, M. H. (2022). Determination of punching shear capacity of concrete slabs reinforced with FRP bars using machine learning. Arabian Journal for Science and Engineering, 47(10), 13111-13137.
- Dulude, C., Ahmed, E., El-Gamal, S., & Benmokrane, B. (2011). Testing of large-scale two-way concrete slabs reinforced with GFRP bars. In Advances in FRP Composites in Civil Engineering: Proceedings of the 5th International Conference on FRP Composites in Civil Engineering (CICE 2010), Sep 27–29, 2010, Beijing, China (pp. 287-291). Springer Berlin Heidelberg
- Dulude, C., Hassan, M., Ahmed, E. A., & Benmokrane, B. (2013). Punching shear behavior of flat slabs reinforced with glass fiber-reinforced polymer bars. ACI Structural Journal, 110(5), 723.
- Eladawy, M., Hassan, M., & Benmokrane, B. (2019). Experimental Study of Interior Glass Fiber-Reinforced Polymer-Reinforced Concrete Slab-Column Connections under Lateral Cyclic Load. ACI Structural Journal, 116(6).
- Elgabbas, F., Ahmed, E. A., & Benmokrane, B. (2016). Experimental testing of concrete bridge-deck slabs reinforced with basalt-FRP reinforcing bars under concentrated loads. Journal of Bridge Engineering, 21(7), 04016029.
- El-Gamal, S., El-Salakawy, E., & Benmokrane, B. (2005a). Behavior of concrete bridge deck slabs reinforced with fiber-reinforced polymer bars under concentrated loads. ACI Structural Journal, 102(5), 727.
- El-Gamal, S., El-Salakawy, E. F., & Benmokrane, B. (2005b). A new punching shear equation for two-way concrete slabs reinforced with FRP bars. ACI Special publication, 230, 877-894.
- El-Gamal, S., El-Salakawy, E., & Benmokrane, B. (2007). Influence of reinforcement on the behavior of concrete bridge deck slabs reinforced with FRP bars. Journal of Composites for Construction, 11(5), 449-458.
- El-Gendy, M. G., & El-Salakawy, E. F. (2020). Assessment of punching shear design models for FRP-RC slab–column connections. Journal of Composites for Construction, 24(5), 04020047.
- El-Gendy, M. G., & El-Salakawy, E. F. (2014). Punching shear behaviour of GFRP-RC slab-column edge connections. In Proceedings of the Seventh International Conference on FRP Composites in Civil Engineering, Vancouver, BC, Canada, 20−22 August; pp. 1- 6.
- El-Ghandour, A. W., Pilakoutas, K., & Waldron, P. (1999). New approach for punching shear capacity prediction of fiber reinforced polymer reinforced concrete flat slabs. Special publication, 188, 135-144.
- El-Ghandour, A.W., Pilakoutas, K., Waldron, P., (2000). Punching shear behavior and design of FRP RC flat slabs. In Proceedings of theInternational Workshop on Punching Shear Capacity of RC Slabs, Stockholm, Sweden, 1 January 2000.
- El-Ghandour, A. W., Pilakoutas, K., & Waldron, P. (2003). Punching shear behavior of fiber reinforced polymers reinforced concrete flat slabs: Experimental study. Journal of Composites for Construction, 7(3), 258-265.
- El-Tom, E. (2007). Behavior of two-way slabs reinforced with GFRP bars (Doctoral dissertation, Memorial University of Newfoundland).
-
Fallahpour, A., Haji, R., Moradi, M., & Santibanez Gonzalez, E. D. (2021). An evolutionary-based predictive soft computing model for the prediction of electricity consumption using multi expression programming. Journal of Cleaner Production, 281, 125305. https://doi.org/10.1016/j.jclepro.2020.125305
» https://doi.org/10.1016/j.jclepro.2020.125305 - Fang, C., Lundgren, K., Plos, M., & Gylltoft, K. (2006). Bond behaviour of corroded reinforcing steel bars in concrete. Cement and concrete research, 36(10), 1931-1938.
- Fernandez, I., Bairán, J. M., & Marí, A. R. (2015). Corrosion effects on the mechanical properties of reinforcing steel bars. Fatigue and σ–ε behavior. Construction and Building Materials, 101, 772-783.
- Ferreira, C. (2001). Gene expression programming: A new adaptive algorithm for solving problems. Complex Systems, 13(2), 87–129.
- Gandomi, A. H., Alavi, A. H., Mirzahosseini, M. R., & Nejad, F. M. (2011). Nonlinear genetic-based models for prediction of flow number of asphalt mixtures. Journal of Materials in Civil Engineering, 23(3), 248–263.
- Gandomi, A. H., Faramarzifar, A., Rezaee, P. G., Asghari, A., & Talatahari, S. (2015). New design equations for elastic modulus of concrete using multi expression programming. Journal of Civil Engineering and Management, 21(6), 761-774.
- Gepsoft GeneXproTools 5.0. (2025). Data modeling and analysis software
- Gouda, A., & El-Salakawy, E. (2016). Behavior of GFRP-RC interior slab-column connections with shear studs and high-moment transfer. Journal of Composites for Construction, 20(4), 04016005.
- Hassan, M., Ahmed, E. A., & Benmokrane, B. (2013a). Punching shear strength of glass fiber-reinforced polymer reinforced concrete flat slabs. Canadian Journal of Civil Engineering, 40(10), 951-960.
- Hassan, M., Ahmed, E., & Benmokrane, B. (2013b). Punching-shear strength of normal and high-strength two-way concrete slabs reinforced with GFRP bars. Journal of composites for construction, 17(6), 04013003.
- Hassan, M., Ahmed, E. A., & Benmokrane, B. (2014). Punching-shear design equation for two-way concrete slabs reinforced with FRP bars and stirrups. Construction and Building Materials, 66, 522-532.
- Hassan, M., Fam, A., Benmokrane, B., & Ferrier, E. (2017). Effect of column size and reinforcement ratio on shear strength of glass fiber-reinforced polymer reinforced concrete two-way slabs. ACI Structural Journal, 114(4), 937-950.
- Hemzah, S. A., Al-Obaidi, S., & Salim, T. (2019). Punching Shear Model for Normal and High-Strength Concrete Slabs Reinforced with CFRP or Steel Bars. Jordan Journal of Civil Engineering, 13(2).
- Hussein, A. H., & El-Salakawy, E. F. (2018). Punching Shear Behavior of Glass Fiber-Reinforced Polymer-Reinforced Concrete Slab-Column Interior Connections. ACI Structural Journal, 115(4).
- Hussein, A., Rashid, I., Benmokrane, B. (2004). Two-way concrete slabs reinforced with GFRP bars. In Proceedings of the 4th International Conference on Advanced Composite Materials in Bridges and Structures, Calgary, AB, Canada, 20–23 July 2004; pp. 20–23.
- Iftikhar, B., Alih, S. C., Vafaei, M., Elkotb, M. A., Shutaywi, M., Javed, M. F., & Miah, M. J. (2022). Predictive modeling of compressive strength of sustainable rice husk ash concrete: Ensemble learner optimization and comparison. Journal of Cleaner Production, 348.
- Inqiad, W. B., Siddique, M. S., Alarifi, S. S., Butt, M. J., Najeh, T., & Gamil, Y. (2023). Comparative analysis of various machine learning algorithms to predict 28-day compressive strength of Self-compacting concrete. Heliyon, 9(11).
- Jacobson, D. A., Bank, L. C., Oliva, M. G., & Russell, J. S. (2005, October). Punching shear capacity of double layer FRP grid reinforced slabs. In Proc., 7th International Conference on Fiber Reinforced Plastics for Reinforced Concrete Structures (pp. 857-871).
- Jin, C., Qian, Y., Khan, S. A., Ahmad, W., Althoey, F., Alotaibi, B. S., & Abuhussain, M. A. (2023). Investigating the feasibility of genetic algorithms in predicting the properties of eco-friendly alkali-based concrete. Construction and Building Materials, 409, 134101.
- JSCE, (1997) Recommendation for design and construction of concrete structures using continuous fiber reinforcing materials. Tokyo, Japan: Japan Society of Civil Engineers (JSCE); 1997.
- Ju, M., Park, K., & Park, C. (2018). Punching shear behavior of two-way concrete slabs reinforced with glass-fiber-reinforced polymer (GFRP) bars. Polymers, 10(8), 893.
- Ju, M., Ju, J. W. W., & Sim, J. (2021). A new formula of punching shear strength for fiber reinforced polymer (FRP) or steel reinforced two-way concrete slabs. Composite Structures, 259, 113471.
- Jumaa, G. B., & Yousif, A. R. (2018). Predicting shear capacity of FRP‐reinforced concrete beams without stirrups by artificial neural networks, gene expression programming, and regression analysis. Advances in civil engineering, 2018(1), 5157824.
- Junaid, M. T., Awad, R., Barakat, S., & Metawa, A. (2024). Effect of column dimension on the punching shear capacity of concrete slabs reinforced with GFRP bars. In E3S Web of Conferences (Vol. 586, p. 04003). EDP Sciences.
- Kang, T. H., & Wallace, J. W. (2006). Punching of reinforced and post-tensioned concrete slab-column connections. ACI Structural Journal, 103(4), 531.
- Kara, I. F., & Sinani, B. (2016). Prediction of punching shear capacity of two-ways FRP reinforced concrete slabs.
- Keskin, R. S. O., Arslan, G., & Sengun, K. (2017). Influence of CFRP on the shear strength of RC and SFRC beams. Construction and Building Materials, 153, 16-24.
- Khan, M. A., Javed, M. F., Vafaei, M., Alih, S. C., & Elkotb, M. A. (2021). Compressive strength of fly-ash-based geopolymer concrete by gene expression programming and random forest. Advances in Civil Engineering, 2021, 1–17.
- Khan, M., Khan, A., Khan, A. U., Shakeel, M., Khan, K., Alabduljabbar, H., ... & Gamil, Y. (2024). Intelligent prediction modeling for flexural capacity of FRP-strengthened reinforced concrete beams using machine learning algorithms. Heliyon, 10(1).
- Kim, J. W., Lee, C. H., & Kang, T. H. K. (2014). Shearhead Reinforcement for Concrete Slab to Concrete-Filled Tube Column Connections. ACI Structural Journal, 111(3).
- Kurtoğlu, A. E., Bilgehan, M., Gülşan, M. E., & Çevik, A. (2023). Experimental and Theoretical Investigation of the Punching Shear Strength of GFRP-Reinforced Two-Way Slabs. Structural Engineering International, 33(3), 379-388.
- Lee, J. H., Yoon, Y. S., Cook, W. D., & Mitchell, D. (2009). Improving punching shear behavior of glass fiber-reinforced polymer reinforced slabs. ACI Structural journal, 106(4), 427.
- Lee, J. H., Yang, J. M., & Yoon, Y. S. (2010). Rational prediction of punching shear strength of slabs reinforced with steel or FRP bars. Magazine of Concrete Research, 62(11), 821-830.
- Louka, H.J. (1999). Punching Behaviour of a Hybrid Reinforced Concrete Bridge Deck. Master’s Thesis, University Manitoba, Winnipeg, MB, Canada.
- Mahmoud, A., Mostafa, H., Mostafa, T., & Khater, A. (2024). Enhancement of punching shear behavior of reinforced concrete flat slabs using GFRP grating. Fracture and Structural Integrity, 18(68), 19-44.
- Matthys, S., & Taerwe, L. (2000). Concrete slabs reinforced with FRP grids. II: Punching resistance. Journal of Composites for Construction, 4(3), 154-161.
- Metwally, I. M. (2013). Prediction of punching shear capacities of two-way concrete slabs reinforced with FRP bars. HBRC Journal, 9(2), 125-133.
- Momani, Y., Alawadi, R., Jweihan, Y. S., Tarawneh, A. N., Al-Kheetan, M. J., & Aldiabat, A. (2024). Machine learning-based evaluation of punching shear resistance for steel/FRP-RC slabs. Ain Shams Engineering Journal, 15(5), 102668.
- Murad, Y. Z. (2020). Prediction model for concrete carbonation depth using gene expression programming. Computers and Concrete, An International Journal, 26(6), 497-504.
- Murad, Y. Z., Hunifat, R., & Wassel, A. B. (2020). Interior reinforced concrete beam-to-column joints subjected to cyclic loading: Shear strength prediction using gene expression programming. Case Studies in Construction Materials, 13, e00432.
- Murad, Y., Tarawneh, A., Arar, F., Al-Zu'bi, A., Al-Ghwairi, A., Al-Jaafreh, A., & Tarawneh, M. (2021, October). Flexural strength prediction for concrete beams reinforced with FRP bars using gene expression programming. In Structures (Vol. 33, pp. 3163-3172). Elsevier.
- Nguyen-Minh, L., & Rovňák, M. (2013). Punching shear resistance of interior GFRP reinforced slab-column connections. Journal of Composites for Construction, 17(1), 2-13.
- Oltean, M., & Dumitrescu, D. (2002). Multi expression programming. Journal of Genetic Programming and Evolvable Machines.
- Ospina, C. E., Alexander, S. D., & Cheng, J. R. (2003). Punching of two-way concrete slabs with fiber-reinforced polymer reinforcing bars or grids. Structural Journal, 100(5), 589-598.
- Patel, R. (2019, September). Prevention of corrosion of steel reinforcement in concrete. In AIP Conference Proceedings (Vol. 2158, No. 1). AIP Publishing.
- Salama, T. A. E. M. (2009). Punching Behavior and Strength of Two-Way Concrete Slabs Reinforced with Glass Fiber Polymer (GFRP) Rebars. Faculty of Engineering, Alexandria University.
- Salama, A. E., Hassan, M., & Benmokrane, B. (2021). Punching-Shear Behavior of Glass Fiber-Reinforced Polymer-Reinforced Concrete Edge Column-Slab Connections: Experimental and Analytical Investigations. ACI Structural Journal, 118(3).
- Salihi, B., & Hamad, F. (2023). Two-way slab punching shear resistance: experimental insights into basalt-FRP bar as flexural reinforcement. Sustainability, 15(21), 15417.
- Salihi, B. H. H., & Hamad, F. S. (2024). ANN and Gradient Boosting-Based Predictive Techniques for Punching Shear Capacity of Concrete Slabs Reinforced with FRP Bars. Iranian Journal of Science and Technology, Transactions of Civil Engineering, 1-17.
- Sengun, K., & Arslan, G. (2022, June). Parameters affecting the behaviour of RC beams strengthened in shear and flexure with various FRP systems. In Structures (Vol. 40, pp. 202-212). Elsevier.
- Sengun, K., & Arslan, G. (2024). Performance of RC beams strengthened in flexure and shear with CFRP and GFRP. Iranian Journal of Science and Technology, Transactions of Civil Engineering, 48(1), 117-130
- Smith, J. L., & Virmani, Y. P. (2000). Materials and methods for corrosion control of reinforced and prestressed concrete structures in new construction (No. FHWA-RD-00-081). United States. Federal Highway Administration.
- Tarawneh, A., & Majdalaweyh, S. (2020, December). Design and reliability analysis of FRP-reinforced concrete columns. In Structures (Vol. 28, pp. 1580-1588). Elsevier.
- Tomlinson, D., & Fam, A. (2015). Performance of concrete beams reinforced with basalt FRP for flexure and shear. Journal of composites for construction, 19(2), 04014036.
- Truong, G. T., Choi, K. K., & Kim, C. S. (2022a). Punching shear strength of interior concrete slab-column connections reinforced with FRP flexural and shear reinforcement. Journal of Building Engineering, 46, 103692.
- Truong, G. T., Hwang, H. J., & Kim, C. S. (2022b). Assessment of punching shear strength of FRP-RC slab-column connections using machine learning algorithms. Engineering Structures, 255, 113898.
- Xu W. & Shi X. (2024). Machine-learning-based predictive models for punching shear strength of FRP-reinforced concrete slabs: a comparative study. Buildings, 14:2492.
- Yan, J., Su, J., Xu, J., Hua, K., Lin, L., & Yu, Y. (2024). Explainable machine learning models for punching shear capacity of FRP bar reinforced concrete flat slab without shear reinforcement. Case Studies in Construction Materials, 20, e03162.
- Zaghloul, A.E. and Razaqpur, A.G., (2003). Punching shear behavior of CFRP reinforced concrete flat plates, in: D. Bruno, G. Spadea, R.N. Swamy (Eds.), Proceedings of the International Conference on Composites in Construction, 2003, 1–726.
- Zaghloul E.E.R., Mahmoud, Z.I., Salama, T.A., (2007). Punching behavior and strength of two-way concrete slabs reinforced with glass fiber reinforced polymer (GFRP) rebars, in: Proceedings of the Structural Composites for Infrastructure Applications, Hurghada, Egypt, 2008, 1–16.
- Zaki, A., Megat Johari, M. A., Wan Hussin, W. M. A., & Jusman, Y. (2018). Experimental assessment of rebar corrosion in concrete slab using ground penetrating radar (GPR). International Journal of Corrosion, 2018(1), 5389829.
- Zhang, Q., Marzouk, H., Hussein, A. (2005, June) A preliminary study of high-strength concrete two-way slabs rein-forced with GFRP bars.In Proceedings of the 33rd CSCE Annual Conference: General Conference and International History Symposium, Toronto, ON, Canada, 2–4 June 2005; pp. 1–10.
- Zhang, Q. (2006). Behaviour of Two-way Slabs Reinforced with CFRP Bars. Master’s Thesis, Memorial University of Newfoundland, St.John’s, NF, Canada.
- Zhang, Q., Meng, X., Yang, B., & Liu, W. (2016). MREP: Multi-reference expression programming. In Intelligent Computing Theories and Application: 12th International Conference, ICIC 2016, Lanzhou, China, August 2-5, 2016, Proceedings, Part II 12 (pp. 26-38). Springer International Publishing.
- Zhang, R., & Xue, X. (2022). Determining ultimate bearing capacity of shallow foundations by using multi expression programming (MEP). Engineering Applications of Artificial Intelligence, 115, 105255.
- Zhang, Z., & Huo, Y. (2024). Fatigue Life Prediction Model of FRP–Concrete Interface Based on Gene Expression Programming. Materials, 17(3), 690.
- Zhu, H. T., Wang, Y.Z., Li, J.Z., (2012). Plastic analysis on punching shear capacity of two-way BFRP rebar reinforced concrete slabs under central concentrated load. J. Zhengzhou Univ. (Eng. Sci.) 2012, 33, 1–5. (In Chinese)
Edited by
-
Editor:
Pablo Andrés Muñoz Rojas
Research data is available in the body of the article