Photoluminescence of Copper(I) 4,7-Dichloroquinoline Complexes: A Combined Experimental and Theoretical Perspective
Abstract
Polymeric [CuX1(DCQ)]n (DCQ = 4,7-dichloroquinoline, X1 = Cl, Br, I) and dimeric [CuX2(DCQ)(PPh3)]2 (PPh3 = triphenylphosphine, X2 = Cl, Br) complexes were synthesized and characterized by powder X-ray diffraction (PXRD), single crystal X-ray diffraction (SCXRD), spectroscopy, and analytical methods. In the solid state, the photophysical response varied with the halide, with emission colors spanning red to yellow and showing measurable halide-dependent changes in emission energy (EPL), Stokes shift, photoluminescence quantum yield (ΦPL), and average lifetime (τ). Time-resolved measurements revealed millisecond lifetimes, suggesting the participation of long-lived excited states with charge transfer (CT) character. Density functional theory (DFT) calculations were consistent with low-energy excited states with mixed metal-to-ligand (MLCT), metal/halide-to-ligand charge-transfer ((MX)LCT) and ligand-ligand charge transfer (LLCT) characters and singlet-triplet energy state that could facilitate the intersystem crossing (ISC) within qualitative framework. Emissions of the five copper(I) complexes were observed in the solid-state, whereas no measurable luminescence was observed in common solvents. Overall, the photoluminescence reflected the combined influence of the CuI coordination environment, halide identity, and solid-state structural constraints.
Keywords:
copper(I) complexes; photoluminescence; charge-transfer excited states; halide effects; 4,7-dichloroquinoline
Introduction
Photoluminescent CuI coordination compounds are widely studied for their visible emission and potential in optoelectronics, sensing, imaging, and security technologies.1-5 Since copper(I) ion has closed-shell d10 configuration, emission typically arises from charge transfer (CT) or cluster-centered excited states rather than metal-centered ones. The energies of these states are sensitive to the coordination environment, nuclearity, and ligand identity, which in turn govern excited-state stabilization and the extent of structural distortion upon excitation.6
As a result, the photophysical properties of copper(I) complexes are shaped by their molecular and supramolecular structures: changes in coordination number and geometry7,8 influence excited-state stabilization and the extent of structural distortion upon excitation.9 In CuI halide coordination compounds, solid-state photophysics is tightly coupled to structure, largely because these systems are structurally diverse. This diversity reflects both the ability of CuI centers to adopt coordination numbers from two to four and the versatility of halides, which can bind terminally or bridge in µ2-, μ4-, and higher-nuclearity modes.10 Accordingly, multiple structural features may matter: in polynuclear systems, short Cu···Cu separations are often cited to rationalize low-energy excited states,11,12 while lattice rigidity and supramolecular packing can govern how much structural reorganization occurs upon excitation.8,13
The presence of copper and coordinated halides is commonly associated with appreciable Spin-Orbit Coupling (SOC), which can facilitate InterSystem Crossing (ISC) and may facilitate access to triplet excited-state emission with metal-to-ligand (MLCT) and metal/halide-to-ligand charge-transfer ((MX)LCT) characters.13 These states are highly sensitive to local structure, and, therefore, the solid-state photoluminescence often differ considerably of ones from solution.13 In this context, the coordinating ligands are an important factor in shaping the electronic structure, supramolecular organization, and emissive behavior of copper(I) complexes.14
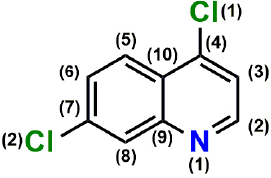
Quinoline-based ligands are attractive building blocks for copper(I) coordination compounds, owing to their π-conjugated framework, which supports efficient charge transport, thermal stability, and strong photoluminescence.15 Among them, halogenated derivatives such as 4,7-dichloroquinoline (DCQ; Figure 1) offer a convenient way to tune electronic density and coordination behavior. The 4,7-chloro substituents increase the electron-withdrawing character of the quinoline ring, stabilizing π* orbitals and shifting ligand-centered and CT transitions to lower energies.16 They can also influence molecular packing and, in turn, the emissive response.16 Accordingly, DCQ-based systems provide a convenient platform to tune structural and photophysical features by substituent effects that shape the MLCT/(MX)LCT balance, as shown in recent studies on modified quinoline cores.17

Numbered 4,7-dichloroquinoline (DCQ) molecule for structural purposes. The hydrogen atoms were omitted.
As well, phosphine compounds can stabilize CuI complexes both structurally and electronically and have been linked to excited-state pathways that are compatible with ligand-to-ligand charge-transfer (LLCT) contributions, which may improve radiative efficiency and emission lifetimes.18,19 Phosphine-containing CuI halide emitters have, therefore, drawn growing interest because metal-ligand interactions allow their photoluminescence to be tuned. For example, phosphine-based copper(I) complexes show halide-dependent emission in the 650 700 nm range (Cl, Br, I),18,20 and related systems have reached external quantum efficiencies of up to 14.6% depending on halide identity.21 These reports suggest that metal-ligand interactions can shape the photoluminescent response and inform the design of photoactive materials.
Herein, we report the synthesis, full characterization and photophysical studies of two closely related classes of copper(I) complexes based on the DCQ ligand: ladder-type CuX coordination polymers and discrete µ2 halide-bridged dimers incorporating PPh3. By combining solid-state photophysics with crystallographic analysis (including powder X-ray diffraction (PXRD), and Rietveld refinement for the polycrystalline compounds) and qualitative time-dependent density functional theory (TD-DFT) calculations, we evaluate the extent to which commonly invoked descriptors capture photoluminescence trends in CuI halide-quinoline solids. The outcomes suggest that emission energies, Stokes shifts, and quantum yields cannot be consistently rationalized by a single geometric parameter (e.g., Cu···Cu separation) or by halide identity alone. Instead, the emissive response reflects the combined influence of halide, coordination motif, and solid-state structural constraints, providing a more nuanced basis for interpreting structure-property relationships in CuI quinoline materials.
Experimental
Synthesis
The general procedures for the synthesis of the copper(I) complexes are illustrated in Scheme 1. All reagents and solvents were obtained from commercial sources and employed without further purification.

Syntheses of copper(I) complexes. Acetonitrile (CH3CN) is used in all routes as solvent. All synthesis routes were carried out under ambient atmosphere.
Synthesis of complexes (1-3)
A solution of copper(I) halide, CuX1, X1 = Cl, Br, I (1.00 mmol), dissolved in 10 mL of CH3CN, was added dropwise to a solution containing 2.00 mmol (0.396 g) of DCQ (10 mL of CH3CN). The resulting solutions were stirred for 10 min at room temperature (RT) and then left to stand. After three days, yellow polycrystalline materials were obtained for all three reactions. The solids were collected by filtration, washed with CH3CN and methanol (CH3OH), and dried under ambient air. Part of the polycrystalline products from complexes (1 3) was redissolved in 30 mL of CH3CN; however, only complex (1) afforded orange needle-like single crystals, which formed after one day. The crystalline materials were ground and used for spectroscopic, conductivity, and elemental analyses. Complexes (1-3) show poor solubility in chloroform (CHCl3) and dichloromethane (CH2Cl2), whereas they are readily soluble in CH3CN, in which the CuI oxidation state remains stable for at least 96 h. Notably, solubilization in CH3CN is consistent with disruption (depolymerization) of the coordination polymer, and therefore the species present in solution are not expected to be identical to the solid-state compounds. For this reason, solution spectroscopic measurements were not pursued, as they would probe solvated/altered species rather than the structurally characterized solids. In dimethyl sulfoxide (DMSO), the complexes are also soluble; however, CuI disproportionation is observed within ca. 5 min. The stability of the CuI oxidation state in solution was monitored by molar conductivity measurements.
Synthesis of complexes (4) and (5)
A solution of copper(I) halide, CuX2, X2 = Cl, Br (1.00 mmol), dissolved in 10 mL of CH3CN, was added dropwise to DCQ solution (1.00 mmol, 0.198 g), dissolved in 10 mL of CH3CN. The final solution was stirred for 10 min at RT, after which a solution of PPh3 (1.00 mmol, 0.156 g) in 5 mL of CH3CN was added dropwise. The reaction mixture was stirred for an additional 10 min at RT. The final solution was kept standing and yellow hexagonal crystals of complexes (4) and (5) were obtained after one week. The crystals were ground and used for spectroscopy, conductivity, and elemental analyses. The chemical stabilities in solution of complexes (4) and (5) were examined by ultraviolet-visible (UV-Vis) spectroscopy in CHCl3, CH2Cl2, and CH3CN, and by 1H and 31P{1H} nuclear magnetic resonance (NMR) spectroscopy recorded exclusively in deuterated chloroform (CDCl3). Complementary molar conductivity measurements were carried out in all solvents, including DMSO, and indicate that complexes (4) and (5) retain the CuI oxidation state for at least 96 h in solution. Reactions performed using CuI yielded a mixture of complex (3) and Cu2I2(PPh3)3.
Data for complex (1)
Yield 62% (0.184 g); Tonset 140 °C; Fourier-transform infrared (FTIR) (attenuated total reflectance (ATR)) ν / cm-1 1598 ν(CC+CN), 1083 (νCCl+dCH)in plane; UV-Vis (diffuse reflectance) λ / nm 260-340 (π-π*) DCQ, 340-600 ((MX)LCT/MLCT); anal. calcd. for C9H5CuCl3N: C 36.39, H 1.70, N 4.72, found: C 36.52, H 1.66, N 4.60.
Data for complex (2)
Yield 50% (0.171 g); Tonset 137 °C; FTIR (ATR) ν / cm-1 1594 ν(CC+CN), 1080 (νCCl+dCH)in plane; UV-Vis (diffuse reflectance) λ / nm 260-340 (π-π*) DCQ, 340-600 ((MX)LCT/MLCT); anal. calcd. for C9H5CuBrCl2N: C 31.65, H 1.48, N 4.10, found: C 31.54, H 1.42, N 4.30.
Data for complex (3)
Yield 71% (0.276 g); Tonset 129 °C; FTIR (ATR) ν / cm-1 1593 ν(CC+CN), 1080 (νCCl+dCH)in plane; UV-Vis (diffuse reflectance) λ / nm 260-340 (π-π*) DCQ, 340-600 ((MX)LCT/MLCT); anal. calcd. for C9H5CuICl2N: C 27.82, H 1.30, N 3.61, found: C 27.93, H 1.23, N 3.86.
Data for complex (4)
Yield 35% (0.391 g); Tonset 108 °C; FTIR (ATR) ν / cm-1 1573 ν(CC+CN), 1080 (νCCl+dCH)in plane, 1028 τ(PPh3); FT Raman ν / cm-1 1563 ν(CC+CN), 1079 (νCCl+dCH)in plane, 1028 τ(PPh3), 524 ν(CuP), 204 ν(CuN); 1H NMR (500 MHz, CDCl3) d 8.96 (d, 1H, J 5.1, H(2)), 8.30 (d, 1H, J 2.0, H(8)), 8.13 (d, 1H, J 8.9, H(5)), 7.55 (dd, 1H, J 9.2, 1.8, H(6)), 7.56 (m, 6H, H(12)), 7.30 (t, 3H, J 7.4, H(14)) 7.21 (t, 6H, J 7.6, H(13)); 13C{1H} NMR (125 MHz, CDCl3) d 151.63 C(2), 149.01 C(9), 143.09 C(4), 136.80 C(7), 134.05 (d, J 13.90, C(12)), 132.85 (d, J 32.50, C(11)), 129.82 C(14), 128.88 C(6)/C(8), 128.61 (d, J 8.20, C(13), 125.65 C(5), 125.27 C(10), 121.64 C(3); 31P{1H} NMR (202 MHz, CDCl3) d -3.98 P; UV Vis (CH3CN) (ε, M-1 cm-1) λ / nm 321 (π-π*) (18895); UV Vis (CH2Cl2) (ε, M-1 cm-1) λ / nm 322 (π-π*) (47343), 360 ((MX)LCT/MLCT) (3803); UV-Vis (CHCl3) (ε, M-1 cm-1) λ / nm 323 (π-π*) (63344), 360 ((MX)LCT/MLCT) (4099); UV Vis (diffuse reflectance) λ / nm 260-340 (π-π*) DCQ/PPh3, 340-600 ((MX)LCT/MLCT/LLCT); anal. calcd. for C54H40Cu2Cl6N2P2: C 57.98, H 3.60, N 2.50, found: C 57.97, H 3.61, N 2.55.
Data for complex (5)
Yield 30% (0.362 g); Tonset 107 °C; FTIR (ATR) λ / cm-1 1573 ν(CC+CN), 1080 (νCCl+dCH)in plane, 1028 τ(PPh3); FT Raman λ / cm-1 1562 ν(CC+CN), 1079 (νCCl+dCH)in plane, 1030 τ(PPh3), 524 ν(CuP), 204 ν(CuN), 187 ν(CuCl); 1H NMR (500 MHz, CDCl3) d 8.92 (d, 1H, J 4.8, H(2)), 8.27 (s, 1H, H(8)), 8.14 (d, 1H, J 8.9, H(5)), 7.56 (d, 1H, J 9.2, H(6)), 7.46 (m, 6H, H(12)) 7.30 (t, 3H, J 7.6, H(14), 7.21 (t, 6H, J 7.6, H(13)); 13C{1H} NMR (125 MHz, CDCl3) d 151.59 C(2), 149.11 C(9), 143.05 C(4), 136.76 C(7), 134.11 (d, J 13.90, C(12)), 132.73 (d, J 32.50, C(11)), 129.80 C(14), 128.87 C(6)/C(8), 128.58 (d, J 8.20 Hz, C(13)), 125.67 C(5), 125.21 C(10), 121.59 C(3); 31P{1H} NMR (202 MHz, CDCl3) d -5.05 P; UV-Vis (CH3CN) (ε, M-1 cm-1) λ / nm 321 (π-π*) (77342); UV-Vis (CH2Cl2) (ε, M-1 cm-1) λ / nm 322 (π-π*) (75745), 360 ((MX)LCT/MLCT) (1218); UV-Vis (CHCl3) (ε, M-1 cm-1) λ / nm 323 (π-π*) (64057), 360 ((MX)LCT/MLCT) (3949); UV-Vis (diffuse reflectance) λ / nm 260-340 (π-π*) DCQ/PPh3, 340-600 ((MX)LCT/MLCT/LLCT); anal. calcd. for C54H40Cu2Br2Cl4N2P2: C 52.71, H 3.34, N 2.32, found: C 52.70, H 3.35, N 2.50.
Physical measurements
Attenuated total reflectance Fourier-transform infrared (FTIR) spectra were acquired on a Bruker Vertex 70 spectrophotometer equipped with diamond ATR accessory (4000-400 cm-1, 4 cm-1 resolution, 1024 scans) at 298 K for all compounds. Fourier-transform Raman (FT Raman) spectra were recorded on a Bruker RFS 100 FT-Raman spectrophotometer using an Nd:YAG laser (λ = 1064 nm; 4000-50 cm-1, 4 cm-1 resolution, 10 mW, 1024 scans) at 298 K for complexes (4) and (5). Spectral data from FTIR and FT Raman were exported and analyzed, and the figures were prepared using OriginPro 2019b (OriginLab Corporation, Northampton, MA, USA).
1H, 13C{1H}, and 31P{1H} NMR spectra were recorded on a Bruker Avance III HD 500 MHz spectrometer in CDCl3 at 298 K, using ca. 20 mg of sample. Chemical shifts (d) are reported in ppm and referenced to tetramethylsilane (TMS). Coupling constants (J) are given in Hz, and resonances are reported as d (doublet), dd (doublet of doublets), t (triplet), and m (multiplet). NMR spectra were processed and analyzed, and the figures were prepared in MestReNova v14.1.2-25024 (Mestrelab Research, Santiago de Compostela, Spain).
Electronic absorption spectra were collected on an Ocean Optics USB2000 fiber-optic spectrophotometer coupled to a DH-2000-BAL deuterium-halogen light source (200-1100 nm) at 298 K using a quartz cuvette (1 cm, 2 mL) (integration time: 100 ms). Measurements were performed in CH3CN, CH2Cl2, and CHCl3 at two concentrations: 1.28 × 10⁻⁵ and 3.00 × 10⁻⁴ mol L-1. Diffuse reflectance UV-Vis spectra were obtained on an Ocean Optics USB2000 fiber-optic spectrophotometer with a deuterium-halogen light source over the 200 1100 nm range at 298 K (integration time: 100 ms). Solid samples were gently macerated prior to analysis to ensure homogeneous packing. Barium sulphate (BaSO4) was used as the reflectance standard, and ca. 20 mg of each complex was used for the measurements. Electronic absorption and diffuse reflectance UV-Vis spectra were exported and analyzed, and the figures were prepared in OriginPro 2019b.
Photoluminescence spectra were recorded at 298 K on a Horiba FluoroMax Plus spectrofluorometer equipped with a 150 W continuous-output ozone-free xenon lamp. Prior to measurement, solid samples were gently macerated to ensure homogeneous packing; ca. 400 mg of each complex was used for solid-state measurements. Solid-state photoluminescence quantum yield (ΦPL) was determined using an integrating sphere under ambient atmosphere. Spectroscopic data were exported and analyzed, and the figures were prepared using OriginPro 2019b. Solution-phase photoluminescence measurements were performed only for complexes (4) and (5) in CH2Cl2, CHCl3 and CH3CN, using 3.00 × 10⁻⁴ mol L-1 solutions prepared by dissolving 1.00 × 10⁻³ mol L-1 of each complex in 3.5 mL of solvent (at 298 K, 1 cm quartz cuvette).
Emission lifetimes were obtained from time-resolved photoluminescence decay profiles recorded in the solid-state at 298 K under pulsed UV excitation using gated (delay-time) detection method with successive delay increments of 50 ms. Decay curves were fitted to biexponential model, I(t) = I0 + A1e(-t/τ1) + A2e(-t/τ2), where τi are the decay lifetimes, Ai are pre-exponential factors, and I0 is the baseline intensity. Average lifetimes (<τ>) were calculated using both amplitude-weighted and intensity-weighted formalisms. Fits provided high correlation coefficients (R2 ≥ 0.998). The optical band gap () was estimated from the absorption onset wavelength (λonset) by linear extrapolation of the lowest-energy absorption edge (Supplementary Information (SI) section, Figures S51-S55). Definitions and equations for , EPL, ΔE, and <τ>, as well as the corresponding figures and tables, are provided in the SI section (Figures S83-S100, equations S1-S4, Table S13). Emission lifetimes and spectroscopic data were exported and processed in OriginPro 2019b, which was also used for figure preparation.
Steady-state excitation/emission measurements were performed for complexes (1-5) in the solid state and, for (4) and (5), also in solution (CH3CN, CH2Cl2, and CHCl3). Excitation spectra were collected over 200-450 nm and emission spectra over 450-800 nm, using λexc = 370 nm for all samples (as the excitation maximum used in the delayed/decay experiments). For solids, slit widths were set between 0.5-2.0 nm (excitation and emission) and 2.0-10.0 nm (decay by delay), with integration time of 0.1 s; for solutions, the excitation slit was 1.0 nm and the integration time was 0.5 s. The excitation and emission monochromators employed gratings of 1200 lines mm-1 (330 nm blaze) and 1200 lines mm-1 (500 nm blaze), respectively. All instrumental settings and acquisition parameters described in this paragraph are summarized in the SI section (Table S13).
Thermal stability for complexes (1-5) and the onset decomposition temperature (Tonset) were evaluated using a Shimadzu DTG-60 thermobalance with TA-60WS software under dynamic N2 flow (100 mL min-1) from 299 to 623 K at a heating rate of 10 K min-1, and the plots were exported and finalized in OriginPro 2019b. Elemental analyses (CHN) were performed using a PerkinElmer Series II 2400 CHNS/O analyzer.
Molar conductivity (ΛM) measurements were carried out using an MS Tecnopon mCA 150 conductometer with a platinum electrode (cell constant K = 1 cm-1), calibrated with KCl standard solution (146.9 mS cm-1 ± 0.5% at 298 K). Complexes (1-3) were measured in CH3CN only (1.00 × 10⁻³ mol L-1), whereas complexes (4) and (5) were measured in CH3CN, DMSO, CH2Cl2, and CHCl3 (1.00 × 10⁻³ mol L-1). Measurements were performed over 96 h at defined intervals.
Single crystal X-ray diffraction (SCXRD) studies
SCXRD data of complexes (1, 4 and 5) were collected using an Agilent SuperNova diffractometer equipped with either Cu Kα (λ = 1.54059 Å) or Mo Kα (λ = 0.71073 Å) radiation sources. Data integration and intensity scaling were performed using the CrysAlis PRO software, version 1.171.41.93a (Rigaku Oxford Diffraction, 2020). The crystal structures were solved via the intrinsic phasing method using SHELXT 2018/222 (University of Göttingen; Göttingen, Germany, 2015) and refined by full matrix least squares on F2 with SHELXL 2018/3 (University of Göttingen).23 Crystallographic structures shown in “Structural studies of complexes (1 5)” sub-section were generated using OLEX2 version 1.3 (OlexSys Ltd., Durham, UK, 2009).24 Additional illustrations presented as SI section (Figures S61-S64, S75-S82 and Tables S6, S11, S12) were produced with the POV-Ray rendering tool integrated into Mercury version 2022.3.0 (CCDC, Cambridge, UK, 2020).25
PXRD structural characterization
Obtained crystals of complexes (2) and (3) were not suitable for full single crystal XRD analysis. However, approximate triclinic unit cell parameters could be obtained. Subsequently, PXRD techniques were employed to determine the structural features of the polycrystalline materials. Complete diffraction patterns were collected using a Bruker AXS D8 da Vinci diffractometer. Crystallographic models of (2) and (3) were determined and refined using advanced laboratory powder diffraction methods.26,27 Briefly, crystals of (2) or (3) were gently ground in agate mortar to obtain fine powder, which was then mounted onto low background glass sample holder free of Bragg reflections. Data acquisition was performed overnight in the 5-105° 2θ range, with 0.02° step size. The D8 da Vinci diffractometer is equipped with Ni filtered Cu Kα radiation and Lynxeye linear position sensitive detector. The following optical were used: primary beam Soller slit (2.94°), fixed divergence slit (0.3°), and anti-scatter slit (8.09 mm). Operating conditions were 40 kV and 40 mA. The unit cell parameters were refined within the 4-50° 2θ range using the Pawley method,28 without structural constraints. Space group P212121 was adopted for complex (2), and P21/n for complex (3), yielding satisfactory refinement indicators: weighted profile factor (Rwp) = 0.058 and 0.105, respectively. Structure solution was successively performed via simulated annealing,29 implemented in the TOPAS Academic v4.2 (Bruker AXS: Karlsruhe, Germany, 2009).30 In these models, the copper(I) and halide ions were treated as freely floating species within the unit cell. The DCQ ligand was introduced as rigid body, modelled using the Z-matrix formalism based on available SCXRD data,31 and defined with six degrees of freedom (three translational and three rotational). Final structural refinement was conducted using the Rietveld method,32 incorporating background via Chebyshev polynomial function and refinements of optical and unit cell parameters. Rigid body constraints applied during the solution step were retained throughout refinement step. Isotropic displacement parameters (Beq) were assigned to all light atoms, while copper(I) and halide atoms were refined with Beq + 2.0 Å2. Final Rietveld plots are provided as SI section (Figures S69 and S74).
DFT studies
Time-Dependent Density Functional Theory (TD-DFT) calculations were performed using the CAM B3LYP functional33 and the 6-311G(d,p) basis set34,35 for H, C, N, P, Cl, Br, and I atoms to investigate the electronic excited states. The 6-311G(d,p) basis set for iodine was obtained from the Basis Set Exchange database,36 while the LANL2DZ basis set with an effective core potential was employed for the copper atoms.37 The molecular geometries were taken directly from the experimentally determined unit cell (X-ray diffraction) using the reported fractional atomic coordinates, and were not further geometry-optimized. All TD-DFT calculations were performed in the gas phase (i.e., without an implicit solvent model). For each molecule/complex, thirty singlet and triplet excited states were evaluated. All calculations were carried out using the Gaussian 16 program (Gaussian, Inc., Wallingford, CT, USA, 2016),38 and the frontier molecular orbitals (FMOs) were generated with GaussView (Semichem Inc., Shawnee Mission, KS, USA, 2009).39 Orbital contributions were analyzed and visualized using the GaussSum package (Dublin City University: Dublin, Ireland, 2008).40
Results and Discussion
IR and Raman spectroscopy
The band assigned to the combined ν(CC+CN) stretching mode appears at 1578 cm-1 in the FTIR spectrum of the free DCQ ligand and shifts to the range of 1598 1573 cm-1 upon coordination in complexes (1-5), indicating coordination of DCQ through the nitrogen atom of the quinoline moiety to the copper(I) center. Similarly, from FT Raman spectra, the ν(CC+CN) band shifts from 1558 cm-1 in free DCQ to 1563 cm-1 in complexes (4) and (5).41
For complexes (4) and (5), the τ(PPh3) stretching vibrations of free PPh3, observed at 1024 cm-1 (IR) and 1028 cm-1 (Raman), undergo minimal shifts to 1028 and 1030 cm-1, respectively. Despite these minor shifts, the spectral profiles of complexes (4) and (5) exhibit characteristic bands from both DCQ and PPh3 ligands, confirming their presence in the complexes.31 Evidence for coordination of DCQ, PPh3, and halide ligands are provided by bands assigned to ν(Cu-N), ν(Cu-X), and ν(Cu-P) stretching modes observed in the 524-187 cm-1 range, respectively, of the FT Raman spectra for complexes (4) and (5).4244
The distinct spectroscopic behavior observed between systems (1-3) and (4,5) is particularly noteworthy. In complexes from system (1-3), the ν(CC+CN) stretching bands are shifted to higher wavenumbers relative to the free ligand, whereas for system (4-5), the corresponding bands appear at lower wavenumbers. This divergence may be associated with differences in electronic distribution, particularly influenced by the presence of the PPh3 ligand, which acts as σ donor and π acceptor. The subtle variations in the IR and Raman band shifts among complexes within systems (1-3) can be associated with their isostructural nature, a characteristic similarly observed in complexes (4) and (5). The complete set of FTIR and FT Raman spectra for complexes (1-5), as well as the free ligands, are provided as SI section (Figures S1-S9 and Table S1). FT Raman measurements for complexes (1-3) could not be performed due to strong fluorescence interference, which prevented the acquisition of reliable spectra.
1H, 13C{1H} and 31P{1H} NMR analyses
The 1H, 13C{1H}, and 31P{1H} NMR spectra of complexes (4) and (5) and of the corresponding free ligands were comparatively analyzed (see SI section, Figures S10, S11, S14, S15, S16, S17 and Tables S2 and S3). In the DCQ fragment, noticeable downfield shifts of the H(2) and H(8) resonances were observed in the 1H NMR spectra of the complexes relative to the free ligand, indicating an altered electronic environment upon coordination.31,45 In addition, the CuI complexes exhibited significant broadening of the 1H signals, consistent with faster proton relaxation processes and corroborating the coordination of the DCQ moiety to the CuI center.46 In contrast, no significant variations were detected in the 13C{1H} NMR spectra, suggesting that the electronic environment around the carbon atoms remained unchanged upon coordination. For the secondary ligand, PPh3, the 1H NMR spectra revealed marked changes in the signal profiles, while the 13C{1H} spectra displayed clear downfield shifts for the α carbons relative to the phosphorus atom upon coordination to copper(I) ion. In the 31P{1H} NMR spectra, free PPh3 showed a singlet at -5.22 ppm, whereas complexes (4) and (5) exhibited only minor shifts (below 2 ppm) upon coordination to copper(I) ion. Despite these small changes, additional evidence such as 31P signal broadening as expected for coordination to quadrupolar copper nuclei (63/65Cu, I = 3/2) and systematic shifts in β protons and α carbons supports the binding of PPh3 to the CuI center.47,48 Time dependent 1H and 31P{1H} NMR measurements of complexes (4) and (5) in CDCl3 further confirmed their stability: the spectra remained essentially unchanged over 96 h, with no significant changes in the resonances associated with nuclei near the coordination center (see SI section, Figures S12, S13, S18 and S19). Consistently, the replacement of chloride by bromide ligands did not induce substantial changes in the chemical environment of the complexes, as evidenced by their similar NMR chemical shifts and by the comparable solid-state FTIR and FT Raman spectra, which also showed no significant band shifts between the two halide derivatives.
Electronic absorption and diffuse reflectance UV-Vis spectroscopy
The UV-Vis spectra of complexes (4) and (5) were recorded at RT in CH3CN, CH2Cl2, and CHCl3 solutions. The electronic absorption spectra of the CuI complexes exhibit an intense band centered in the 320-325 nm region, attributed to an intraligand π → π* transition for DCQ.31,49 Notably, in CH2Cl2 and CHCl3 solutions, an additional band appears around 360 nm with molar absorptivities in the range of 1228-4099 M-1 cm-1, characteristic of MLCT/(MX)LCT transitions.13 The presence and intensity of this band are consistent with electronic coupling between the metal, halide, and quinoline fragments, suggesting that MLCT/(MX)LCT-type excitation pathways may be accessible in solution. All UV-Vis spectra and spectrophotometric titration data are provided as SI section (Figures S20-S41). The molar absorptivity, band position, and spectral profile remained unchanged over 96 h, with no detectable spectral evolution under the experimental conditions. The stability of the spectral profiles over 96 h provides no evidence for ligand exchange, oxidation, or major structural reorganization under the experimental conditions, supporting the retention of a closely related copper(I) coordination environment (see SI section, Figures S42-S47).
For diffuse reflectance measurements, approximately 10 mg of each complex was finely ground and homogenized with barium sulfate (BaSO4) in a 1:100 (complex:BaSO4) mass ratio to improve spectral resolution in the 300 530 nm range (Figure 2). The broad absorption band observed between 260-340 nm is assigned to π → π* electronic transitions from the ground singlet state (S0) to the first excited singlet state (S1) of the DCQ ligand in complexes (1 3), and of both DCQ and PPh3 ligands in complexes (4) and (5).50 In the 340-600 nm range, several absorption features are observed, corresponding to (MX)LCT transitions involving the CuX and DCQ fragments in complexes (1-3).13,51 In the case of complexes (4) and (5), additional transitions with LLCT character are observed.46,52 These spectral assignments are broadly consistent with the qualitative trends obtained from DFT/TD-DFT calculations, as discussed in the “Computer simulations” sub-section. Complete diffuse reflectance UV-Vis experimental spectra and TD-DFT absorption spectra, transition energies and corresponding wavelengths are available as SI section (Figures S48-S50, S101-S105 and Tables S27-S31).

Conductimetric measurements
Molar conductivity measurements of complexes (1 5) in CH3CN over 96 h revealed stable, non-electrolytic behavior, indicating retention of the CuI oxidation state and suggesting no substantial changes consistent with oxidation-state variation under these conditions. In contrast, conductivity values consistent with 1:1 electrolytes were observed for complexes (4) and (5) in DMSO, suggesting partial dissociation of the halide ligand from the copper(I) center, while preserving the copper(I) oxidation state and leading to stable species in solution.53 To further probe this behavior, conductivity measurements for complexes (4) and (5) were performed in solvents with different dielectric constants. The results demonstrate a strong dependence of dissociation on solvent nature,31,54 with halide ligands remaining coordinated to the metal center in poorly coordinating, low-dielectric media. As discussed later, complexes (4) and (5) adopt dimeric structures in the solid-state, and their reduced conductivity in nonpolar solvents, together with the similarity of their 1H, 13C{1H}, and 31P{1H} NMR chemical shifts to those inferred from solid-state FTIR and FT Raman data, supports the presence of closely related coordination environments in solution. Complete molar conductivity data for all five CuI complexes as a function of time are provided in the SI section (Tables S4 and S5).
Thermal analysis
The thermal decomposition behavior of complexes (1 5) was investigated by thermogravimetric and differential thermal analyses (TGA/DTA). The experimental mass losses observed in the TGA curves are 66.5, 55.4, 50.7, 68.8, and 67.0% for complexes (1-5), respectively. These values are in reasonable agreement with the calculated mass losses (66.7, 58.0, 51.0, 69.1, and 66.8%), considering CuX (X = Cl, Br, I) as the major inorganic component of the residual material, while allowing for the presence of non-degraded organic species in some cases.
Complexes (1-3) exhibit similar thermal decomposition profiles, as expected from their closely related polymeric structures, differing mainly in the temperature ranges over which decomposition occurs, a trend consistent with the progressive change in halide identity within the crystalline lattice. Complexes (1) and (3) undergo a single endothermic decomposition step associated with ligand loss. In contrast, complex (2) displays an initial endothermic event followed by an exothermic process and retains a non-volatile organic fraction throughout the heating profile.
The dimeric complexes (4) and (5) decompose through two distinct endothermic steps, credited to sequential DCQ ligand loss followed by the thermal degradation of the PPh3 ligand, involving the release of phosphine-derived fragments. Notably, both complexes retain partially decomposed organic material together with copper(I) halide residues, and neither undergoes complete decomposition within the temperature range investigated. The complete TGA/DTA profiles are provided as SI section (Figures S56-S60).
Structural studies of complexes (1-5)
The structures of complexes (1-3) exhibit two-dimensional double-stranded ladder motif, wherein the copper(I) centers are interconnected by µ3-halide bridges and further coordinated by one nitrogen atom from DCQ, leading to distorted tetrahedral coordination environment. A 1:1 CuX-to-ligand ratio and overall charge neutrality are observed. The Cu-N bond distances range from 2.009(3) to 2.43656(6) Å and are consistent with analogous CuI-X chain structures reported in the Cambridge Structural Database. Supramolecular stabilization is provided by significant intermolecular π···π interactions between DCQ of the adjacent complexes, with centroid-centroid distances ranging from 3.591 to 3.806 Å.
Complexes (4) and (5) show μ2-halide-bridged dimers, as represented in the Figure 3c, where X-Cu-X (X = Cl, Br) bond angles range from 99.332(19)° to 102.129(13)° and bond lengths span 2.3871(6) to 2.5270(4) Å. The copper(I) centers have distorted tetrahedral geometry with halide, PPh3 and DCQ ligands. The Cu-N distances fall in the 2.092(2) and 2.0959(19) Å range, in line with literature data retrieved in the Cambridge Structural Database. In addition, Cu-P bonds with distances of 2.2003(6) and 2.2128(7) Å are also present. The additional stabilization arises from intermolecular π···π interactions between quinoline rings of neighboring molecules, with centroid-to-centroid distances between 3.973 and 3.991 Å. The main crystallographic parameters for complexes (1-5) are summarized in Table 1 while selected distance and angle bonds are listed in Table 2. The structural drawings of complexes (1) and (4) are depicted in Figures 3a-3c. Further crystallographic details for complexes (1-5) are provided as SI section (Figures S61-S82 and Tables S6-S12).
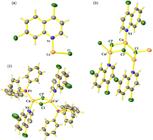
(a) Asymmetric unit for complex 1; (b) representation 2D packing across the a axis for complex (1) and (c) dimeric structure for complex (4). Thermal ellipsoids for complexes (1) and (4) are drawn at the 50% probability level; hydrogen atoms are represented as spheres with arbitrary radius. Color codes: Cu, light orange; C, gray; H, white; N, blue; P, purple; and Cl, green.
Optical properties
Qualitative photoluminescence measurements on the polymeric [CuX(DCQ)]n and dimeric [CuX(DCQ)(PPh3)]2 solids at nearly 298 K indicate that halide identity modulates the emissive response,55-58 most clearly in emission energy/color (red to yellow; Figures 4a-4c). For (1-3), optical gaps estimated from absorption onsets (λonset) broadly track the emission energies (Table 3), whereas this correspondence is less pronounced for (4) and (5). All complexes display long-lived, millisecond-scale emission (Table 4), with the iodide polymer (3) exhibiting the longest average lifetime (<τ> = 2.3 ± 0.2 ms). Together with qualitative TD-DFT results indicating closely spaced singlet and triplet CT like states with related orbital character, the data support a qualitative framework in which triplet CT-like excited states may be accessed via InterSystem Crossing (ISC). Because SOC is not quantified and no temperature-/oxygen-dependent experiments were performed, no specific emissive mechanism is assigned, and the discussion is restricted to this qualitative triplet-CT framework.6,9
Optical gaps, photoluminescence energies, and Stokes shifts and selected structural parameters for copper(I) halide complexes (1-5) in the solid-state

(a) Images of powdered samples of compounds (1-5) under white light and 365 nm UV light, (b) solid-state emission spectra of complexes (1-5) at 298 K. (c) Commission Internationale de l’Éclairage (CIE) 1931 chromaticity diagram for emission spectra of complexes (1-5) in the solid-state at 298 K.
Within the polymeric series, (1) shows the lowest quantum yield together with the least energetic emission and the smallest optical gap, suggesting a comparatively less emissive decay balance under the conditions examined.59,60 Complex (2) displays markedly enhanced response, with higher quantum yield (ΦPL = 14.7%) together with comparable lifetime, larger Stokes shift, and orange-yellow emission, even though its Cu···Cu separation is longer than that of (1). Complex (3) exhibits the most energetic emission and the smallest Stokes shift, together with the shortest Cu···Cu separation, yet only moderate efficiency (ΦPL = 7.4%); its small Stokes shift may be consistent with comparatively more localized contribution within the broader CT manifold.61 Across (1-3), π···π stacking and weak non-classical C-H···X contacts fall within narrow ranges and do not show systematically variations with the photophysical trends, do not support a reduction of the polymeric photophysics to a single geometric descriptor but instead reflects the combined influence of halide identity, electronic structure, and solid-state constraints.62-64
The dimeric complexes (4) and (5), which include PPh3, are more emissive than their polymeric analogues (ΦPL = 11.2 and 24.3%, respectively) and show visible emission with moderate Stokes shifts. Structurally, both feature Cu···Cu separations > 3.10 Å, longer π···π distances, and weak C-H···X interactions; this supramolecular environment may allow additional excited-state relaxation components prior to emission, which could contribute to the weaker λonset- correspondence observed for (4) and (5). No single structural parameter, however, can be unambiguously linked to emission efficiency based on the present dataset, underscoring the multifactorial nature of the emissive response in these CuI-quinoline systems.65,66
Overall, the highest quantum yields are observed for the bromide-containing complexes, but the available evidence does not support direct causal link between halide identity and the underlying emissive processes. Instead, the photoluminescent response reflects the combined effects of halide identity, coordination environment, and solid-state structural constraints, with halide identity most clearly expressed through shifts in emission energy/color (including a blueshift across each sub-series) rather than a simple monotonic trend in other photophysical parameters. Consistent with this interpretation, a direct comparison between Cu···Cu separations and EPLdoes not reveal a monotonic relationship: complex (3) shows the shortest Cu···Cu distance (2.6541 Å) yet the highest EPL (2.19 eV), whereas complex (2) exhibits the longest Cu···Cu distance (3.4624 Å) but an intermediate EPL (2.06 eV); additionally, complexes (1), (4), and (5) display similar Cu···Cu distances (3.0111-3.1673 Å) but distinct emission energies (1.99 2.09 eV). Thus, the data described in Tables 3 and 4 indicate that emission energies cannot be rationalized by a single geometric descriptor such as the Cu···Cu separation, reinforcing the absence of a direct correlation between these parameters. A detailed compilation of the π···π interactions and C-H···X supramolecular contacts for all complexes is provided as SI section (Tables S6, S7, S9, S11, and S12).
In solution, complexes (4) and (5) show no detectable visible emission in CH2Cl2 or CHCl3 (SI section, Figures S98 and S99), even though their UV-Vis spectra display MLCT/(MX)LCT CT absorption bands. This highlights that charge-transfer absorption in solution does not necessarily translate into observable emission.13 A direct solid-solution comparison is not possible for complexes (1 3), since their polymeric frameworks dissociate upon dissolution in acetonitrile.
Computer simulations
TD-DFT calculations were used to obtain more information about the electronic structure and CT character of low-energy excited states in representative polymers and dimeric copper(I) complexes. Because the polymeric architectures are extended in the solid-state, finite molecular models were employed to capture the local coordination environments around the copper(I) centers. The TD-DFT results are therefore used only to support qualitative trends in electronic structure and excited-state energetics; they are not treated as direct representations of the emissive states, but as indicators of general features of the low-energy excited-state manifold. Within this qualitative framework, the calculations suggest that CT-type excited states are densely packed and share similar orbital character, with singlet and triplet states lying close in energy. This picture is compatible with ISC being competitive on the relevant timescale and with the experimentally observed millisecond-scale emission lifetimes.
Complexes (1) and (4) were selected as representative polymeric and dimeric models, respectively, Figure 5. For (1), the lowest-energy singlet excitation (S1 = 3.4564 eV) is mainly HOMO (highest occupied molecular orbital) → LUMO (lowest unoccupied molecular orbital) (54%) and H-2 → L+1 (23%), consistent with an n(MX)LCT type transition (n = 1 or 3) from metal/halide-based orbitals to DCQ-centered π* acceptors. Several nearby triplet states lie slightly below S1 (Tn = 3.4313 3.4244 eV; DE ca. 10-2 eV) and retain closely related dominant configurations (e.g., H-2 → L+1 (19%)/HOMO → LUMO (28%); HOMO → L+1 (30%)/H-2 → L+4 (19%)), supporting within the qualitative scope of the model that small singlet-triplet gaps and similar orbital character can favor ISC without assigning a unique emissive pathway. For complex (4), the lowest-energy singlet excitation (S1 = 3.4332-3.4349 eV) is dominated by HOMO → L+1 or HOMO → LUMO (83%), with a secondary H-2 → LUMO/L+1 (12%) contribution. The closest triplets occur at 3.4122 3.4132 eV (DE ca. 10-2 eV) and remain largely HOMO → L+1 or HOMO → LUMO (70%), indicating an analogous singlet-triplet proximity and configurational similarity in the dimeric model.

(a) Frontier molecular orbitals, HOMO-2, HOMO, LUMO and LUMO+1 for complex (1), and (b) frontier molecular orbitals, HOMO-2, HOMO, LUMO and LUMO +1 for complex (4).
More generally across the full series, the lowest-lying triplets are consistently predicted to have CT character and to involve the same types of frontier orbitals that dominate the lowest-energy singlet excitations. Consistently, complexes (2), (3), and (5) show the same qualitative scenario of small singlet-triplet separations (10-2 eV scale) and low-energy excitations involving closely related frontier-orbital transitions (HOMO → LUMO/HOMO → L+1), with dominant weights of ca. 70-90% for (3) and (5) and more mixed configurations for (2). Complete computational details are provided in the SI section (Figures S101-S105 and Tables S14-S31).
Conclusions
Five copper(I) complexes based on the DCQ ligand, including ladder-type polymers [CuX1(DCQ)]n (X1 = Cl, Br, I) and discrete dimeric species [CuX2(DCQ)(PPh3)]2 (X2 = Cl, Br), both featuring distorted tetrahedral copper(I) centers, were synthesized and systematically characterized by structural, spectroscopic, analytical, photophysical, and theoretical methods. In the solid state, halide ligands change the emission energy/color, Stokes shift, quantum yield, and lifetime across the series. The dimeric compounds tend to be more emissive than the corresponding polymeric analogues (where directly comparable). Bromide derivatives reach the highest efficiencies, although the data do not support a direct causal link between halide identity and emission efficiency.
Time-resolved measurements show millisecond lifetimes, pointing to long-lived excited states. TD-DFT calculations place singlet and triplet CT states close in energy, which is compatible with the observed lifetimes. The emission is therefore discussed in terms of CT excited states with contributions from the metal, halide, and ligand, with additional LLCT character in the dimers. The dimeric species show no detectable emission in solution despite MLCT/(MX)LCT absorption in the UV-Vis spectra, consistent with key contribution from the solid-state environment in sustaining luminescence.
Overall, the outcomes show that photoluminescence in rigid CuI-DCQ solids reflects the combined effects of coordination motif, halide identity, and solid-state structural constraints. By complementing single-descriptor structure-property rationalizations with multifactor perspective, this work provides robust basis for interpreting excited-state behavior in d10 CuI-quinoline materials and may help inform the design of functional luminescent systems.
Supplementary Information
CCDC deposition numbers 2442712, 2465323, 2465322, 2405339 and 2493986 contain the supplementary crystallographic data (excluding structure factors) for the structure of complexes (1), (2), (3), (4) and (5), respectively, reported in this paper. These data can be obtained free of charge from the Cambridge Crystallographic Data Center, via https://www.ccdc.cam.ac.uk/structures/.
Supplementary information (FTIR and FT Raman spectra, FTIR and FT Raman data, 1H 13C{1H}, 31P{1H} NMR spectra, 1H 13C{1H}, 31P{1H} NMR data, UV-Vis spectra, UV-Vis data, thermal analysis, conductivity data, optical properties, TD-DFT tables and supramolecular interactions, Rietveld refinement plot, packing diagrams) is available free of charge at PDF file.
Supplementary PDF
Acknowledgments
This study was financed by FAPEMIG - Minas Gerais, Brazil (APQ-04458-23). Also, the authors would like to thank the Brazilian agencies CNPq and CAPES for financial support. K. A. D’O. thanks the Chemistry Department of the Federal University of Juiz de Fora (UFJF) - Núcleo de Espectroscopia e Estrutura Molecular - NEEM for the technical support in spectroscopy measurements, and C. C. C. (UFJF) for technical support in elemental analysis; and Tadeu Antônio de Aquino Guedes and Samir Faria de Oliveira from the Physics Department of the Federal University of Juiz de Fora (UFJF) for the technical support. D. H. P. acknowledge financial support from FAPESP (grant No. 2023/17727-2) and CNPq (grant No. 443317/2024).
During the preparation of this manuscript, the authors used ChatGPT v5.4 (OpenAI) to assist with language editing, including grammar correction and stylistic refinement. All content was subsequently reviewed and revised by the authors, who take full responsibility for the final version and its scientific integrity.
Data Availability Statement
All data are available in the text.
References
-
1 Frin, K. P. M.; Nascimento, V. M.; J. Braz. Chem. Soc. 2016, 27, 179. [Crossref]
» Crossref -
2 Liu, Z.; Xie, C.; Heumueller, T.; McCulloch, I.; Brabec, C. J.; Huang, F.; Cao, Y.; Li, N.; Energy Environ. Sci. 2024, 18, 155. [Crossref]
» Crossref -
3 Quesada-González, D.; Merkoçi, A.; Biosens. Bioelectron. 2025, 273, 117180. [Crossref]
» Crossref -
4 Tong, H.; Zhou, Z.; Lv, Y.; Li, H.; Liu, W.; Ouyang, G.; Mater. Adv. 2023, 4, 481. [Crossref]
» Crossref -
5 Zhang, H.; Huang, X.; Wan, T.; Wei, R.; Yin, B.; Le, Y.; Ye, S.; Chen, W.; Li, M.; Xiao, X.; Liu, X.; Xia, Z.; Qiu, J.; Yang, Z.; Dong, G.; Nat. Commun. 2025, 16, 5973. [Crossref]
» Crossref -
6 Wegeberg, C.; Wenger, O. S.; J. Am. Chem. Soc. Au 2021, 1, 1860. [Crossref]
» Crossref -
7 Morselli, G.; Reber, C.; Wenger, O. S.; J. Am. Chem. Soc. 2025, 147, 11608. [Crossref]
» Crossref -
8 Forni, A.; Malpicci, D.; Lucenti, E.; Zecchinello, L.; Colombo, A.; Cariati, E.; Chem. Sci. 2025, 16, 20755. [Crossref]
» Crossref -
9 Lavie-Cambot, A.; Cantuel, M.; Leydet, Y.; Jonusauskas, G.; Bassani, D. M.; McClenaghan, N. D.; Coord. Chem. Rev. 2008, 252, 2572. [Crossref]
» Crossref -
10 Liu, C. W.; Sarkar, B.; Huang, Y.-J.; Liao, P.-K.; Wang, J.-C.; Saillard, J.-Y.; Kahlal, S.; J. Am. Chem. Soc. 2009, 131, 11222. [Crossref]
» Crossref -
11 Llanos, L.; Staforelli, S.; Oliver, A. G.; Moscoso, F. G.; Wannemacher, R.; Cabanillas-Gonzalez, J.; Lemus, L.; Aravena, D.; Angew. Chem., Int. Ed. 2025, 64, e202501407. [Crossref]
» Crossref -
12 Khatri, N. M.; Pablico-Lansigan, M. H.; Boncher, W. L.; Mertzman, J. E.; Labatete, A. C.; Grande, L. M.; Wunder, D.; Prushan, M. J.; Zhang, W.; Halasyamani, P. S.; Monteiro, J. H. S. K.; de Bettencourt-Dias, A.; Stoll, S. L.; Inorg. Chem. 2016, 55, 11408. [Crossref]
» Crossref -
13 Gusev, A.; Kiskin, M.; Braga, E.; Zamnius, E.; Kryukova, M.; Karaush-Karmazin, N.; Baryshnikov, G.; Minaev, B.; Linert, W.; RSC Adv. 2023, 13, 3899. [Crossref]
» Crossref -
14 Mensah, A.; Shao, J.-J.; Ni, J.-L.; Li, G.-J.; Wang, F.-M.; Chen, L.-Z.; Front. Chem. 2022, 9, 816363. [Crossref]
» Crossref -
15 Chattopadhyay, M. K.; Ghorai, P.; Datta, S.; Jana, N. C.; Mir M. H.; Banerjee, P.; Inorg. Chem. 2025, 64, 18277. [Crossref]
» Crossref -
16 Feng, L.; Meng, F.; Niu, G.; Chem. Asian J. 2023, 18, e202300163. [Crossref]
» Crossref -
17 Van Deun, R.; Fias, P.; Driesen, K.; Binnemans, K.; Görller-Walrand, C.; Phys. Chem. Chem. Phys. 2003, 5, 2754. [Crossref]
» Crossref -
18 Hofbeck, T.; Niehaus, T. A.; Fleck, M.; Monkowius, U.; Yersin, H.; Molecules 2021, 26, 3415. [Crossref]
» Crossref -
19 Yersin, H.; Czerwieniec, R.; Monkowius, U.; Ramazanov, R.; Valiev, R.; Shafikov, M. Z.; Kwok, W.-M.; Ma, C.; Coord. Chem. Rev. 2023, 478, 214975. [Crossref]
» Crossref -
20 Gibbons, S. K.; Hughes, R. P.; Glueck, D. S.; Royappa, A. T.; Rheingold, A. L.; Arthur, R. B.; Nicholas, A. D.; Patterson, H. H.; Inorg. Chem. 2017, 56, 12809. [Crossref]
» Crossref -
21 Wei, Q.; Chen, H.-T.; Liu, L.; Zhong, X.-X.; Wang, L.; Li, F.-B.; Cong, H.-J.; Wong, W.-Y.; Alamry, K. A.; Qin, H.-M.; New J. Chem. 2019, 43, 13408. [Crossref]
» Crossref -
22 Sheldrick, G. M.; Acta Crystallogr., Sect. A 2015, 71, 3. [Crossref]
» Crossref -
23 Sheldrick, G. M.; Acta Crystallogr., Sect. C 2015, 71, 3. [Crossref]
» Crossref -
24 Dolomanov, O. V.; Bourhis, L. J.; Gildea, R. J.; Howard, J. A. K.; Puschmann, H.; J. Appl. Crystallogr. 2009, 42, 339. [Crossref]
» Crossref -
25 Macrae, C. F.; Sovago, I.; Cottrell, S. J.; Galek, P. T. A.; McCabe, P.; Pidcock, E.; Paltiel, M.; Shields, G. P.; Stevens, J. S.; Towler, M.; Wood, P. A.; J. Appl. Crystallogr. 2020, 53, 226. [Crossref]
» Crossref -
26 D’Oliveira, K. A.; Souza, I. O.; Glanzmann, N.; da Silva, A. D.; Bruziguini, C. E. T.; Ribeiro, M. A.; Canales, C. S. C.; Roque Borda, C. A.; Pavan, F. R.; Cuin, A.; J. Coord. Chem. 2025, 78, 409. [Crossref]
» Crossref -
27 D’Oliveira, K. A.; Glanzmann, N.; da Silva, A. D.; Bruzeguini, C. E. T.; Ribeiro, M. A.; Canales, C. S. C.; Roque-Borda, C. A.; Pavan, F. R.; da Silva, D. F. M.; Pereira, D. H.; Cuin, A.; ACS Omega 2025, 11, 2114. [Crossref]
» Crossref -
28 Pawley, G. S.; J. Appl. Crystallogr. 1981, 14, 357. [Crossref]
» Crossref -
29 Coelho, A. A.; J. Appl. Crystallogr. 2003, 36, 86. [Crossref]
» Crossref - 30 TOPAS-R, v.4.2; Bruker AXS: Karlsruhe, Germany, 2009.
-
31 D’Oliveira, K. A.; Glanzmann, N.; da Silva, A. D.; Bruziguini, C. E. T.; Ribeiro, M. A.; Canales, C. S. C.; Roque-Borda, C. A.; Pavan, F. R.; Corbi, P. P.; Masciocchi, N.; Cuin, A.; J. Braz. Chem. Soc. 2025, 36, e20250048. [Crossref]
» Crossref - 32 Young, R. A.; The Rietveld Method; IUCr Monograph 5; Oxford University Press: New York, 1981.
-
33 Yanai, T.; Tew, D. P.; Handy, N. C.; Chem. Phys. Lett. 2004, 393, 51. [Crossref]
» Crossref -
34 Petersson, G. A.; Bennett, A.; Tensfeldt, T. G.; Al-Laham, M. A.; Shirley, W. A.; Mantzaris, J.; J. Chem. Phys. 1988, 89, 2193. [Crossref]
» Crossref -
35 Petersson, G. A.; Al-Laham, M. A.; J. Chem. Phys. 1991, 94, 6081. [Crossref]
» Crossref -
36 Basis Set Exchange (BSE). [Link] accessed in March 2026
» Link -
37 Hay, P. J.; Wadt, W. R.; J. Chem. Phys. 1985, 82, 270. [Crossref]
» Crossref - 38 Frisch, M. J.; Trucks, G. W.; Schlegel, H. B.; Scuseria, G. E.; Robb, M. A.; Cheeseman, J. R.; Scalmani, G.; Barone, V.; Petersson, G. A.; Nakatsuji, H.; Li, X.; Caricato, M.; Marenich, A. V.; Bloino, J.; Janesko, B. G.; Gomperts, R.; Mennucci, B.; Hratchian, H. P.; Ortiz, J. V.; Izmaylov, A. F.; Sonnenberg, J. L.; Williams-Young, D.; Ding, F.; Lipparini, F.; Egidi, F.; Goings, J.; Peng, B.; Petrone, A.; Henderson, T.; Ranasinghe, D.; Zakrzewski, V. G.; Gao, J.; Rega, N.; Zheng, G.; Liang, W.; Hada, M.; Ehara, M.; Toyota, K.; Fukuda, R.; Hasegawa, J.; Ishida, M.; Nakajima, T.; Honda, Y.; Kitao, O.; Nakai, H.; Vreven, T.; Throssell, K.; Montgomery, J. A., Jr.; Peralta, J. E.; Ogliaro, F.; Bearpark, M. J.; Heyd, J. J.; Brothers, E. N.; Kudin, K. N.; Staroverov, V. N.; Keith, T. A.; Kobayashi, R.; Normand, J.; Raghavachari, K.; Rendell, A. P.; Burant, J. C.; Iyengar, S. S.; Tomasi, J.; Cossi, M.; Millam, J. M.; Klene, M.; Adamo, C.; Cammi, R.; Ochterski, J. W.; Martin, R. L.; Morokuma, K.; Farkas, O.; Foresman, J. B.; Fox, D. J. Gaussian, Inc., Wallingford CT, 2016. Dennington, R.; Keith, T.; Millam, J.; Gaussian 16, Revision C.01, Gaussian, Inc.: Wallingford, CT, USA, 2016.
- 39 Dennington, R.; Keith, T. A.; Millam, J.; GaussView, version 5; Semichem Inc.: Shawnee Mission KS, 2009.
-
40 O’Boyle, N. M.; Tenderholt, A. L.; Langner, K. M.; J. Comput. Chem. 2008, 29, 839. [Crossref]; GaussSum. [Link] accessed in March 2026
» Crossref» Link -
41 Rey, N. A.; Santos, K. C.; Menezes, M. Â. B. C.; Mangrich, A. S.; Pereira-Maia, E. C.; J. Braz. Chem. Soc. 2006, 17, 497. [Crossref]
» Crossref -
42 Musioł, K.; Janczak, J.; Helios, K.; Witwicki, M.; Fitta, M.; Pełka, R.; Wojciechowska, A.; Res. Chem. Intermed. 2023, 49, 3563. [Crossref]
» Crossref -
43 Bowmaker, G. A.; Healy, P. C.; Kildea, J. D.; White, A. H.; Spectrochim. Acta, Part A 1988, 44, 1219. [Crossref]
» Crossref -
44 Edwards, D. A.; Richards, R.; Spectrochim. Acta, Part A 1978, 34, 167. [Crossref]
» Crossref -
45 de Souza, C. P.; Quadros, H. C.; Aboagye, S. Y.; Fontinha, D.; D’Alessandro, S.; Byrne, M. E.; Gendrot, M.; Fonta, I.; Mosnier, J.; Moreira, D. R. M.; Basilico, N.; Williams, D. L.; Prudêncio, M.; Pradines, B.; Navarro, M.; Pharmaceutics 2022, 14, 1251. [Crossref]
» Crossref -
46 Enikeeva, K. R.; Shamsieva, A. V.; Strelnik, A. G.; Fayzullin, R. R.; Zakharychev, D. V.; Kolesnikov, I. E.; Dayanova, I. R.; Gerasimova, T. P.; Strelnik, I. D.; Musina, E. I.; Karasik, A. A.; Sinyashin, O. G.; Molecules 2023, 28, 706. [Crossref]
» Crossref -
47 Grell, T.; Wonneberger, P.; Yufanyi, D. M.; Lönnecke, P.; Hey Hawkins, E.; Chem. Eur. J. 2025, 31, e202500746. [Crossref]
» Crossref -
48 Bandaru, S. S. M.; Fischer, C.; Correia, J. V.; Land, A.-L.; Schulzke, C.; Inorganics 2025, 13, 175. [Crossref]
» Crossref -
49 Mondal, R.; Lozada, I. B.; Davis, R. L.; Williams, G.; Herbert, D. E.; Inorg. Chem. 2018, 57, 4966. [Crossref]
» Crossref -
50 Mondal, A.; Lozada, I. B.; Davis, R. L.; Williams, J. A. G.; Herbert, D. E.; Inorg. Chem. 2018, 57, 4966. [Crossref]
» Crossref -
51 Małecki, J. G.; Łakomska, I.; Maroń, A.; Szala, M.; Fandzloch, M.; Nycz, J. E.; J. Lumin. 2015, 161, 382. [Crossref]
» Crossref -
52 Baranov, A. Y.; Berezin, A. S.; Samsonenko, D. G.; Mazur, A. S.; Tolstoy, P. M.; Plyusnin, V. F.; Kolesnikov, I. E.; Artem’ev, A. V.; Dalton Trans. 2020, 49, 3155. [Crossref]
» Crossref -
53 Geary, W. J.; Coord. Chem. Rev. 1971, 7, 81. [Crossref]
» Crossref -
54 Ali, I.; Wani, W. A.; Saleem, K.; Synth. React. Inorg. Met.-Org. Nano-Met. Chem. 2013, 43, 1162. [Crossref]
» Crossref -
55 Boivin, L.; Schlachter, A.; Fortin, D.; Lescop, C.; Harvey, P. D.; Molecules 2023, 28, 7781. [Crossref]
» Crossref -
56 Wang, S.; Morgan, E. E.; Panuganti, S.; Mao, L.; Vishnoi, P.; Wu, G.; Liu, Q.; Kanatzidis, M. G.; Schaller, R. D.; Seshadri, R.; Chem. Mater. 2022, 34, 3206. [Crossref]
» Crossref -
57 Artem’ev, A. V.; Baranov, A. Y.; Berezin, A. S.; Stass, D. V.; Hettstedt, C.; Kuzmina, U. A.; Karaghiosoff, K.; Bagryanskaya, I. Y.; Int. J. Mol. Sci. 2023, 24, 5145. [Crossref]
» Crossref - 58 Lakowicz, J. R.; Principles of Fluorescence Spectroscopy, 3rd ed.; Springer: Boston, 2006.
-
59 Wu, Y.; Wang, J.-Y.; Zhang, L.-Y.; Xu, L.-J.; Chen, Z.-N.; Inorg. Chem. 2020, 59, 17415. [Crossref]
» Crossref -
60 Housecroft, C. E.; Constable, E. C.; J. Mater. Chem. C 2021, 10, 4456. [Crossref]
» Crossref -
61 Wu, Y.-F.; Wei, R.-H.; Shao, M.-H.; Yang, X.-H.; Zhao, X.; Liu, Y.-F.; Li, C.-Y.; Bi, Y.-H.; Chen, Z.-W.; Lei, X.-W.; Chem. Mater. 2025, 37, 9569. [Crossref]
» Crossref -
62 Zhou, S.; Chen, Y.; Li, K.; Liu, X.; Zhang, T.; Shen, W.; Li, M.; Zhou, L.; He, R.; Chem. Sci. 2023, 14, 5415. [Crossref]
» Crossref -
63 Murillo, M.; Wannemacher, R.; Cabanillas-González, J.; Rodríguez-Mendoza, U. R.; Gonzalez-Platas, J.; Liang, A.; Turnbull, R.; Errandonea, D.; Lifante-Pedrola, G.; García Hernán, A.; Martínez, J. I.; Amo-Ochoa, P.; Inorg. Chem. 2023, 62, 10928. [Crossref]
» Crossref -
64 Jaros, S. W.; Sokolnicki, J.; Siczek, M.; Smoleński, P.; Inorg. Chem. 2023, 62, 19898. [Crossref]
» Crossref -
65 Baranova, K. F.; Titov, A. A.; Smol’yakov, A. F.; Chernyadyev, A. Y.; Filippov, O. A.; Shubina, E. S.; Molecules 2021, 26, 6869. [Crossref]
» Crossref -
66 Seidler, B.; Tran, J. H.; Thomisch, L.; Vashistha, N.; Görls, H.; Liebing, P.; Schulz, M.; Dietzek-Ivanšić, B.; Chem. Eur. J. 2023, 29, e202203262. [Crossref]
» Crossref
Edited by
-
Editor handled this article:
Brenno A. D. Neto (Editor-in-Chief)