In situ Chemical Analysis of Red Rock Art Pigments from Inhuma (Piauí, Brazil) Using pXRF and PCA
Abstract
This study presents an archaeometric analysis of red pigments from six rock art sites in Inhuma (Piauí, Brazil), using portable energy-dispersive X-ray fluorescence (pXRF) and principal component analysis (PCA). The objective was to establish a non-destructive methodology to differentiate chemical signatures and identify chromophores and mineral markers. The use of four physical filters enabled a comprehensive multi-element analysis, identifying iron (Fe) as the primary chromophore, likely associated with hematite. Zirconium (Zr) acted as a geological marker of the arenitic matrix and possibly of the mineral fraction of the pictorial material. Furthermore, light elements such as phosphorus (P), sulfur (S), silicon (Si), and potassium (K) were fundamental for sample discrimination via PCA. Among the chemometric models tested, the approach based on the mean of the maximum values from all filters provided the most consistent separation between groups, revealing correlations between chemical composition and the spatial distribution of the sites. The results reinforce the potential of integrating pXRF and PCA for in situ characterization and the conservation of archaeological heritage.
Keywords:
archaeometry; rock art pigments; pXRF; chemometrics; principal component analysis; non-destructive analysis
Introduction
X-ray fluorescence spectroscopy (XRF) is an analytical technique widely used in the study of archaeological heritage materials. Its applicability is mainly due to its ability to provide rapid elemental chemical characterization, its non-destructive nature, and the possibility of using portable instrumentation, which allows in situ analyses.1-3
In this context, portable energy-dispersive X-ray fluorescence (pXRF) has become a relevant tool for the investigation of rock art, as it allows for the direct analysis of pigments without the need for sampling or removing material from the rock substrate. This feature is particularly important in archaeological contexts where an advanced state of deterioration limits the application of destructive analytical techniques.4,5
The rapid acquisition of spectra by pXRF generally results in the generation of large datasets, the interpretation of which can become challenging when based solely on univariate analyses.6 Thus, the application of chemometric methods becomes essential for extracting relevant information from these data.7 Among these methods, principal component analysis (PCA) stands out, as it allows for dimensionality reduction while preserving most of the original data variance, thus enabling the identification of patterns of chemical similarity or differentiation among samples.8,9
The municipality of Inhuma, located in the central-northern region of the state of Piauí (Brazil), hosts a significant number of archaeological sites with predominantly red rock paintings attributed to pre-colonial human occupations. Pigments of this color are frequently associated with iron oxides, particularly hematite, a mineral widely used in the production of paints in rock art contexts due to its natural abundance and high chemical stability.10-12 Despite the archaeological importance of these paintings, sites in this region remain poorly investigated from an archaeometric perspective.
Furthermore, rock art sites in the Inhuma region are exposed to several conservation problems of natural and anthropogenic origin that compromise the preservation of the paintings and may lead, in extreme cases, to the disappearance of these records. Among the main factors associated with this process are climatic variations, water action, salt crystallization (efflorescence), biological activity, and direct human interventions.13-17 In this context, archaeometric studies based on non-destructive analytical techniques become essential both for advancing scientific knowledge and for developing conservation strategies suited to the specific conditions of each archaeological site.
Thus, this study investigates the red pigments present in the rock paintings of the archaeological sites of Ema, Ema 1, Furna da Ema, Furna dos Índios, Apertados and Torres 1, located in the Inhuma region (Piauí, Brazil). The investigation is based on elemental analysis using pXRF combined with multivariate analysis through PCA, aiming to explore compositional variations and evaluate patterns of similarity among samples from the different archaeological sites.
Experimental
Materials and reagents
The six archaeological sites analyzed in this study are located in the municipality of Inhuma, in the north-central region of Piauí State, Brazil, all within rural communities of the municipality (Figure 1a). The sites Ema (6°32’44.49”S, 41°40’13.30”W), Ema 1 (6°32’41.51”S, 41°40’16.60”W), and Furna da Ema (6°32’56.91”S, 41°40’13.43”W) are situated in the area known as Ema, forming a cluster of archaeological occurrences located close to one another. The remaining sites are Apertados (6°38’44.58”S, 41°47’29.82”W), located in the community of Alegrete; Torres 1 (6°42’32.52”S, 41°42’0.18”W), located in the community of Atrás da Boa Esperança; and Furna dos Índios (6°37’8.67”S, 41°35’13.22”W), located on private property in the community of Jaboti.

(a) Geographic location of the studied rock art sites in Inhuma (Piauí, Brazil). Map lines delineate study areas and do not necessarily depict accepted national boundaries, (b-g) rock paintings present at the sites: (b) Ema, (c) Ema 1, (d) Furna da Ema, (e) Furna dos Índios, (f) Torres 1, and (g) Apertados.
The Ema site (Figure 1b) corresponds to an extensive open-air sandstone cliff, featuring figurative and non-figurative motifs, predominantly executed in shades of red, with occasional occurrences of white and black pigments, including bichromatic paintings characterized by red outlines and white filling. The Ema 1 site (Figure 1c) consists of a smaller rock outcrop, containing a limited set of exclusively red, non-figurative paintings. Furna da Ema (Figure 1d) is a rock shelter located at the top of an outcrop and features a restricted number of red pictographs, including handprints and abstract elements. Furna dos Índios (Figure 1e) is a larger rock shelter, rich in non-figurative paintings in different shades of red and yellow, often with overlapping motifs. The Torres 1 site (Figure 1f) features an open-air rock wall where red zoomorphic figures predominate, as well as evidence of overlapping motifs. Finally, the Apertados site (Figure 1g) corresponds to a rock shelter with a predominance of non-figurative red paintings. In all locations, the influence of natural weathering agents is observed, with intensity varying according to the degree of exposure of rock surfaces.
Rock art samples from six archaeological sites were analyzed in duplicate, with two pXRF measurements performed at distinct points within the same pigmented area in each sample: Apertados (SAP, 13 samples); Ema 1 and Ema (EM1 and EMA, with 5 and 11 samples, respectively); Furnas da Ema (FEM, 5 samples); Furnas dos Índios (FI, 18 samples); and Torres 1 (T1, 12 samples). Additionally, a spectrometric measurement of the pigment-free rock substrate was carried out at each archaeological site to serve as an analytical blank.
Instrument performance was continuously monitored throughout the analyses by periodic measurements of the certified reference material CRM 180-649 (NIST 2709a), selected for its sensitivity to the elements Ca, K, P, Si, Al, Mg, Fe, Mn, Cr, V, Ti, Sc, Zn, Cu, Ni, Ba, Sb, Zr, Sr, U, Rb, Th, and Pb. This procedure enabled the evaluation of analytical system stability and ensured metrological traceability, as well as the accuracy and precision of the spectrometric results. A total of 134 points were analyzed, comprising 64 rock art samples measured in duplicate and 6 analytical blanks.
In situ elemental analysis of the pictorial layers was performed using a pXRF (Niton XL3t Ultra, Thermo Fisher Scientific). The instrument is equipped with an X-ray tube (silver anode), a silicon drift detector (SDD), and an integrated charge-coupled device (CCD) camera for visualization and documentation of the analyzed areas, operating at a maximum voltage of 50 kV, a current of 200 μA, and a power of 2 W. The equipment features four excitation filters, main, low, high, and light, each optimized for a specific set of chemical elements. The main filter is sensitive to antimony (Sb), tin (Sn), cadmium (Cd), silver (Ag), molybdenum (Mo), niobium (Nb), thorium (Th), zirconium (Zr), yttrium (Y), strontium (Sr), uranium (U), rubidium (Rb), bismuth (Bi), gold (Au), selenium (Se), arsenic (As), lead (Pb), tungsten (W), zinc (Zn), copper (Cu), nickel (Ni), and cobalt (Co). The low filter is designed for the detection of iron (Fe), manganese (Mn), chromium (Cr), vanadium (V), and titanium (Ti), while the high filter targets chromium (Cr), vanadium (V), titanium (Ti), calcium (Ca), potassium (K), neodymium (Nd), praseodymium (Pr), cerium (Ce), lanthanum (La), barium (Ba), antimony (Sb), tin (Sn), cadmium (Cd), and silver (Ag). Finally, the light filter is optimized for light elements such as aluminum (Al), phosphorus (P), silicon (Si), chlorine (Cl), sulfur (S), and magnesium (Mg).
Methods
In situ measurements were performed with the portable device held manually in direct contact with the rock surface. To ensure stability during the 120-s acquisition, the instrument was kept firmly and steadily in position throughout the analysis. The same instrumental parameters were applied to the analytical blanks.
Experimental conditions
Measurements were performed directly on the rock art using the mining Cu/Zn calibration mode. The analysis employed four excitation filters with a total acquisition time of 120 s (30 s per filter) and an irradiation area of 7 mm2.
Data collection and analysis
X-ray fluorescence spectral data were processed and analyzed using the R language (R Core Team, version 4.5.3, 2026).18 A custom script was developed to automate spectral processing, including: (i) selection of the spectral filter (main, low, high, or light); (ii) identification the maximum intensity of the replicates for each sample; (iii) extraction of peak intensities for the elements of interest; and (iv) generation of individual and comparative visualizations.
Data manipulations were performed using the dplyr, tidyr, and purrr packages. Spectral visualizations were constructed with the ggplot2 package, while the patchwork package was used to combine multiple plots into paginated figures. Chemical elements were identified in the spectra through custom annotations, with parameters (position, color, font size) controlled by an external spreadsheet imported via readxl.
All generated figures were exported in .tiff format at a resolution of 600 dpi, using color palettes from the viridis package to ensure accessibility for color-blind individuals. The complete results, including peak intensities, processed spectra, and configured parameters, were exported to Microsoft Excel for Microsoft 365, version 2505 spreadsheets using the openxlsx package.
Multivariate data analysis was performed using The Unscrambler® X 10.1 software (CAMO Software AS, Norway)19. The dataset comprised 134 samples and 4,000 variables corresponding to the four instrumental filters (spectral range from 0 to 59.985 keV). PCA was employed to reduce data dimensionality and identify trends or similarities among samples through principal components (PCs). The spectra were subjected to mean-centering, and mean-centering combined with pareto scaling was also evaluated. Scores, residuals, and leverage plots were used to detect and eliminate outliers, ensuring the robustness of the chemometric model. For visualization purposes only, the spectra presented in the figures were truncated to the 0 25 keV energy range because the region above 25 keV contained no analytically relevant peaks and was dominated by background noise. The PCA, however, was performed using the complete spectra (0 59.985 keV; 4,000 variables). The resulting PCA plots and all spectral figures were generated using Origin® software 2021 (OriginLab).
Extra information
Critical output data, including the complete set of pXRF spectra and the PCA plots comprising the analytical blanks, were included in the Supplementary Information (SI) section.
Results and Discussion
Principal component analysis (PCA)
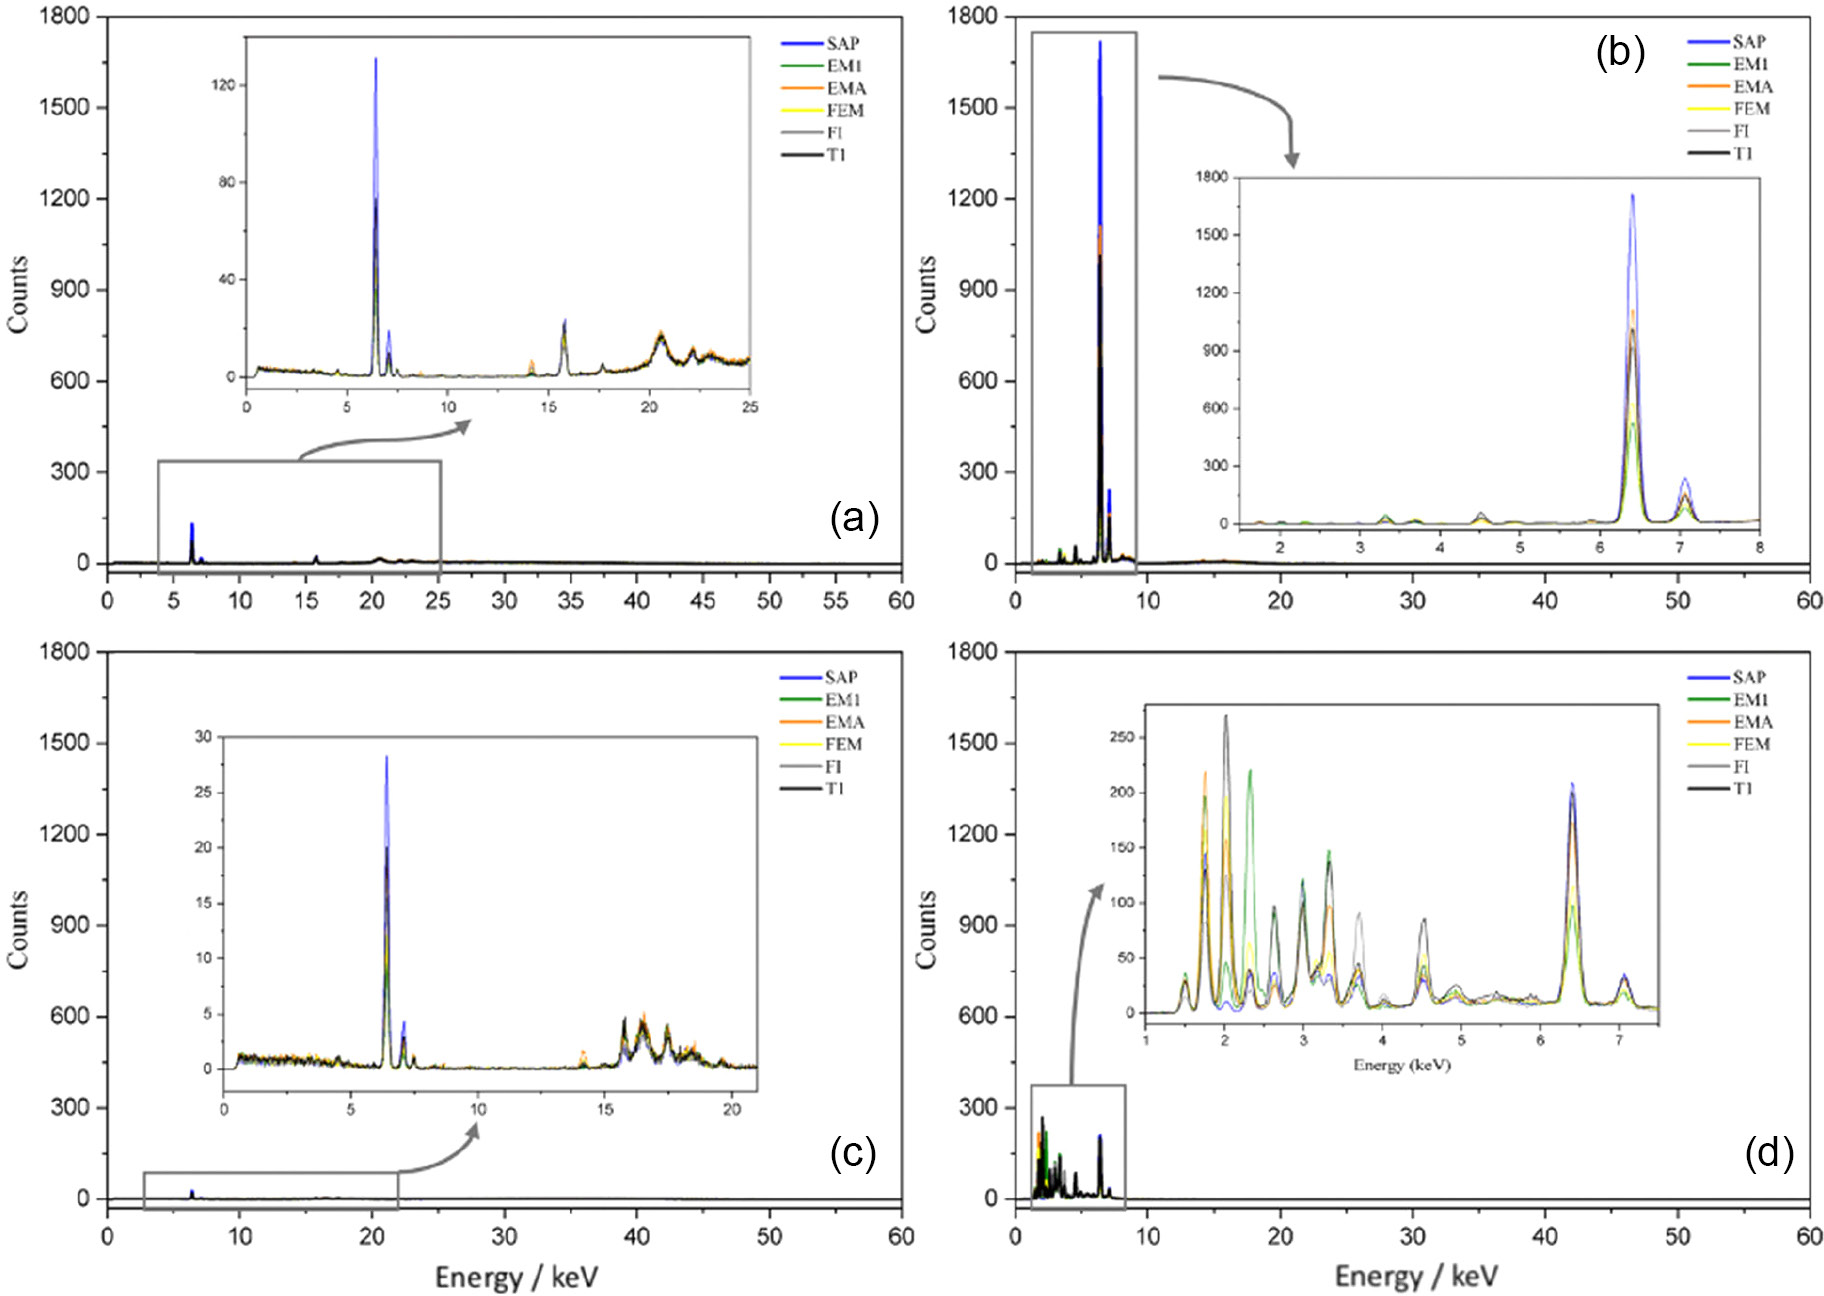
To investigate the rock art paintings from six archaeological sites, the elemental chemical spectra acquired by pXRF were subjected to chemometric treatment using PCA. In this study, four unsupervised chemometric models were constructed employing the elemental data from the four filters (main, low, high, and light), alongside a fifth model based on the average of the maximum values, resulting in five distinct data matrices. For each matrix, sample averages were utilized to build a dataset comprising 64 spectra plus 6 analytical blanks across 4,000 variables, representing the energies associated with the analytical signal intensities. To evaluate the elemental profile of the pigments across the different archaeological sites, Figure 2 displays individual representative pXRF spectra. A single, characteristic sample was selected from each site for each used filter to illustrate the main geochemical features without masking intra-site variations.

Elemental spectra of a randomly selected sample from each archaeological site, obtained by pXRF, for the four filters used: (a) main, (b) low, (c) high, and (d) light.
As shown in Figure 2, different spectral profiles were evaluated for this chemometric study, as each instrumental filter provides distinct elemental information that may be responsible for the discrimination of the analyzed samples. It can be observed in Figures 2a-2c (main, low, and high filters, respectively) a high contribution from the variable at 6.4 keV, corresponding to the Kα transition of Fe, highlighting the ferruginous nature of the red pigments analyzed. In contrast, Figure 2d (light filter) reveals the detection of several spectral lines attributed to trace elements present in the samples, which may exert a direct influence on the chemometric classification.
In this context, elemental chemical characterization becomes an indispensable tool for identifying not only the primary chromophores but also accessory components and alteration products. While iron dominates the spectral response in higher-energy configurations (main and high filters), the use of optimized settings for light elements (light filter) enables the detection of fundamental diagnostic markers. The identification of P, for example, may corroborate the presence of microorganisms associated with the pictorial surface or organic binders, as previously reported by Moura et al.20 Similarly, the concomitant detection of S and Ca in the red pigment samples may be associated either with the formation of salts, such as sulfates resulting from alteration processes of the rock substrate, or with the possible contribution of adjacent white pigment, considering the spatial proximity between the representations at the EMA site.
The PCA scores and their corresponding loadings for each experimental condition are presented in Figures 3 and 4. Specifically, Figure 3 consolidates the results obtained using the main (Figures 3a and 3b), low (Figures 3c and 3d), and high filters (Figures 3e and 3f), while Figure 4 details the analysis for the light filter. All chemometric models were constructed using equal weighting for all variables, ensuring a comprehensive evaluation across the four instrumental configurations.

PCA results for pXRF spectra obtained with different instrumental filters: (a,b) main filter, (c,d) low filter; and (e,f) high filter. In each case, the left plot shows the scores (PC1 vs. PC2) and on the right, the 2D loadings line plot (PC1 vs. PC2). Symbols represent the archaeological sites: ■ SAP, ♦ EM1, ▂ EMA, ■ FEM, ▼ FI, ◄ T1.

PCA results for pXRF spectra of rock art samples from six sites (light filter, selected spectral region): (a, c) scores, (b, d) 2D loadings line plot. The projections show PC1 vs. PC2 (a, b) and PC1 vs. PC3 (c, d). Symbols represent the archaeological sites: ■ SAP, ● EM1, ▂ EMA, ■ FEM, ▼ FI, ◄ T1.
As shown in Figures 3a, 3b, 3e and 3f, the loading plots (Figures 3b and 3f) exhibit similar profiles. Fe (6.40 keV) shows the highest contribution to PC1, while Zr (15.75 keV) is the main contributor to PC2. Despite the high total variance explained, exceeding 97 and 94%, respectively, no natural clustering of the archaeological site samples was observed (Figures 3a and 3e).
The strong influence of iron on PC1 confirms the chromatic composition of the pigment, since the red hues in rock art are typically derived from hematite (α-Fe2O3). Zirconium, in turn, is commonly associated with zircon micrograins (ZrSiO4), a highly resistant accessory mineral frequently found in siliciclastic sediments and capable of persisting in the rock matrix even after intense weathering processes.21 Its detection is therefore consistent with the geological composition of the sandstone substrate hosting the analyzed rock paintings. The prominent presence of Fe detected via pXRF in the painted areas aligns with recent archaeometric investigations in southern Brazilian rock shelters, where high Fe contents were established as the primary elemental signature associated with red motifs.22
However, in some samples, the Zr signal intensity exceeds that observed in the corresponding substrate blanks, as shown in the pXRF spectra, overlaid on the respective analytical blanks for comparison (see Figures S2 S7 (SI section), main filter). This suggests that, in addition to its natural occurrence in the substrate, zirconium may also be associated with the mineral fraction of the pictorial material, possibly derived from detrital sediments or ochre used in pigment preparation.
Similar situations have been reported in portable X-ray fluorescence studies of rock art, where the elemental signal may reflect contributions from both the rock substrate and the pictorial layer, complicating the distinction between geological components and pigment composition.23 Thus, the orthogonality of the PCA axes indicates that PC1 is mainly related to the chromophoric component of the pigment, dominated by iron, whereas PC2 likely reflects variations in the siliciclastic mineral fraction of the analyzed system.
As illustrated in Figures 3c and 3d, the loading plots (Figure 3d) indicate that iron maintains its predominant influence on PC1. However, on the PC2 axis, a positive influence from K (3.330 keV) and a negative influence from Si (1.740 keV) emerge. This elemental combination within the low filter enhances the visualization of clusters in the score plot (Figure 3c), suggesting that the interaction between these specific variables is key to sample characterization at this instrumental setting.
Figures 4a-4d show the score and loading plots for the first three principal components (PC1, PC2, and PC3), derived from the chemometric analysis of the pXRF spectra obtained with the light filter. These projections allow for the visualization of the spatial distribution of the samples and the identification of the chemical elements that determine the variability among the six archaeological sites.
As shown in Figure 4, PCA demonstrates that the implementation of the light filter was essential for the detection of S (2.310 keV) and P (2.025 keV). Representative pXRF spectra obtained with the light filter, plotted against their corresponding analytical blanks (rock spectra) for comparison, are presented in the SI section (Figures S8-S13). This configuration provided improved discrimination among the archaeological sites (Figure 4a), resulting in more cohesive clustering of samples from the same provenance. The presence of S and P may be associated with both the mineral composition of the arenitic rock substrate and the occurrence of salts on the rock surfaces.24 In the case of phosphorus, in addition to the possible sources previously discussed, its occurrence may also reflect contributions of organic origin, such as droppings from small builder insects.25 These elements were decisive in the separation of the groups, particularly of the EMA and FI sites.
Furthermore, the PCA highlights the variance of key geological markers, notably Si (1.740 keV) and K (3.330 keV). The high intensity of the SiKα line confirms the predominantly siliciclastic nature of the rock shelters (Figure 4b). The samples from the EMA site show higher potassium concentrations, possibly associated with K-bearing minerals in the rock substrate, such as feldspars and micas, as well as K-bearing clay minerals, such as illite, which are commonly associated with mineral pigments. This composition, combined with the porosity of the substrate, favors recurring processes of salt migration and crystallization, culminating in the formation of superficial salt efflorescences.26 On the other hand, the SAP site stands out for presenting samples with high levels of silicon, suggesting a more diluted paint layer over the siliciclastic rock matrix. The enhanced sensitivity of the light filter allowed for the discrimination of these chemical signatures, which would otherwise be attenuated or lost under the higher-energy configurations of the main filter (Figure 3a).
As illustrated in Figures 4c and 4d, a clear discrimination between sites EMA, T1, and SAP is observed along PC1 (45%). Concomitantly, PC3 (19%) reveals the predominant influence of Fe (6.40 keV), particularly within the T1 and SAP groups, distinguishing these sites from the others by their higher associated intensity. Although iron is present in all samples, its relative contribution is significantly more pronounced in T1 and SAP, being decisive for their separation in the multivariate space.
According to Moura et al.,20 variability in iron content should be analyzed from both temporal/conservation and technological perspectives. From a temporal standpoint, older paintings tend to exhibit lower iron concentrations due to progressive physical weathering and lixiviation caused by climatic agents, especially rainwater, over extended periods of exposure. Thus, higher iron levels, such as those observed in T1 and SAP, may indicate a lower impact of these degradation processes and, possibly, correspond to relatively more recent interventions. Alternatively, from a technological perspective, higher iron values may reflect choices in pigment preparation, such as lower dilution of the hematite-based material or the application of thicker pictorial layers, resulting in greater chromatic load and stronger analytical signals. In Figure 5a, PC1 (32%) provides a clearer discrimination of sites SAP, T1, and EMA compared to the light filter shown in Figure 4a.

PCA results based on the pXRF peak intensities of rock art samples from six sites: (a) scores plot (PC1 vs. PC2) and (b) 2D loadings scatter plot. Symbols represent the archaeological sites ■ SAP, ♦ EM1, ▂ EMA, ■ FEM, ▼ FI, ♦ T1.
Unlike the PCAs presented in Figures 3 and 4, the PCA in Figure 5 was constructed using a discrete matrix of peak intensities (maximum heights) for the selected elements. Therefore, its loading plot is a conventional 2D scatter plot, projecting each chemical element instead of continuous energy channels (keV).
The loading plots support this trend, associating Si with higher concentrations in SAP and K with elevated levels in EMA. Additionally, a sharper separation of site FI from sites FEM, EM1, and EMA is observed. This distinction aligns with their geographic distribution (Figure 1a, maps), as the latter three sites are characterized by significant spatial proximity. Along PC2 (22%), sites T1 and FI are further discriminated from the other groups, driven by the presence of iron in their rock art compositions.
New PCAs were evaluated, adding the six analytical blank samples (see Figures S14-S18, SI section). For these PCAs, mean-centering preprocessing (already performed) was applied along with pareto scaling. The projection of the analytical blanks revealed a mixed clustering behavior. Four of the rock substrate samples clustered closely together, indicating a high degree of geochemical homogeneity for the base rock matrix across most of the studied shelters. Conversely, two rock samples stood outliers, positioning themselves closer to the pigment clusters. This behavior reflects the micro-heterogeneity of the rock surfaces, likely influenced by localized weathering crusts or thin mineral alterations.
Conclusions
This research confirmed the efficacy of pXRF combined with PCA as a non-destructive and robust methodology for characterizing rock art pigments. Fe was identified as the primary chromophore across all six archaeological sites in Inhuma (Piauí, Brazil), indicating the systematic use of ferruginous species in paint production. Zr also showed a significant contribution in the PCA, particularly in models associated with the main and high filters, acting as a marker for the arenitic matrix and possibly the mineral fraction associated with the pictorial material, being one of the main factors responsible for the variance in PC2.
The sensitivity of the method was significantly enhanced by the strategic use of the light filter, which enabled the detection of light elements (S, P, Si, K) fundamental for site individualization. The detection of high levels of potassium and sulfur at the EMA site suggests the formation of saline efflorescence and specific interactions with the local mineralogy. Concurrently, the FI site presented phosphorus and sulfur signatures, which may be associated with organic contributions and salt formation at the pigment-substrate interface, while the SAP site stood out for its higher silicon content, suggesting thinner pictorial layers or more diluted pigments over the arenitic matrix. Furthermore, the T1 and SAP sites showed higher iron intensities on PC3 of the light filter model, which may reflect differences in conservation states or technological choices related to the thickness and dilution of the pictorial layers.
Among the chemometric models evaluated, the model based on the average of the maximum values obtained across all filters provided the clearest trend for separating the sites. This model confirmed patterns observed in the individual filters, highlighting higher silicon content in SAP and higher potassium concentrations in EMA. Additionally, it assisted in indicating differences between the FI site and the group formed by FEM, EM1, and EMA, a pattern that corresponds to the spatial distribution of these sites in the studied region.
Altogether, these results demonstrate that the integration of pXRF and chemometric analysis expands the interpretative capacity of spectral data, transforming elemental signatures into robust archaeometric interpretations and providing a scientific basis for future investigations and the development of conservation strategies for the rock art heritage of the region.
Supplementary Information
Supplementary Information (pXRF spectra, PCA plots including analytical blanks, and additional data) is available free of charge at http://jbcs.sbq.org.br as a PDF file.
Supplementary PDF
Acknowledgments
The authors are grateful to the IFMA, for granting the lead author full-time study leave to pursue her doctoral degree. The authors also thank the Federal University of Piauí (UFPI) for providing the infrastructure and access to the portable X-ray fluorescence (pXRF) equipment used for the in situ analyses.
Data Availability Statement
All data supporting the findings of this study are available within the article and its Supplementary Information.
References
-
1 Farias Filho, B. B.; Lage, M. C. S.; Nascimento, A. L. M. D.; Vieira, I. M. R. D. S.; Almeida, D. D. M. D.; Barros, W. O. D.; Quim. Nova 2022, 45, 1265. [Crossref]
» Crossref -
2 Ferretti, M.; Rev. CPC 2009, 7, 74. [Crossref]
» Crossref -
3 Pimenta, A. R.; Felix, V. S.; Silva, D. M.; Pereira, M. O.; Oliveira, A. L.; Ferreira, D. S.; Carvalho, C. S.; Silva, F. L.; Gonçalves, E. A. S.; Dutra, R. S.; Pereira, L. O.; Pereira, R. V.; Freitas, R. P.; Quim. Nova 2022, 45, 297. [Crossref]
» Crossref -
4 Hou, X.; He, Y.; Jones, B. T.; Appl. Spectrosc. Rev. 2004, 39, 1. [Crossref]
» Crossref -
5 Ma, C.; Dou, H.; Zhao, Z.; Qiu, X.; Li, H.; Wang, X.; Heritage Sci. 2025, 13, 222. [Crossref]
» Crossref -
6 Büchele, D.; Chao, M.; Ostermann, M.; Leenen, M.; Bald, I.; Sci. Rep. 2019, 9, 17588. [Crossref]
» Crossref - 7 Ferreira, M. M. C.; Quimiometria: Conceitos, Métodos e Aplicações; Editora da UNICAMP: Campinas, Brazil, 2015.
-
8 Shimamoto, G. G.: Potencialidades da Fluorescência de Raios X Aliada à Quimiometria na Análise de Cosméticos e Alimentos; MSc Dissertation, State University of Campinas, Campinas, Brazil, 2013. [Link] accessed in August 2026
» Link -
9 de Souza, A. M.; Poppi, R. J.; Quim. Nova 2012, 35, 223. [Crossref]
» Crossref -
10 Lage, M. C. S. M.; Rev. Mus. Arqueol. Etnol. 1997, Supl. 2, 89. [Crossref]
» Crossref -
11 Cavalcante, L. C. D.; da Luz, M. F.; Guidon, N.; Fabris, J. D.; Ardisson, J. D.; Hyperfine Interact. 2011, 203, 39. [Crossref]
» Crossref - 12 Casqueira, R. G.; Santos, S. F.; Pigmentos Inorgânicos: Propriedades, Métodos de Síntese e Aplicações; CETEM/MCT: Rio de Janeiro, Brazil, 2008.
-
13 Aramendia, J.; Vallejuelo, S. F. O.; Maguregui, M.; Martinez Arkarazo, I.; Giakoumaki, A.; Martí, A. P.; Madariaga, J. M.; Ruiz, J. F.; Anal. Bioanal. Chem. 2020, 412, 8155. [Crossref]
» Crossref -
14 Cavalcante, L. C. D.: Caracterização Arqueométrica de Pinturas Rupestres Pré-Históricas, Pigmentos Minerais Naturais e Eflorescências Salinas de Sítios Arqueológicos; PhD Thesis, Federal University of Minas Gerais, Belo Horizonte, Brazil, 2012. [Link] accessed in August 2026
» Link -
15 Cavalcante, L. C. D.; Farias Filho, B. B.; Santos, L. M.; Fontes, L. M.; Lage, M. C. S. M.; Fabris, J. D.; Arqueol. Iberoam. 2013, 18, 3. [Crossref]
» Crossref -
16 Cavalcante, L. C. D.; Freitas, E. V.; Carvalho, C. D. C.; Sousa, J. W. L.; Arqueol. Iberoam. 2023, 52, 135. [Crossref]
» Crossref -
17 Cavalcante, L. C. D.; Silva, E. V. F.; Carvalho, C. D. C.; Arqueol. Iberoam. 2024, 54, 77. [Crossref]
» Crossref - 18 R Core Team; R: A Language and Environment for Statistical Computing; R Foundation for Statistical Computing; Vienna, Austria, 2026.
- 19 The Unscrambler® X, version 10.1; CAMO Software AS; Oslo, Norway, 2009.
- 20 Moura, J. I.; Lage, M. C. S. M.; Farias Filho, B. B.; Barros, W. O.; Brito, A. L. B.; Lustosa, L. M. In O Ensino e a Pesquisa em Química 3; Moura, P. H. M., ed.; Atena Editora: Ponta Grossa, Brazil, 2021, ch. 6.
-
21 Franco, R. R.; Bol. Fac. Filos. Ciênc. Let. Univ. São Paulo, Mineral. 1945, 7, 7.[Crossref]
» Crossref -
22 Melquiades, F. L.; Jussiani, E. I.; Parellada, C. I.; Gomes, G. R.; Appoloni, C. R.; Radiat. Phys. Chem 2026, 240, 113418. [Crossref]
» Crossref -
23 Huntley, J.; Aust. Archaeol. 2012, 75, 78. [Crossref]
» Crossref -
24 Lima, N. M. B.; Farias Filho, B. B.; da Silva, I. J. G.; dos Santos, F. E. P.; Azevedo, M. M. F.; Barros, W. O.; X-Ray Spectrom. 2025, 54, 537. [Crossref]
» Crossref -
25 Alves, T. L.; de Brito, M. A. M. L.; Lage, M. C. S. M.; Cavalcante, L. C. D.; Fabris, J. D.; Quim. Nova 2011, 34, 181. [Crossref]
» Crossref -
26 Cavalcante, L. C. D.; Fabris, J. D.; Lage, M. C. S. M.; Clio Arqueol. 2015, 30, 120. [Crossref]
» Crossref
Edited by
-
Editor handled this article:
César Ricardo Teixeira Tarley (Associate)