Multi-Spectroscopic and Molecular Docking Insights into the Effects of Structural Differences among Three Curcuminoids on β-Lactoglobulin Glycation
Abstract
The accumulation of advanced glycation end products (AGEs) contributes to various chronic diseases. In this study, using a lactose (Lac)-induced glycation model of β-lactoglobulin (BLG), we investigated the inhibitory effects of curcumin (CUR), demethoxycurcumin (DMC), and tetrahydrocurcumin (THC) on AGEs formation, with efficacy following the order: CUR > DMC > THC. Spectroscopic and microscopic techniques confirmed their ability to prevent glycation-induced conformational changes and aggregation of BLG. Fluorescence spectroscopy, molecular docking, and radical scavenging assays indicated a potential mechanism that might involve the occupation of glycation sites (Lysine 60 (Lys60) and Lysine 69 (Lys69)) of BLG, with inhibitory potency correlating with their binding affinity. Molecular dynamics (MD) simulations confirmed the structural stability of the complexes formed between BLG and the three curcuminoids. Furthermore, intracellular reactive oxygen species (ROS) assays showed that they not only alleviate cellular oxidative stress by inhibiting the production of AGEs, but also mitigate AGEs-induced cellular oxidative damage. These findings elucidate how minute structural differences among the three curcuminoids influence their ability to inhibit AGEs formation, suggesting potential mechanisms for their suppression of BLG glycation, providing a theoretical basis for developing natural anti-glycation agents.
Keywords:
β-lactoglobulin; curcuminoids; glycation; interaction; binding affinity; free radical scavenging
Introduction
Glycation, also referred to as the Maillard reaction (MR), is a spontaneous, non-enzymatic reaction process that occurs between the carbonyl groups of reducing sugars and the amino groups of proteins, lipids, or nucleic acids.1 This complex reaction occurs in three stages and finally results in the formation of advanced glycation end products (AGEs).2,3 The accumulation of AGEs in blood and tissues is closely associated with diabetic vascular complications (DVC), as these compounds induce oxidative stress and inflammatory responses in endothelial cells, thereby contributing to vascular damage.4 AGEs can be classified into endogenous or exogenous based on their sources.5 Exogenous AGEs, primarily derived from dietary intake, significantly contribute to the overall AGEs burden in the body. In dairy products processing, thermal treatments are commonly employed to reduce bacteria and extend shelf life.6 Given the high lactose (Lac) content in milk, milk proteins are susceptible to MR during heating.7 β-Lactoglobulin (BLG), a widely studied food protein and a major whey protein in milk, accounts for about 50% of total whey proteins and consists of 162 amino acids.8 Gasparini et al.9 identified multiple lactosylated sites in BLG after ultra-high temperature treatment of whey samples. Kong et al.10 compared the effects of temperature, time, pH, and sugar type on AGEs formation in BLG, highlighting its propensity for glycation. Therefore, inhibiting AGEs formation in BLG represents an effective strategy for preventing DVC. Aminoguanidine (AG) has been shown to effectively inhibit AGEs formation.11 However, AG is associated with several severe side effects, including pernicious anemia, lupus, vasculitis, and liver dysfunction, which prevent its therapeutic application for AGEs inhibition.12 Therefore, identifying natural compounds that can effectively inhibit AGEs formation is critically important.
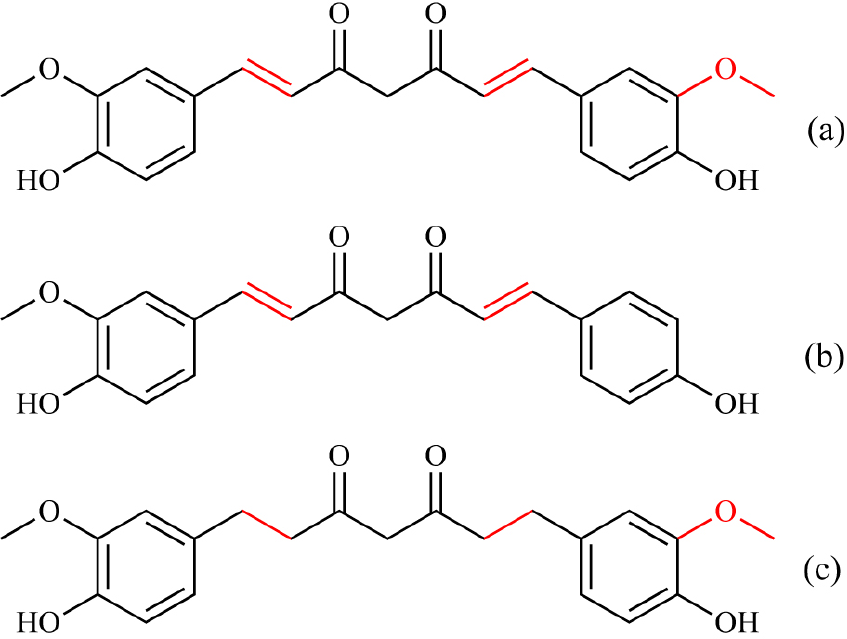
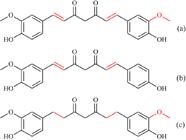
Numerous studies have demonstrated that many natural polyphenols, including phenolic acids, flavonoids, and stilbenes, exhibit significant inhibitory effects on AGEs formation.3,13 The inhibitory mechanisms of natural polyphenols on AGEs include competitive binding to proteins, scavenging free radicals, chelating metal ions, and capturing α-dicarbonyl compounds, among others.13 Sarmah et al.14 reported that naringin and naringenin inhibit AGEs formation primarily by occupying glycation sites on human serum albumin (HSA), thereby preventing the initial stages of the MR. Curcumin (CUR, Figure 1a), a natural polyphenol extracted from the rhizomes of turmeric, exhibits anti-inflammatory, antioxidant, lipid-lowering, anti-atherosclerosis, anti-cancer, and other therapeutic effects.15,16 Demethoxycurcumin (DMC, Figure 1b), a derivative of CUR, is characterized by the absence of a methoxy group in its structure. Tetrahydrocurcumin (THC, Figure 1c), a major metabolite of CUR, lacks two double bonds in its molecular structure compared to CUR. Studies17,18 have shown that compared to CUR, DMC and THC not only have similar pharmacological activities, but also exhibit better solubility, stability, and bioavailability. Zhang et al.19 and Sneharani et al.20 reported the binding of CUR to lysine 60 (Lys60) and lysine 69 (Lys69) sites in BLG. However, these studies did not establish the connection between the interaction and anti-glycation effects. Li et al.21 reported the inhibitory effects of CUR and DMC on bovine serum albumin (BSA) glycation, though their study did not explore underlying mechanisms such as binding site occupation or free radical scavenging in depth. Yu et al.22 investigated the inhibitory effect of CUR on BSA glycation but focused primarily on the inhibitory effect without examining the mechanism. Notably, there is currently no data available on the inhibitory effect of THC on AGEs, and the inhibitory mechanism of DMC remains unclear. Therefore, it is imperative to investigate how the subtle structural differences among these three similar polyphenols influence their inhibitory effects on AGEs formation. It should be emphasized that the inhibitory effect of polyphenols on AGEs formation is closely related to their interactions with proteins.23,24 Ma et al.23 demonstrated that isoquercetin can inhibit fructose-induced AGEs formation by occupying glycation sites through its interaction with BLG. Therefore, the interaction study of CUR, DMC, and THC with BLG can provide a theoretical basis for understanding their inhibitory mechanisms and elucidating the effects of different molecular structures on suppressing AGEs formation.
In this study, we constructed and characterized a Lac induced BLG glycation model. The inhibitory effects of CUR, DMC, and THC on AGEs formation were evaluated. To elucidate the inhibitory mechanisms of these three polyphenols, their interactions with BLG or glycated BLG were investigated by multi-spectroscopic techniques, molecular docking, and molecular dynamics (MD) simulation. The radical scavenging activities of CUR, DMC, and THC were evaluated. Furthermore, we also investigated their inhibitory effects on the intracellular oxidative stress induced by AGEs. This study may provide a theoretical foundation for the potential application of CUR, DMC, and THC as natural inhibitors of AGEs formation, offering insights into how their minor structural differences affect their ability to inhibit BLG glycation.
Experimental
Materials and reagents
β-Lactoglobulin (BLG, molecular weight (MW) = 18300 Da), lactose (Lac), curcumin (CUR), demethoxycurcumin (DMC), tetrahydrocurcumin (THC), aminoguanidine hydrochloride (AG), vitamin C (VC), o-phthaldialdenhyde (OPA), trichloroacetic acid (TCA, 20%, m/v), diammonium 2,2’-azino-bis (3-ethylbenzothiazoline-6-sulfonate) (ABTS), 2,2’-azobis (2-methylpropionamidine) dihydrochloride (AAPH), and 2’,7’-dichlor-odihydrofuorescein diacetate (DCFH-DA) were all purchased from Yuanye Biotechnology Co., Ltd. (Shanghai, China). The purity of the above materials, except for BLG and TCA, was higher than 98%. Human Umbilical Vein Cell Fusion Cells (EA. hy926) were provided by Chinese Academy of Sciences Cell Bank (Shanghai, China). CUR, DMC, and THC were dissolved in ethanol, ensuring that the ethanol content in all samples did not exceed 2%.
Construction of AGEs model and the inhibitory effects of CUR/DMC/THC on AGEs formation
Construction of AGEs model
AGEs model was constructed based on reported methods with slight modifications.10,23 Briefly, BLG (0.1 mmol L-1) and Lac (150 mmol L-1) were mixed in 0.1 mol L-1 phosphate buffer (PBS, pH 7.4) and incubated at 70 °C. After the samples were taken out at different times and diluted to 20 μmol L-1, their fluorescence intensity was monitored at 360-600 nm (λex = 340 nm) using an F-7000 spectrofluorometer (Hitachi, Japan). The fluorescence intensity of native BLG was subtracted for blank correction. The reaction was terminated when the fluorescence intensity reached saturation.
Inhibition rate of CUR, DMC, and THC on AGEs formation
The inhibitory effects of CUR, DMC, and THC on AGEs formation were evaluated. BLG + Lac + CUR/DMC/THC/AG, BLG + Lac, BLG + CUR/DMC/THC/AG, and BLG samples were prepared as positive group, control group, negative group, and blank group, respectively. CUR and DMC concentrations were set at 0.030, 0.035, 0.040, 0.045, 0.050, and 0.055 mmol L-1; THC concentrations at 0.1, 0.2, 0.3, 0.4, 0.5, and 0.6 mmol L-1; and AG concentrations at 0.50, 0.65, 0.80, 0.95, 1.10, and 1.25 mmol L-1. Fluorescence measurements followed the conditions described in “Construction of AGEs model” sub-section. AG was employed as a reference inhibitor. The inhibition rate was calculated by equation 1:23
where Fc, Fb, Fp, and Fn represent the fluorescence intensities of the control, blank, positive, and negative groups, respectively. CompuSyn 1.0 (ComboSyn, Inc., Paramus, USA, 2005) software was used to calculate the half maximal inhibitory concentration (IC50).
Carbonyl and thiol (SH) content
The mixtures of BLG (0.1 mmol L-1) and Lac (150 mmol L-1) in the absence or presence of CUR/DMC/THC (0.1 mmol L-1) were incubated at 70 °C for 24 h, followed by dialysis against PBS (pH 7.4, 10 mmol L-1) at 4 °C for 48 h to remove free Lac. The obtained samples were freeze-dried and stored at -20 °C for the determination of carbonyl content and subsequent experiments. Carbonyl content was quantified using the 2,4-dinitrophenylhydrazine (DNPH) method.25 Briefly, the sample solutions of BLG, AGEs, or BLG + Lac + CUR/DMC/THC (1.5 mg mL-1, 1.2 mL) were reacted with DNPH (10 mmol L-1, 4.8 mL, dissolved in 2.5 mol L-1 HCl) in the dark for 1 h, followed by precipitation with TCA (6 mL). The precipitates were washed with a mixture of ethanol:ethyl acetate (1:1, v/v) and dissolved in guanidine hydrochloride (6 mol L-1, 3 mL). The sample solutions without DNPH were used as blank groups. The absorbance at 370 nm was measured using a U-3900H UV-VIS spectrophotometer (Hitachi, Japan). Carbonyl content was determined by the molar extinction coefficient of 22000 L M-1 cm-1.25 Unless otherwise specified, the samples were dissolved in PBS (pH 7.4, 10 mmol L-1).
Free SH content was measured using Ellman’s method.26 The sample solutions (1.5 mg mL-1, 3 mL) were mixed with 5,5-dithiobis (2-nitrobenzoic acid) (DTNB, 4 mg mL-1, 50 μL) and incubated at 25 °C for 30 min. Free SH content was determined according to the absorbance at 412 nm and the molar extinction coefficient of 13600 L M-1 cm-1.27
Free amino content
Free amino content was determined using the o-phthaldialdenhyde (OPA) method.28 The OPA reagent was prepared by dissolving OPA (40 mg) in methanol (1 mL), mixing it with sodium dodecyl sulfate (2.5 mL, 20%, m/v), β-mercaptoethanol (100 μL), and borax (0.1 mol L-1, 25 mL), and diluting the resulting mixture to 50 mL with deionized water. The prepared reagent (3 mL) was mixed with the sample solution (2 mg mL-1, 150 μL) and incubated at 35 °C for 2 min. The relative free amino content of AGEs and BLG + Lac + CUR/DMC/THC was calculated by comparing their absorbance at 340 nm with that of BLG.
Conformational change analysis
Circular dichroism (CD) spectroscopy
The CD spectra of BLG, AGEs, and BLG + Lac + CUR/DMC/THC were measured using a Jasco J-810 spectropolarimeter (Tokyo, Japan) with a quartz cell of 1.00 cm path length. Scans were conducted over 190 240 nm with all sample molarities fixed at 15 μmol L-1. The CD spectra were quantified using DichroWeb (The lab of Professor Wallace, B. A., London, UK, 2001) online CD analysis.
Dynamic light scattering (DLS)
The hydrodynamic diameter (Dh) and zeta potential of BLG, AGEs, and BLG + Lac + CUR/DMC/THC were measured using a Zetasizer Nano ZS (Malvern Instruments, Worcestershire, UK) at 25 °C. A 4 mW He-Ne laser (633 nm wavelength) was used with a detection angle of 173°. The tested samples (10 μmol L-1) were filtered through 0.22 μm filter membranes before measurement.
Aggregation analysis
Scanning electron microscopy (SEM)
Microstructural images of BLG, AGEs, and BLG + Lac + CUR/DMC/THC were captured using an FIB SEM GX4 scanning electron microscope (Thermo Fisher Scientific, USA). The samples were mounted on a conductive plate, sputter-coated with gold, and imaged under low-vacuum conditions at an accelerated voltage of 10 kV.
Sodium dodecyl sulfate-polyacrylamide gel electrophoresis (SDS-PAGE)
SDS-PAGE was performed using 5% stacking gel and 12% separating gel. The sample solutions of BLG, AGEs, and BLG + Lac + CUR/DMC/THC (3 mg mL-1) were mixed with 5× protein sample uploading buffer, boiled for 5 min, and centrifuged at 4000 rpm for 5 min. Aliquots (10 μL) were loaded into each well, and electrophoresis was conducted at 80 V for 30 min, followed by 120 V for 1 h. The gels were stained and destained with Coomassie brilliant blue R250 and a mixture containing 10% acetic acid and 45% methanol, respectively.
Analysis of glycation site
Fluorescence spectroscopy of BLG/AGEs + CUR/DMC/THC system
The fluorescence properties of the BLG/AGEs + CUR/DMC/THC systems were evaluated using an F-7000 spectrofluorometer, with the molarity of BLG and AGEs fixed at 4 μmol L-1. The binding of CUR, DMC, or THC to BLG was conducted at 25, 31, and 37 °C, with molar ratios of CUR, DMC, and THC to BLG ranging from 0 to 12, 0 to 12, and 0 to 21, respectively. For their binding to AGEs at 25 °C, the molar ratios of CUR, DMC, and THC to AGEs were 0-3, 0-12, and 0-21, respectively. After incubation for 30 min, fluorescence spectra were recorded between 300 and 450 nm (λex = 280 nm). Fluorescence intensity data were corrected for background interference and inner-filter effects.
Time-resolved fluorescence analysis
Time-resolved fluorescence spectroscopy was employed to determine the effects of CUR, DMC, and THC on the fluorescence lifetimes of BLG and AGEs. The concentrations of BLG/AGEs and curcuminoids were 4 and 12 μmol L-1, respectively. Prior to measurement, the samples were incubated at 25 °C for 30 min. The excitation (λex) and emission (λem) wavelengths were set at 280 and 337 nm, respectively.
Electrostatic potential (ESP) calculation
Molecular structure optimization and ESP calculations for CUR, DMC, and THC were performed using Gaussian 09W29 software, with Gauss View 5.0 employed for molecular assembly and visualization. All calculations were based on density functional theory using the B3LYP functional and the 6-31G* basis set. During the calculation, the Route Section keyword was set to # opt freq b3lyp/6-31g* geom=connectivity to simultaneously perform geometry optimization and frequency analysis. All molecules were in the neutral singlet state.
Molecular docking and MD simulation studies
Molecular docking analysis of CUR, DMC, or THC with BLG was conducted using AutoDock Vina 1.2.0 (The Center for Computational Structural Biology, La Jolla, USA, 2021) software. The structures of BLG (ID: 1B0O) and CUR/DMC/THC were obtained from Protein Data Bank30 and Automated Topology Builder,31 respectively. The grid size and spacing were 126 Å × 126 Å × 126 Å and 0.375 Å, respectively, covering all active sites. The docked complexes with the lowest binding energy were visualized and analyzed using Discovery Studio 2019 (BIOVIA, San Diego, USA, 2019) software.
MD simulations were conducted to investigate the molecular interactions between BLG and three ligands (DMC, CUR, or THC) using GROMACS 2023.332 with the Amber99sb-star-ildnp. ff force field. After equilibration for 0.1 ns in the canonical ensemble and isothermal-isobaric ensemble ensembles respectively, a 100 ns molecular dynamics (MD) simulation was performed.
ABTS•+ radical scavenging activity
The antioxidant capacities of CUR, DMC, and THC were evaluated using 2,2’-azino-bis(3-ethylbenzothiazoline-6-sulfonic acid) (ABTS•+) free radical scavenging activity, with VC as a positive control. ABTS (2.5 mmol L-1) and AAPH (1 mmol L-1) were mixed and incubated at 68 °C for 40 min to generate ABTS•+. The solution was cooled to room temperature in the dark and diluted to an absorbance of 0.76 at 734 nm. ABTS·+ solution (2.94 mL) was mixed with CUR/DMC/THC/VC (60 μL at concentrations of 5 10 μmol L-1) and incubated at 25 °C for 30 min. The experimental scavenging capacity (ESC) was calculated by equation 2:33
where A and A0 represent the absorbance of ABTS⋅+ solution at 734 nm with or without the antioxidants, respectively.
Measurement of intracellular reactive oxygen species (ROS) production
Intracellular ROS levels were detected using the DCFH DA fluorescent probe method as reported by Cao et al.4 Briefly, EA. hy926 cells were seeded into 24-well plates at a density of 1 × 10⁵ cells per well and cultured at 37 °C for 24 h. Subsequently, the Dulbecco’s Modified Eagle Medium (DMEM) was discarded, and all wells were washed with PBS. The cells were treated with AGEs (200 μg mL-1), BLG + Lac + CUR/DMC/THC lyophilized powder (200 μg mL-1), or a mixture of AGEs (200 μg mL-1) and CUR/DMC/THC (40 mol L-1) for 12 h. The control group was cultured in DMEM. The cells were washed with PBS and incubated with 10 μmol L-1 DCFH DA for 30 min, then washed three times with PBS to remove the free probes. Fluorescence images were acquired using an inverted fluorescence microscope (IX 73, Olympus, Tokyo, Japan) and analyzed for fluorescence intensity using ImageJ 1.54j (The National Institutes of Health, Bethesda, USA, 2019) software.
Statistical analysis
All experiments were conducted in triplicate. Data analysis and plotting were performed using Origin 9.0 (Origin Lab Corp., Northampton, USA, 2012). SPSS 19.0 (IBM Corp., New York, USA, 2010) software was used for one-way analysis of variance, with p < 0.05 indicating significant differences.
Results and Discussion
Fluorescence spectroscopic characterization of AGEs formation
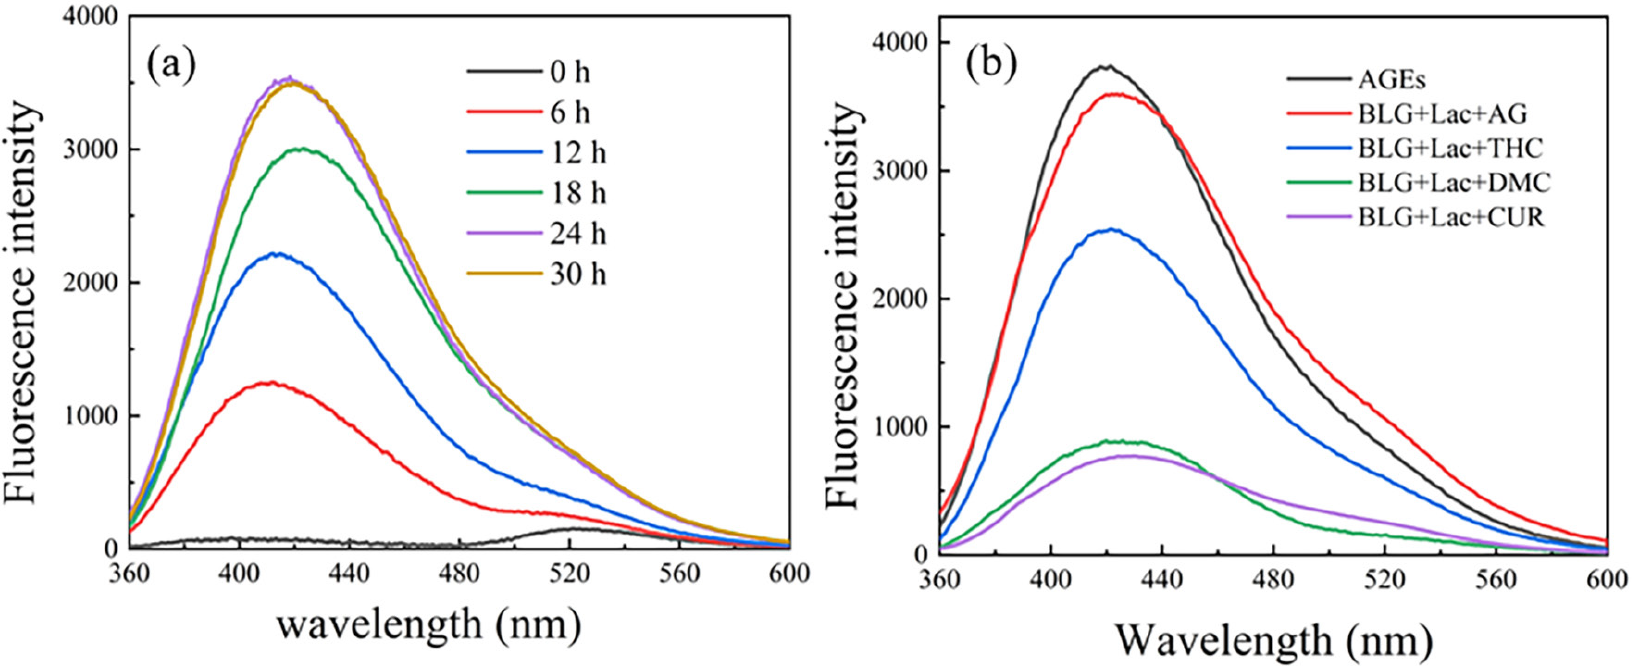
The fluorescence intensity of Lac-induced BLG glycation was monitored over time, as shown in Figure 2a. Upon induction by Lac, BLG exhibited a characteristic peak at 420 nm, indicative of the formation of fluorescent cross-linked AGEs, such as argpyrimidine and pentosidine.34,35 Fluorescent AGEs, which constitute the majority of AGEs, are widely used as markers for measuring total AGEs.36 The fluorescence intensity increased over time and reached saturation at 24 h, indicating the formation of an AGEs model of BLG induced by Lac at 70 °C. This observation is consistent with the fructose-induced glycation model of BLG reported by Ma et al.,23 which was formed after incubation at 55 °C for 24 h.
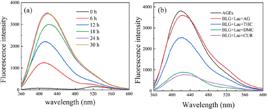
Fluorescence spectra of AGEs over time (a), fluorescence spectra of AGEs and BLG + Lac + CUR/DMC/THC/AG at 24 h (b). The concentrations of BLG, Lac, and CUR/DMC/THC/AG were 0.1, 150, and 0.1 mmol L-1, respectively (n = 3, p < 0.05).
Inhibition of AGEs formation by CUR, DMC, and THC
Fluorescence intensity characterization of inhibitory effects
The inhibitory effects of CUR, DMC, and THC on AGEs were evaluated by monitoring changes in fluorescence intensity. As shown in Figure 2b, the fluorescence intensity decreased after the addition of CUR, DMC, or THC, indicating their potential to inhibit AGEs formation. This observation is consistent with previous findings by Ma et al.,23 who reported that the inhibitory effect of isoquercitrin on AGEs generation could be similarly assessed through fluorescence intensity changes. At a concentration of 0.1 mmol L-1, the inhibition rates of CUR, DMC, THC, and AG were determined to be 82.3, 76.5, 25.9, and 5.3%, respectively. This indicated that their inhibitory ability on AGEs followed the trend of CUR > DMC > THC > AG.
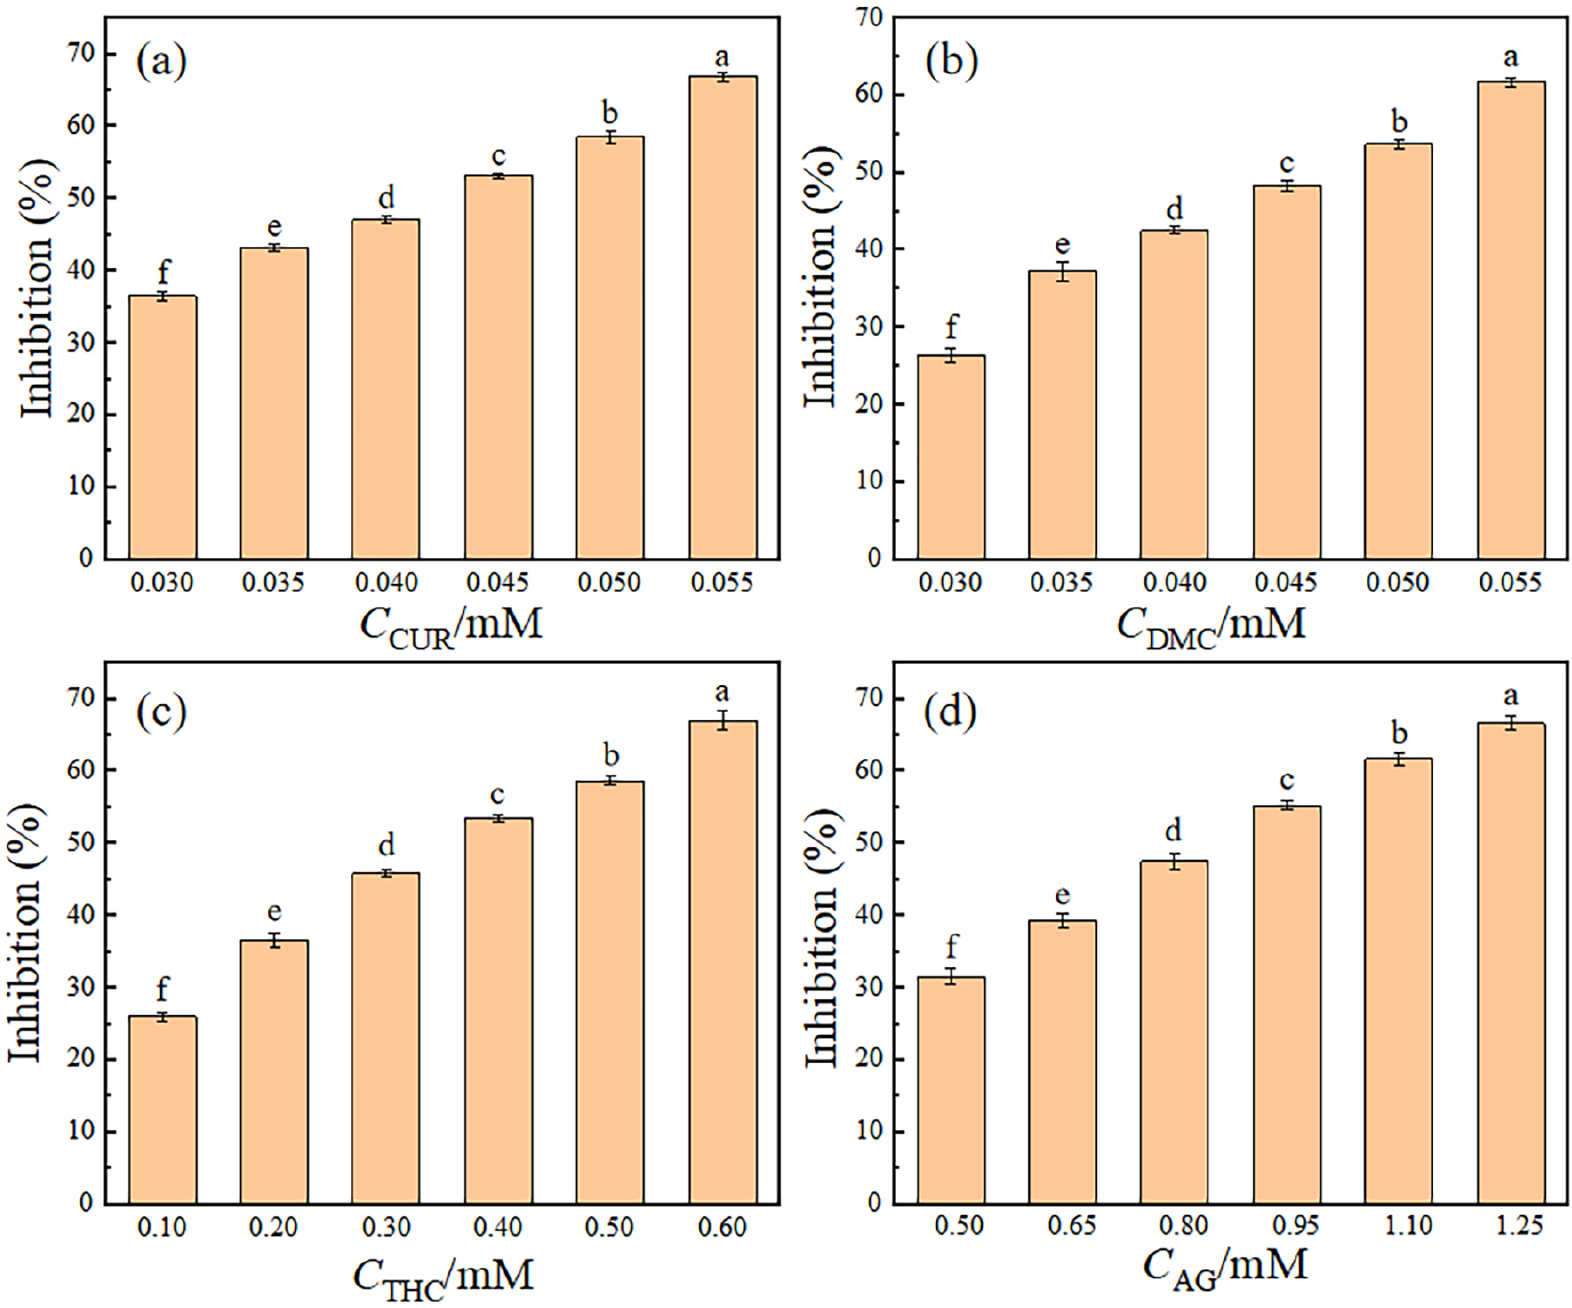
To further quantify the inhibitory ability of CUR, DMC, and THC, their IC50 values were calculated. Figure 3 represents the inhibition percentages of AGEs by different concentrations of CUR, DMC, THC, and AG. The inhibition effects of CUR, DMC, THC, and AG on AGEs are concentration dependent, with IC50 values of 0.041, 0.047, 0.335, and 0.910 mmol L-1, respectively. The smaller IC50 value of CUR (30.5 μmol L-1) compared to DMC (35.0 μmol L-1) was reported by Li et al.21 in their work on inhibiting AGEs formation in the fructose-BSA system. This further confirms the inhibition trend of CUR > DMC > THC, indicating that CUR and its structural analogs can serve as effective AGEs inhibitors. The inhibitory effect is related to their inhibitory mechanisms, such as the occupation of glycation sites and free radical scavenging, which deserves further investigation.
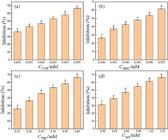
Percentage inhibition of AGEs formation by different concentrations of CUR (a), DMC (b), THC (c), and AG (d). Different letters indicated significant difference (n = 3, p < 0.05).
Carbonyl and SH content
Protein glycation is often accompanied by oxidative modifications, as evidenced by significant changes in carbonyl and SH content.37 As shown in Table 1, the carbonyl and SH contents of native BLG were 4.83 ± 0.08 and 27.8 ± 0.24 μmol g-1, respectively. After glycation, the carbonyl content showed a marked 5.6-fold increase while free SH groups were reduced by 93%. These changes may reflect protein oxidation mediated by α-dicarbonyl compounds, which generate free radicals that oxidize amino acid residues (forming carbonyl groups) and promote disulfide bond formation (depleting free SH groups).38 Treatment with CUR, DMC, or THC mitigated these changes. This means that the three curcuminoids can effectively counteract these oxidative changes, with THC exhibiting significantly greater protection than CUR and DMC in both carbonyl reduction and SH preservation. Interestingly, the trend of THC > CUR > DMC is different from their inhibitory effect on AGEs formation. This discrepancy may originate from the superior direct antioxidant capacity of THC (as detailed in the subsequent antioxidant activity analysis). The formation of protein carbonyls and the loss of sulfhydryl groups are direct markers of oxidative damage. THC provides robust antioxidant protection to the protein, significantly contributing to the suppression of these two indicators. However, the overall inhibition of AGEs formation is a more complex process. While oxidative protection primarily reflects their free radical scavenging ability, the suppression of AGEs involves additional mechanisms, such as the occupation of glycation sites. The ultimate inhibitory effect is a combined contribution of different mechanisms. Although CUR and DMC exhibit lower antioxidant capacity than THC, they may be more effective in other glycation-inhibition mechanisms, such as the occupation of glycation sites, as discussed in the following sections on fluorescence quenching, molecular docking, and MD simulations.
Carbonyl content, SH content, Dh, and zeta potential of BLG, AGEs, and BLG + Lac + CUR/DMC/THC
Free amino content
Due to the covalent reaction between the carbonyl groups of reducing sugars and the amino groups of proteins in MR,1 amino group depletion can serve as a reliable indicator of glycation extent. As illustrated in Figure S1 (Supplementary Information (SI) section), glycation reduced free amino groups to 43.2% of native BLG levels, while treatment with CUR, DMC, and THC markedly restored amino content to 82.1, 76.4, and 64.5%, respectively. These findings demonstrate their capacity to inhibit Lac-induced BLG glycation. This is consistent with the protective effect of phloretin and phlorizin on the amino groups in glycated HAS.39 Moreover, these compounds exhibited a consistent potency order (CUR > DMC > THC) for both amino group protection and glycation inhibition, indicating that they may interfere with the early glycation stage through amino group shielding.
Conformational change analysis
CD spectroscopy
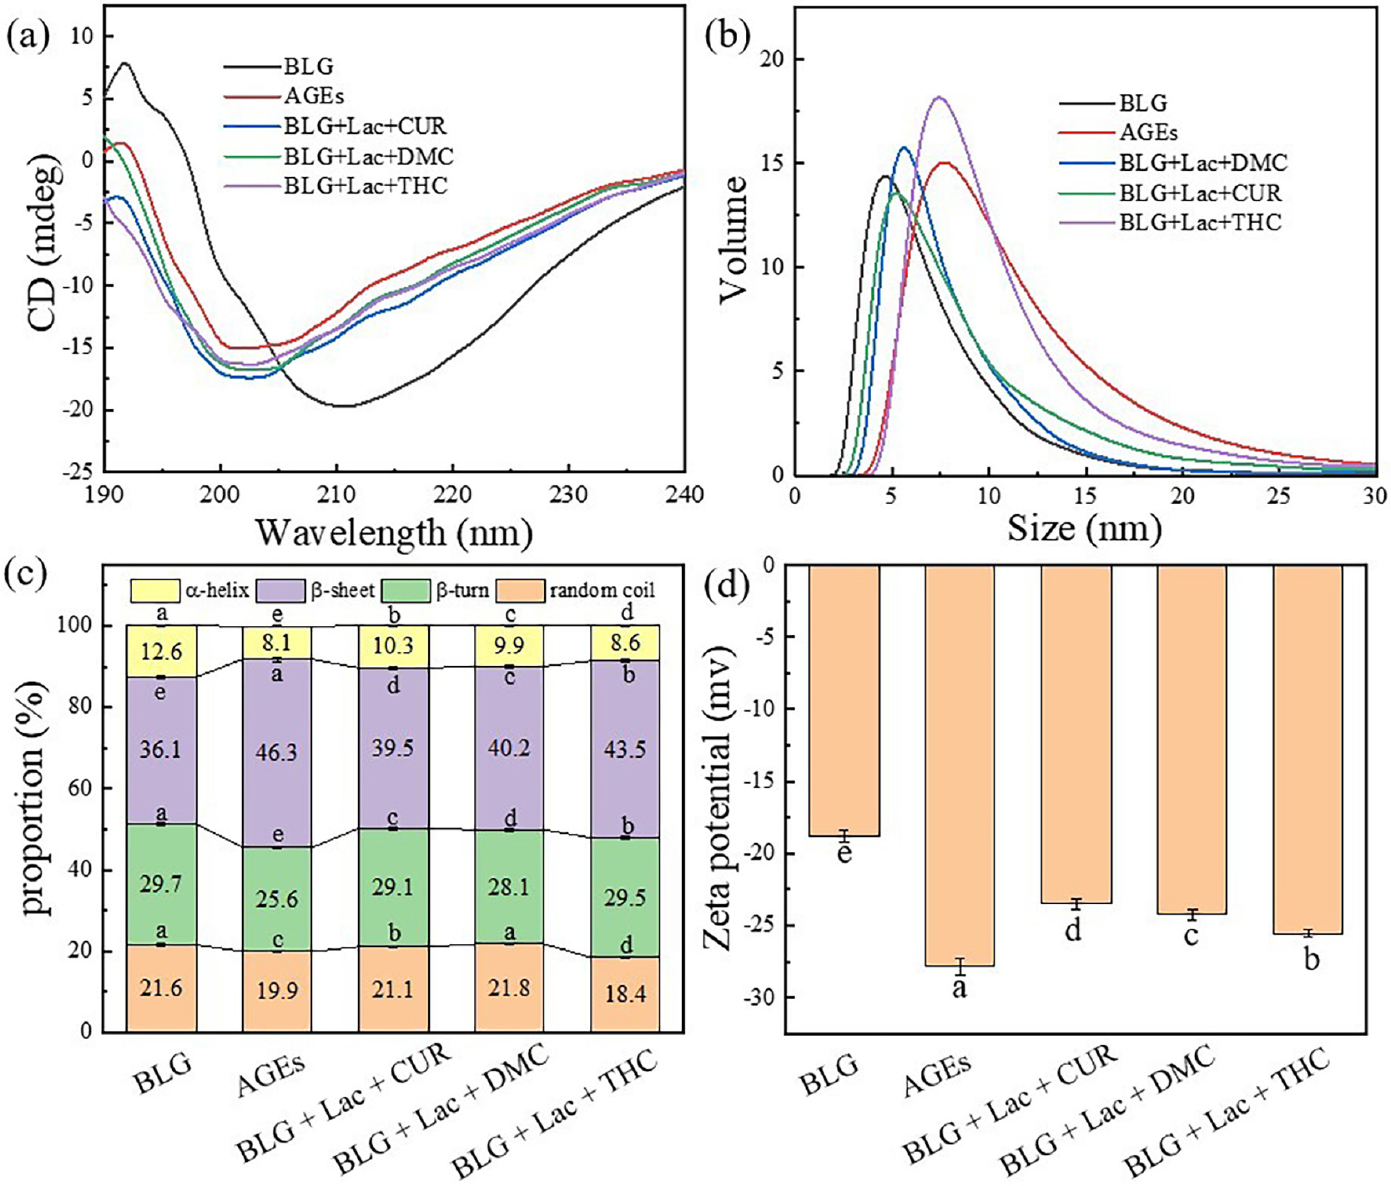
BLG glycation generates AGEs that alter the secondary structure of the protein, while glycation inhibitors can protect this structural integrity. CD spectroscopy is commonly used to investigate the secondary structure of proteins. As shown in Figure 4a, native BLG exhibited a characteristic β-sheet signal at 211 nm.40 Glycation reduced this peak intensity and induced a new negative band at 202 nm, confirming secondary structure modification. In the presence of CUR, DMC, or THC, the partial intensity restoration observed in the CD spectrum demonstrates their protective effects against glycation-induced structural alterations in BLG.
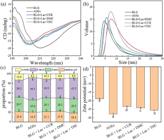
CD spectra (a), size (b), secondary structure contents (c), and zeta potential (d) of BLG, AGEs, and BLG + Lac + CUR/DMC/THC (n = 3, p < 0.05).
Secondary structure quantification (Figure 4c) showed native BLG contains 12.6% α-helix, 36.1% β-sheet, 21.6% β-turn, and 29.7% random coil, consistent with the results obtained by Song et al.40 Glycation decreased α-helix content to 8.1% while increasing β-sheet to 46.3%, mirroring the methylglyoxal (MGO)-induced structural transitions in HSA reported by Wei et al.39 With the addition of CUR, DMC, and THC, the α-helix content increased to 10.3, 9.9, and 8.6%, respectively, while the β-sheet content decreased to 39.5, 40.2, and 43.5%, respectively, bringing the secondary structure closer to that of native BLG. These results align with previously reported protective effects of oleanolic acid against glycation-induced secondary structural changes in BSA.41 The above results indicated that the three curcuminoids protected the secondary structure of BLG by preventing the glycation-induced misfolding transition from α-helix to β-sheet. The strongest and weakest protective effects observed for CUR and THC, respectively, are likely associated with their different binding affinities to BLG.
DLS
The glycation of BLG to form AGEs can also alter its particle size and surface potential. DLS analysis revealed significant changes in BLG’s Dh and zeta potential following glycation (Figures 4b and 4d, Table 1). The Dh and zeta potential of native BLG were measured to be 4.84 ± 0.03 nm and -18.82 ± 0.40 mV, respectively, in agreement with literature values.33,42 The glycation caused an increase in Dh, indicating structural expansion, while the enhanced negative zeta potential (-27.80 ± 0.61 mV) might be attributed to the introduction of additional negatively charged groups and exposure of buried anionic residues through glycation.
Following the addition of the three curcuminoids, both the Dh and zeta potential of BLG were restored to levels closer to those of native BLG. This further demonstrated that they can stabilize the structure of BLG and protect it against glycation-induced modifications. CUR exhibited the strongest protective effect, followed by DMC and THC. This efficacy ranking was consistent with both the CD results and the known binding affinities of these compounds to BLG. The differential protection may originate from variations in binding forces among the curcuminoids, distinct binding site orientations, and differential shielding of Lys residues.
Aggregation analysis
SEM analysis
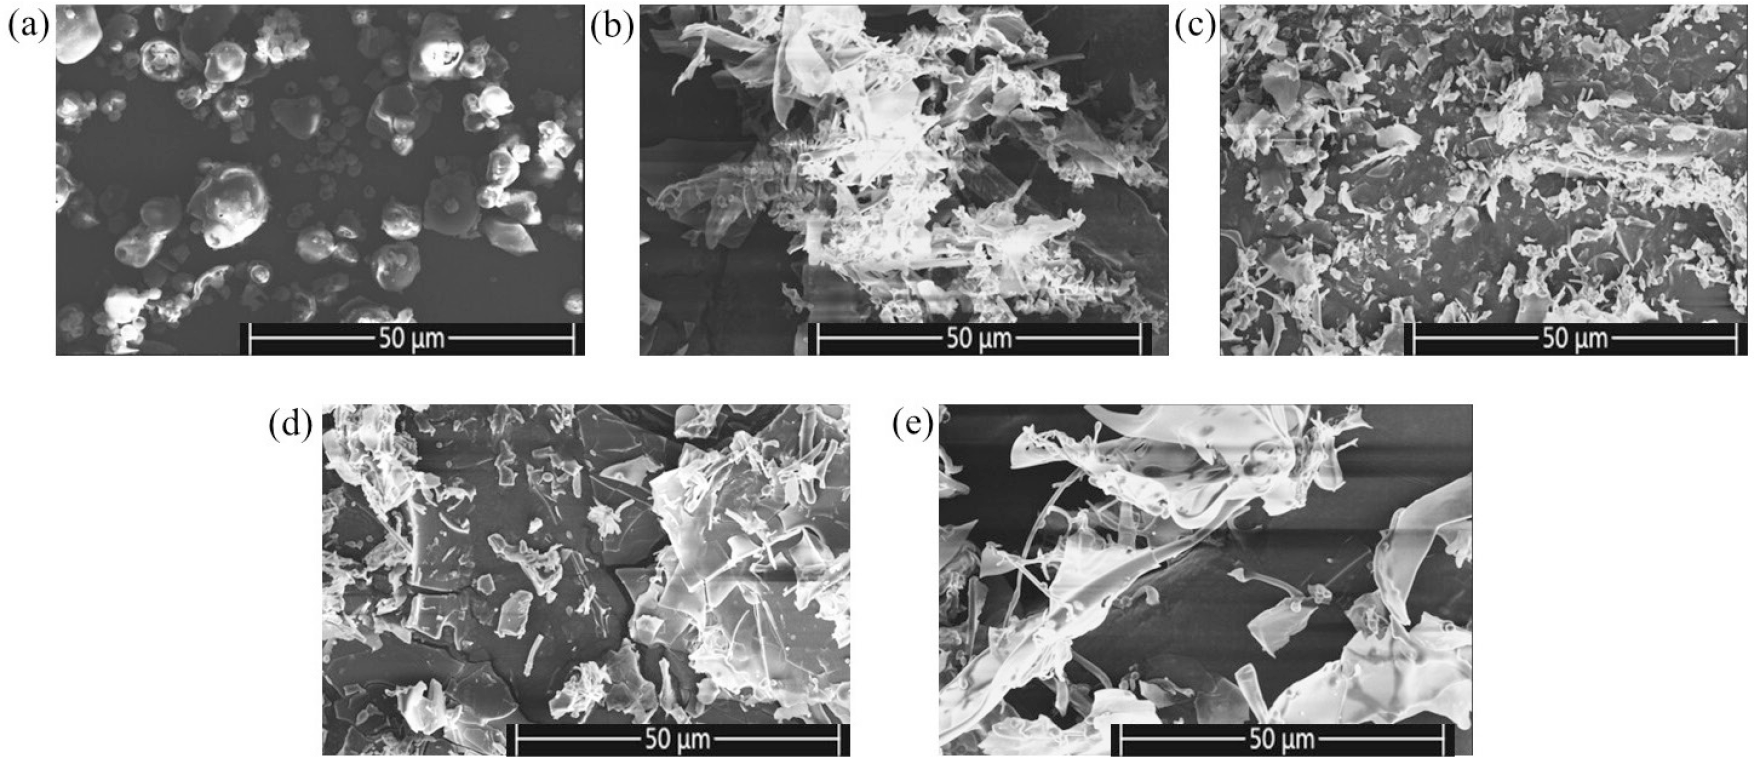
The formation of AGEs is known to induce protein aggregation, as the MR promotes protein unfolding and cross-linking, leading to the formation of high-molecular-weight aggregates.43 To investigate the morphological changes associated with this process, the samples were analyzed by SEM at a magnification of 2000×. As presented in Figure 5, native BLG exhibited a spherical morphology with a smooth surface. In contrast, glycated BLG formed visible aggregates, which can be attributed to the structural modifications caused by the MR.43 Furthermore, the addition of CUR, DMC, and THC significantly disrupted the aggregation of glycated BLG, as evidenced by the dispersed morphology observed in the SEM images. The degree of dispersion followed the order CUR > DMC > THC, suggesting that these compounds effectively inhibit Lac induced BLG aggregation. This trend aligns with the results obtained from the fluorescence assay, further supporting the inhibitory potential of CUR and its analogs. As previously reported, the inhibitory effects of natural polyphenols such as chlorogenic acid and proanthocyanidins on protein aggregation induced by glycation have also been confirmed through SEM analysis.25,38
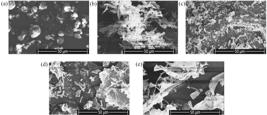
SEM images of BLG (a), AGEs (b), BLG + Lac + CUR (c), BLG + Lac + DMC (d), and BLG + Lac + THC (e), all images were captured at 2000× magnification.
SDS-PAGE analysis
SDS-PAGE was employed to evaluate the effects of glycation and CUR/DMC/THC treatment on the molecular weight of BLG. As depicted in Figure S2 (SI section), native BLG exhibited characteristic bands near 17 and 34 kDa corresponding to its monomer and dimer, respectively, consistent with the findings reported by Ma et al.23 In contrast, the glycation-induced AGEs exhibited slightly upward-migrated bands with moderately reduced staining intensity. This observation suggests that glycation induced the formation of high-molecular-weight aggregates, which were retained at the stacking gel interface due to their large size, resulting in lighter bands.39
Notably, the presence of CUR, DMC, or THC partially restored the diminished band intensity, although no significant differences were observed among the three compounds. This suggested that all three curcuminoids can inhibit aggregation of BLG induced by glycation, thereby suppressing AGEs formation. These findings align with our SEM observations and are supported by similar reports from Wei et al.,39 who observed attenuated HSA band intensity following MGO induction, with recovery occurring after the addition of phloretin and phlorizin.
Analysis of glycation sites occupation
Fluorescence spectroscopic analysis
Fluorescence quenching analysis
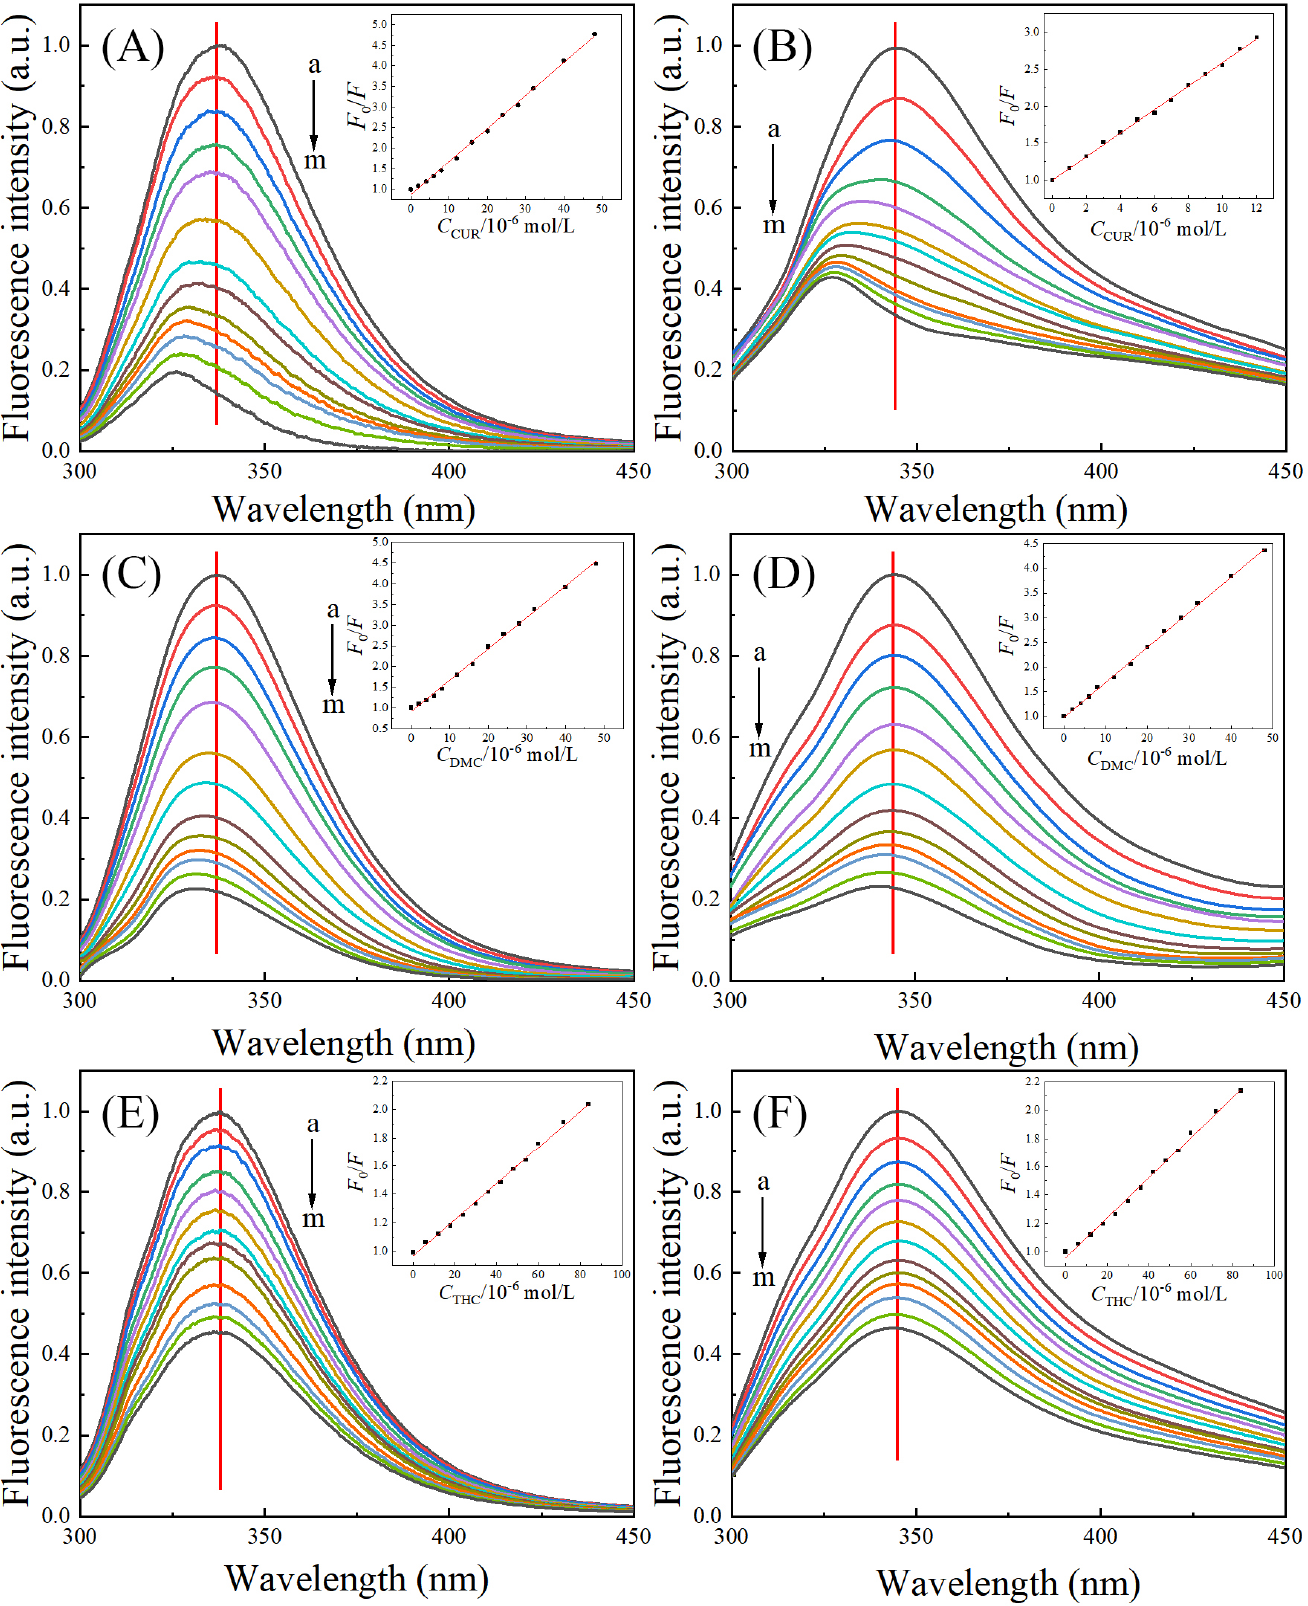
The occupation of protein glycation sites is one of the primary mechanisms by which polyphenols inhibit glycation. To investigate this mechanism, the binding of CUR, DMC, and THC to BLG/AGEs was examined using fluorescence spectroscopy, a widely employed technique for studying ligand-biomacromolecule interactions. Figure 6 shows the concentration-dependent effects of CUR, DMC, and THC on the fluorescence spectra of BLG and AGEs at 25 °C. At an excitation wavelength of 280 nm, BLG exhibited maximum fluorescence emission at 337 nm, which shifted to 344 nm for AGEs, indicating glycation-induced structural modifications in BLG. Significant blue shifts were observed upon binding of CUR and DMC to BLG (10 and 6.2 nm, respectively) and AGEs (16.6 and 2.4 nm, respectively), while THC induced only minimal displacement (1 nm for BLG and 0.8 nm for AGEs). This observation aligns with previous reports that CUR binding caused a blue shift of the maximum emission wavelength of BLG.19 The pronounced blue shifts induced by CUR and DMC suggest that their binding placed the fluorescent chromophores of both BLG and AGEs in a more hydrophobic microenvironment. Structural differences among curcuminoids lead to varying effects on the fluorescent microenvironment of BLG.
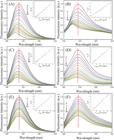
Fluorescence spectra of BLG (A, C, E) and AGEs (B, D, F) in the absence and presence of CUR (A, B), DMC (C, D), and THC (E, F) at 25 °C (n = 3, p < 0.05).
Binding driving force analysis
To elucidate the interactions between CUR/DMC/THC and BLG/AGEs via fluorescence spectroscopy in relation to their glycation inhibition, quenching mechanism analysis was first performed. The quenching rate constant (kq) was calculated using the following formula:44
where F0 and F represent the background-corrected and inner filter effect-compensated fluorescence intensities of BLG/AGEs and BLG/AGEs + CUR/DMC/THC, respectively; [Q]0 denotes the ligand concentration; and τ0 represents the fluorescence lifetime of BLG/AGEs.
The kq values (Table 2), derived from linear Stern-Volmer plots (Figure 6 insets) showed an inverse temperature dependence and exceeded the limiting diffusion rate constant (2 × 10¹⁰ L mol-1 s-1), indicating the static quenching of CUR, DMC, or THC to BLG/AGEs.33 To further elucidate the quenching mechanism, the fluorescence lifetimes of BLG and AGEs were measured in the presence and absence of CUR, DMC, or THC (Figure S3, SI section). As shown in Table 3, the fluorescence lifetime of BLG was 4.13 ns, consistent with previously reported values.45 The addition of CUR, DMC, or THC did not significantly affect the fluorescence lifetimes of BLG and AGEs, further indicating a static quenching process.
For static quenching, the binding constant (Ka) and the number of binding sites (n) were calculated using the following equation:46
where [Q] represents the free concentration of CUR/DMC/THC. For all three curcuminoids, the n value was close to 1 (Table 2), indicating that they had a single binding site on both BLG and AGEs. At the same temperature, the binding strength to BLG decreased in the order of CUR > DMC > THC, consistent with their glycation inhibitory efficacy. This indicates that binding strength may be a critical determinant of the inhibitory effect. Moreover, this also corroborates the CD and DLS findings. The strongest binding affinity of CUR may be attributed to the electron-donating methoxy substituent on its benzene ring, leading to an enhanced ESP. As shown in Figure S4 (SI section), CUR exhibits a more negative ESP than DMC, particularly around the phenolic and carbonyl oxygen atoms. This enhanced negativity indicates that CUR can form stronger hydrogen bonds with the positively charged regions of BLG, thereby strengthening their interaction. In contrast, THC possesses the most negative ESP but exhibits the weakest binding affinity. This may be because the hydrogenation of its conjugated double bonds disrupts the molecular planarity, thereby weakening its interaction with BLG.47 This structure-affinity relationship aligns with the stronger binding of caffeic acid to HSA than dihydrocaffeic acid.37 Additionally, within the temperature range of 25 to 37 °C, the inverse correlation between temperature and Ka suggests an exothermic binding process, where elevated temperatures destabilize the complexes. Sneharani et al.20 also reported similar temperature-dependent Ka reduction for the BLG-CUR system. Most importantly, all three curcuminoids exhibited significantly diminished binding affinities for AGEs compared to native BLG, demonstrating that glycation impaired their binding capacity. These findings suggest a potential competitive inhibition mechanism whereby curcuminoids appear to protect BLG from glycation by preferentially occupying glycation sites that would otherwise undergo Lac-induced glycation. It is worth noting that direct evidence for the occupancy of glycation sites still requires confirmation through techniques such as liquid chromatography-tandem mass spectrometry (LC-MS/MS).
The primary driving forces governing the binding process can be characterized by the changes in enthalpy (ΔH°), entropy (ΔS°), and Gibbs free energy (ΔG°) calculated by equation 5:37
As shown in Table 2, the negative ΔG° values confirmed the spontaneous binding of CUR, DMC, or THC to BLG. The negative ΔH° values suggest that the negative contributions of van der Waals forces and hydrogen bonds to ΔH° outweighed the positive contribution of hydrophobic interactions.35 This enthalpy-driven binding was particularly pronounced for CUR, showing the most negative ΔH° value among the three compounds. The positive ΔS° values indicate that the entropic gain from water molecule release during binding exceeded the entropic penalty from complex formation.48 The smallest ΔS° value of the BLG + CUR system indicates that the strongest binding between them imposed the greatest conformational constraints on the protein complex.
Molecular docking and MD simulation
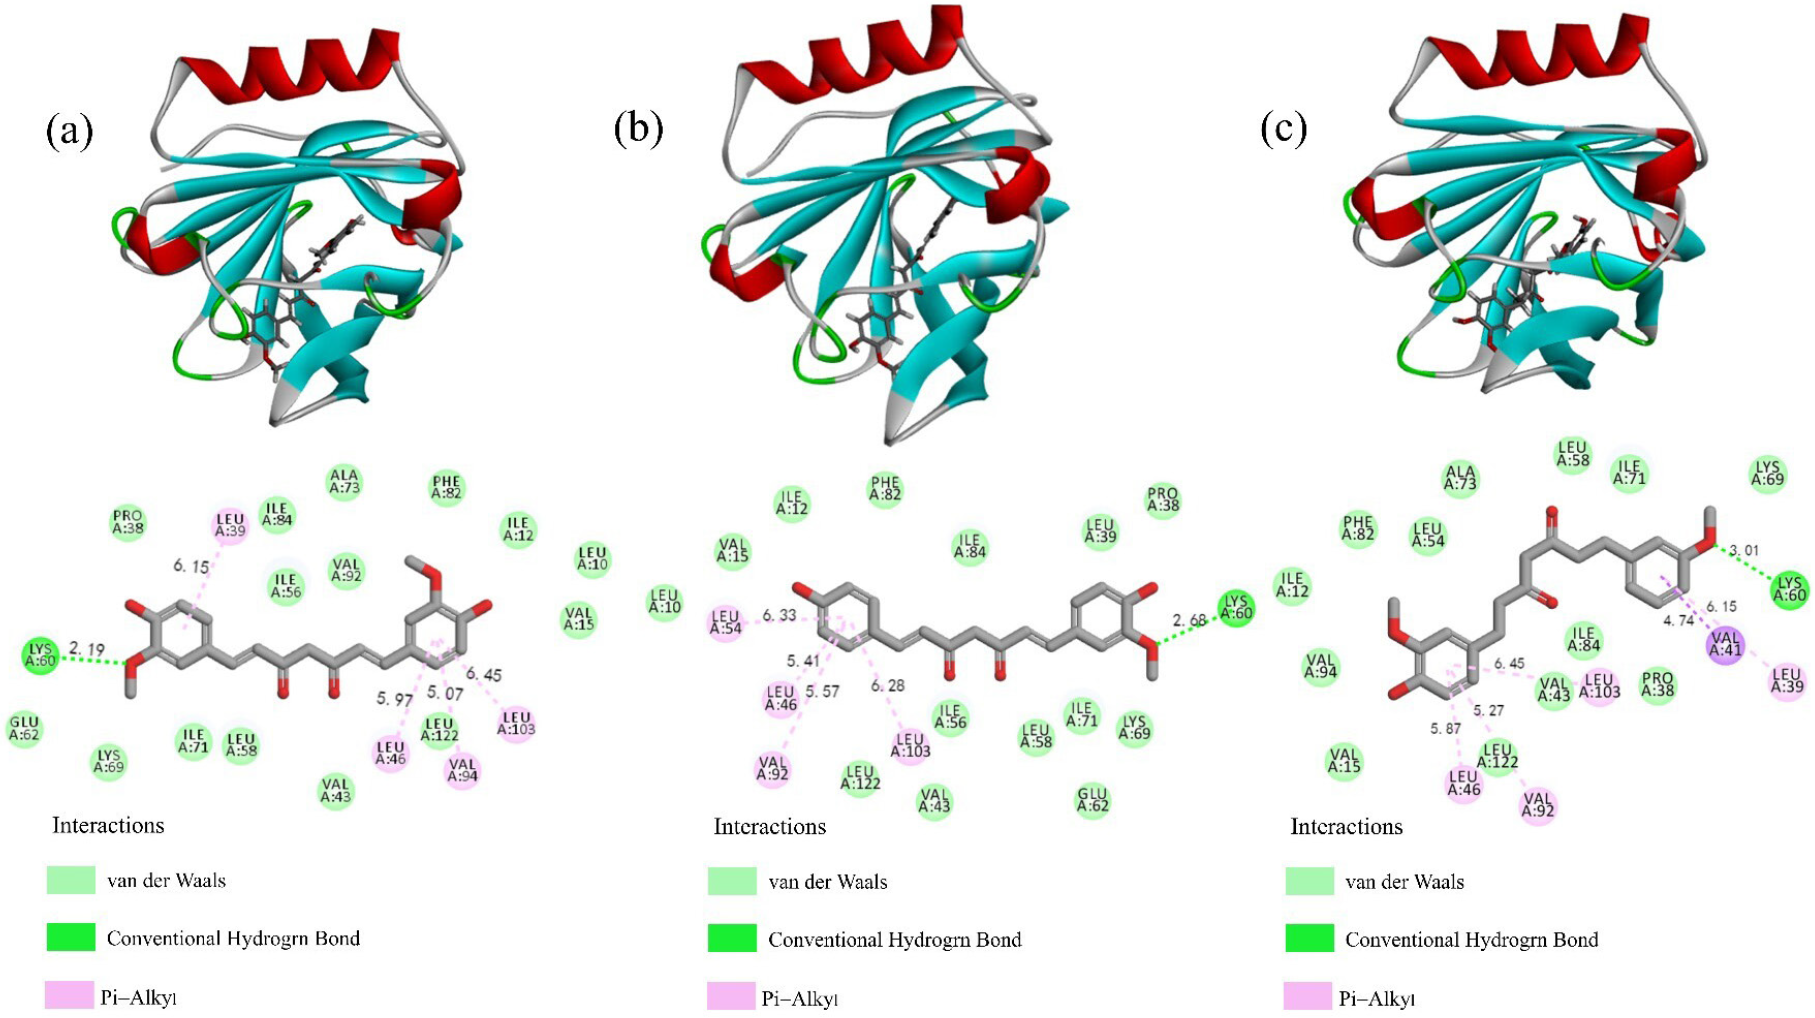
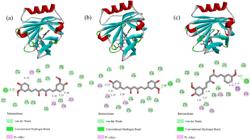
Molecular docking provided structural insights into the binding information of CUR, DMC, and THC to BLG (Figure 7). The three curcuminoids were bound within the central cavity of BLG, surrounded by similar amino acid residues. The binding energies of CUR, DMC, and THC were -36.17, -34.93, and -28.78 kJ mol-1, respectively. The binding affinity followed the order CUR > DMC > THC, in agreement with the fluorescence quenching results. Van der Waals forces, hydrophobic interactions, and hydrogen bonds played significant roles in the binding process of the three curcuminoids to BLG. CUR, DMC, and THC formed hydrogen bonds with Lys60 at distances of 2.19, 2.68, and 3.01 Å, respectively, while also interacting with Lys69 through van der Waals forces. Previous studies19,20 also observed the binding of CUR to Lys60 and Lys69 residues of BLG. The preferential binding to these residues is particularly significant as both Lys60 and Lys69 represent established glycation sites in BLG,9 suggesting a competitive inhibition mechanism where curcuminoids may protect BLG by sterically blocking reactive Lys. This enhances the possibility that these three polyphenols inhibit BLG glycation by competitively occupying glycation sites.
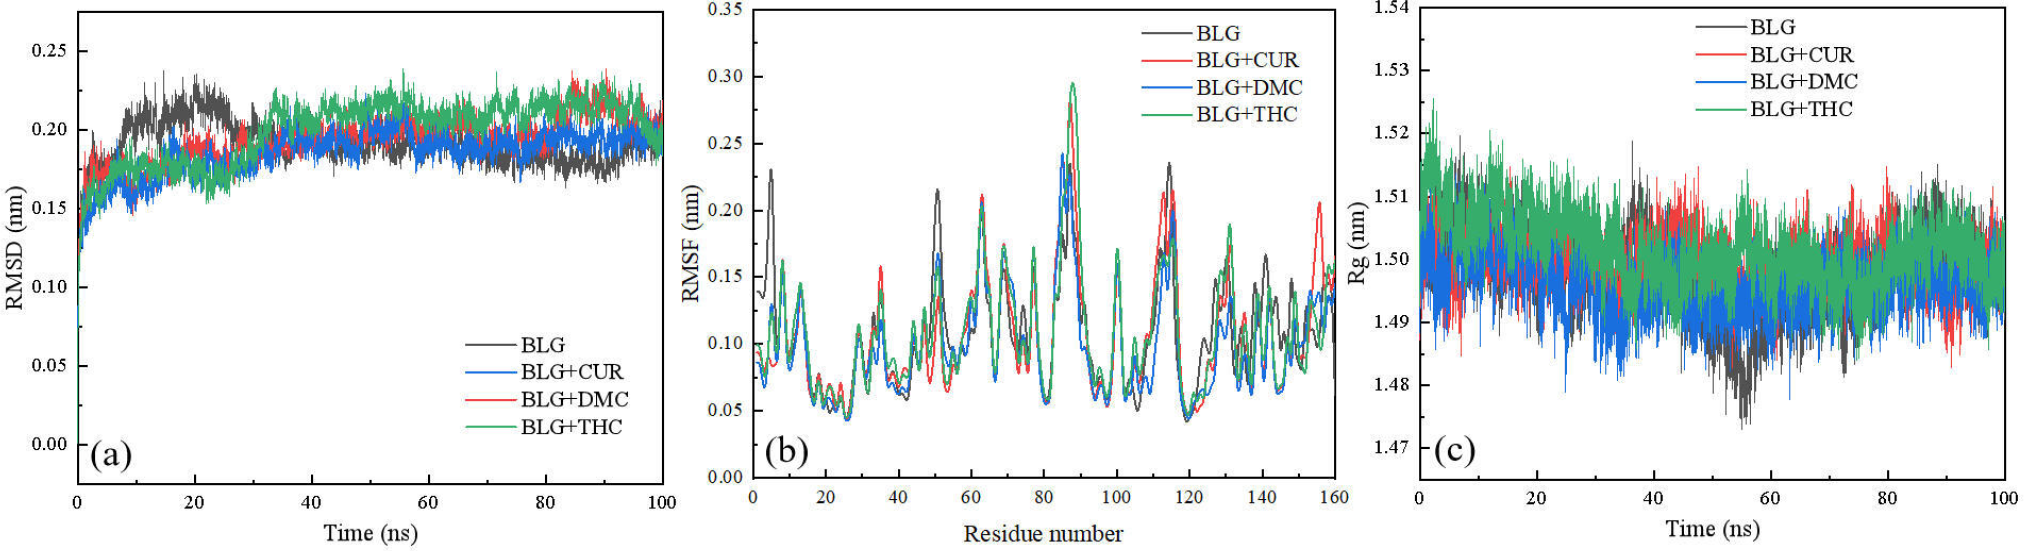
MD simulations were employed to analyze the structural stability of BLG and its complexes with CUR, DMC, and THC. Root mean square deviation (RMSD) indicates changes in protein conformation during simulation and serves as a key metric for assessing structural stability.49 As shown in Figure 8a, the RMSD values of BLG in its free and ligand-bound states stabilized after 20 ns and fluctuated around 0.2 nm, suggesting that BLG formed stable complexes with CUR, DMC, and THC.
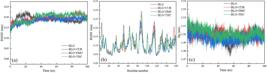
Root mean square fluctuation (RMSF) was used to assess the degree of fluctuation of amino acid residues in BLG during the simulation process.49 As illustrated in Figure 8b the RMSF profiles of BLG in the presence and absence of CUR, DMC, and THC are highly similar. This indicates that the amino acid residues near the binding sites exhibit minimal fluctuation upon ligand binding, further supporting the formation of stable complexes.
Radius of gyration (Rg) reflects the stability and overall compactness of BLG during the simulation process.38 As shown in Figure 8c, all systems exhibited minimal variation in Rg values, indicating that the complexes formed by the binding of these three curcuminoids to BLG remain compact and stable.
Antioxidant activity analysis
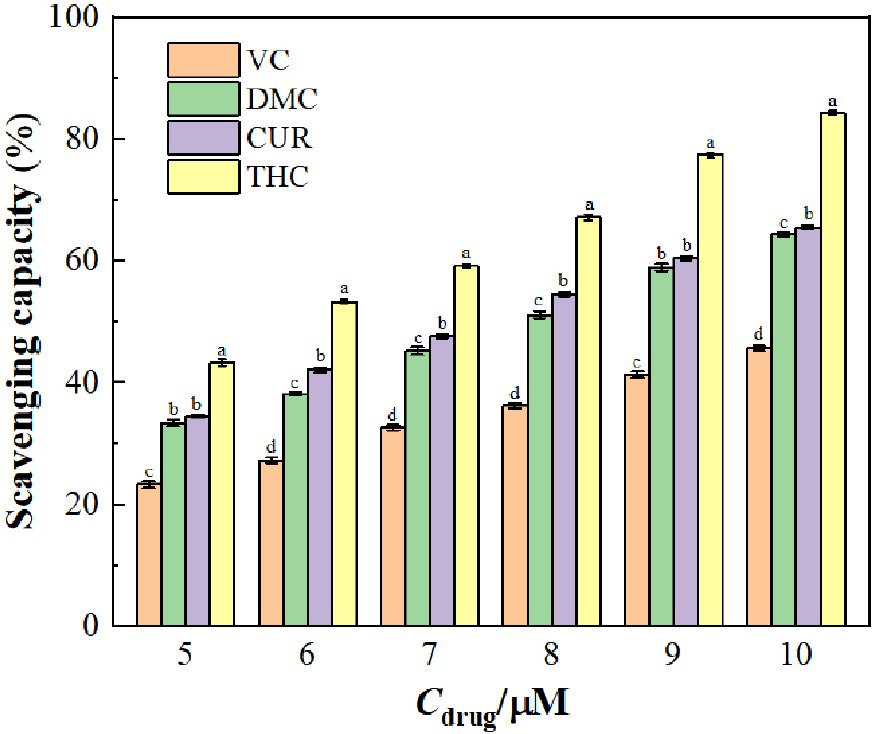
Oxidative stress plays a pivotal role in AGEs formation. As shown in Figure 9, CUR, DMC, and THC can effectively scavenge free radicals, exhibiting concentration-dependent free radical scavenging capacity. The antioxidant potency followed the order of THC > CUR > DMC > VC, with IC50 values of 5.51 ± 0.04, 7.17 ± 0.02, 7.52 ± 0.05, and 10.84 ± 0.05 μmol L-1, respectively. The strong free radical scavenging ability of these three curcuminoids has been previously reported,50,51 confirming their potential for antioxidant applications. The strongest antioxidant capacity of THC may be attributed to its flexible molecular structure.52 As for the slightly superior antioxidant activity of CUR compared to DMC, this may stem from the electron-donating effect of the methoxy group, which increased the electron density of the phenolic hydroxyl groups, thereby facilitating their reaction with free radicals.53
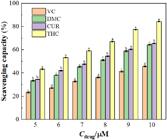
Notably, THC exhibited the strongest antioxidant activity but the weakest AGEs inhibition capability. This phenomenon may be connected to the three-stage process of AGEs formation, with different polyphenols possibly having unique effects at each stage. Intagliata et al.54 similarly observed that resveratrol, despite its stronger antioxidant activity, exhibited weaker AGEs inhibition compared to its derivatives with lower antioxidant capacity. Therefore, compared to free radical scavenging, the occupation of glycation sites by these three curcuminoids likely represents a more dominant mechanism for AGEs inhibition.
Intracellular ROS generation analysis
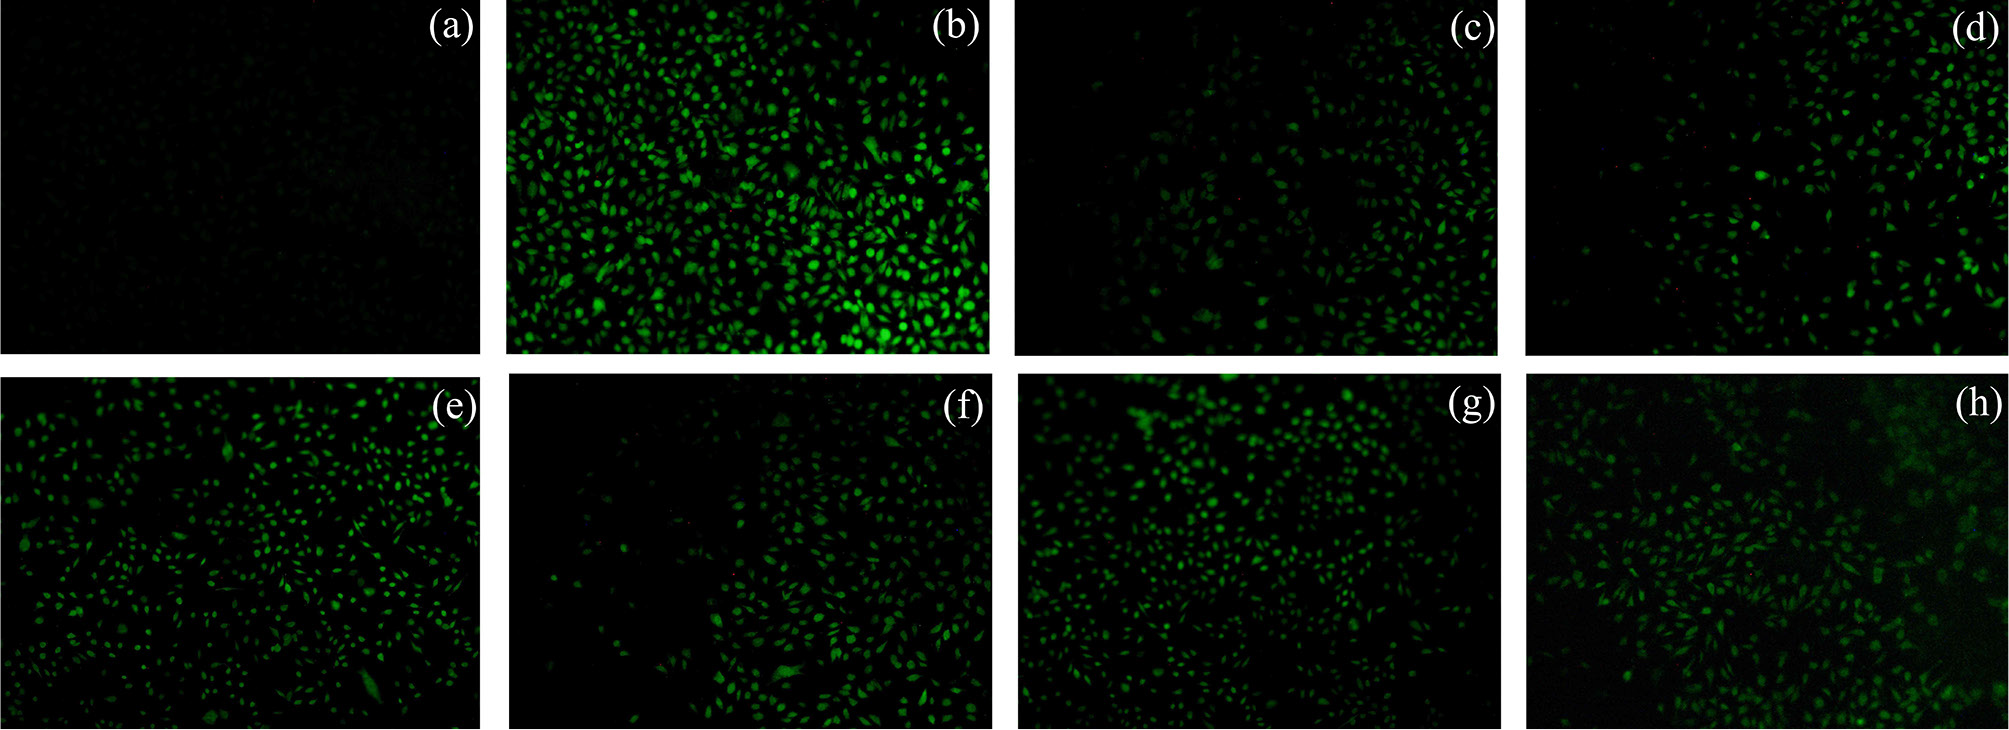
Oxidative stress plays a pivotal role in DVC, and the accumulation of AGEs facilitates ROS generation.4 Therefore, it is necessary to investigate the scavenging effects of CUR, DMC, and THC on AGEs-induced ROS. As shown in Figure 10, AGEs-treated cells exhibited significantly increased fluorescence intensity, confirming AGEs-induced ROS production. This effect was significantly attenuated when cells were treated with BLG + Lac + CUR/DMC/THC, indicating that inhibiting AGEs formation can reduce intracellular ROS generation. Furthermore, the fluorescence intensity was also reduced by simultaneous treatment with curcuminoids and AGEs, suggesting that curcuminoids can directly scavenge ROS. Previous studies4,55 have also found that caffeic acid and ferulic acid can inhibit AGEs-induced ROS generation in human umbilical vein endothelial cells.
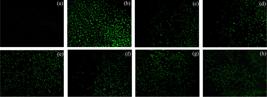
Fluorescence microscopy image of ROS generation in EA. hy926. Control (a); EA. hy926 were treated with AGEs (b), BLG + Lac + CUR (c), BLG + Lac + DMC (d), BLG + Lac + THC (e), AGEs + CUR (f), AGEs + DMC (g), and AGEs + THC (h) for 12 h.
Fluorescence intensity was further quantified using ImageJ software to compare the efficacy of the three polyphenols in suppressing AGEs-induced ROS production. As shown in Figure S5 (SI section), AGEs increased cellular fluorescence intensity 3.71-fold versus controls, while pretreatment with curcuminoids reduced fluorescence in the order CUR > DMC > THC, mirroring their AGEs inhibition efficacy. However, the capacity of these three curcuminoids to suppress AGEs-induced ROS generation followed the order THC > CUR > DMC, consistent with their antioxidant potency. These findings collectively demonstrate that curcuminoids exert dual protective effects: through both indirect reduction of ROS via AGEs formation inhibition and direct scavenging of AGEs-induced ROS, thereby mitigating DVC.
Conclusions
In summary, the inhibitory effects and mechanisms of CUR, DMC, and THC on Lac-induced glycation of BLG were examined using multispectral analysis, molecular docking, and MD simulation. The established glycation model demonstrated complete formation of AGEs after 24 h at 343.2 K. The three curcuminoids effectively inhibited AGEs formation, with their inhibitory capacities following the order CUR > DMC > THC. This trend correlated with their different binding affinities to BLG, where CUR exhibited the strongest binding while THC showed the weakest. Quantitative analysis of carbonyl, SH, and amino groups further confirmed AGEs formation and showed the inhibitory effects of all three curcuminoids. Additionally, they prevented the secondary structural changes and aggregation of BLG caused by glycation. Thermodynamic analysis revealed that the binding affinities to BLG followed the order CUR > DMC > THC, with hydrogen bonds and van der Waals forces serving as the primary driving forces. The consistent correlation between binding affinity and inhibitory efficacy demonstrated that the three curcuminoids may inhibit glycation by occupying the glycation sites of BLG. Molecular docking results revealed their binding within the internal cavity of BLG, involving key glycation residues (Lys60 and Lys69), further supporting the possibility that they inhibit glycation by occupying the sites. The results of MD simulation indicated that BLG forms stable complexes with CUR, DMC, or THC. The inconsistency between antioxidant capacity and anti-glycation activity suggested that free radical scavenging is not the primary anti-glycation mechanism. Furthermore, the intracellular ROS generation assay demonstrated that CUR, DMC, and THC exert dual protective effects by inhibiting AGEs formation and suppressing AGEs-induced ROS generation. This study provides new insights into the mechanisms by which CUR, DMC, and THC inhibit glycation and offers theoretical support for their potential as novel natural anti-glycation agents to prevent DVC. Furthermore, their inhibitory mechanisms can be fully elucidated using LC-MS/MS in the future.
Supplementary Information
Supplementary Information
Data Availability Statement
Data will be made available on request.
Acknowledgments
This work was supported by the National Natural Science Foundation of China (grant No. 22073039).
References
-
1 Prasad, C.; Davis, K. E.; Imrhan, V.; Juma, S.; Vijayagopal, P.; Am. J. Lifestyle Med 2017, 13, 384. [Crossref]
» Crossref -
2 Khalifa, I.; Xia, D.; Dutta, K.; Peng, J. M.; Jia, Y. Y.; Li, C.; Bioorg. Chem. 2020, 96, 103615. [Crossref]
» Crossref -
3 Yeh, W.-J.; Hsia, S.-M.; Lee, W.-H.; Wu, C.-H.; J. Food Drug Anal 2017, 25, 84. [Crossref]
» Crossref -
4 Cao, X. Y.; Ying, X.; Zeng, M.; Wang, W. Y.; He, Y.; Liu, J. L.; Chem. Biodiversity 2019, 16, e1900174. [Crossref]
» Crossref -
5 Chen, J. H.; Xu, L.; Bu, C. H.; Zhang, H. G.; Nutr. Metab. 2020, 15, 72. [Crossref]
» Crossref -
6 Arena, S.; Renzone, G.; Ambrosio, C. D.; Salzano, A. M.; Scaloni, A.; Food Chem 2017, 219, 477. [Crossref]
» Crossref -
7 Wang, X.-P.; Zhao, X.-H.; Foods 2021, 10, 2104. [Crossref]
» Crossref -
8 Mohammadi, F.; Sahihi, M.; Khalegh Bordbar, A.; Spectrochim. Acta, Part A 2015, 140, 274. [Crossref]
» Crossref -
9 Gasparini, A.; Buhler, S.; Faccini, A.; Sforza, S.; Tedeschi, T.; Molecules 2020, 25, 1294. [Crossref]
» Crossref -
10 Kong, Y. H.; Li, X. M.; Zheng, T. S.; Lv, L. S.; Food Chem 2015, 183, 36. [Crossref]
» Crossref -
11 Singh, I. R.; Yesylevskyy, S. O.; Mitra, S.; Biophys. Chem 2021, 277, 106651. [Crossref]
» Crossref -
12 Schalkwijk, C. G.; Miyata, T.; Amino Acids 2010, 42, 1193. [Crossref]
» Crossref -
13 Song, Q. H.; Liu, J. J.; Dong, L. Y.; Wang, X. L.; Zhang, X. D.; Biomed. Pharmacother. 2021, 140, 111750. [Crossref]
» Crossref -
14 Sarmah, S.; Goswami, A.; Belwal, V. K.; Roy, A. S.; Food Res. Int 2022, 157, 111358. [Crossref]
» Crossref -
15 Shahrajabian, M. H.; Sun, W. L.; Curr. Org. Synth 2023, 21, 665. [Crossref]
» Crossref -
16 Singh, L.; Sharma, S.; Xu, S. W.; Tewari, D.; Fang, J.; Molecules 2021, 26, 4036. [Crossref]
» Crossref -
17 Hatamipour, M.; Ramezani, M.; Tabassi, S. A. S.; Johnston, T. P.; Sahebkar, A.; J. Cell. Physiol 2019, 234, 19320. [Crossref]
» Crossref -
18 Zhu, L. J.; Xue, Y. T.; Feng, J. C.; Wang, Y. X.; Lu, Y. L.; Chen, X. L.; Food Biosci 2023, 53, 102591. [Crossref]
» Crossref -
19 Zhang, X. G.; Lu, Y. C.; Zhao, R.; Wang, C.; Wang, C. N.; Zhang, T. H.; Food Hydrocoll. 2022, 124, 107331. [Crossref]
» Crossref -
20 Sneharani, A. H.; Karakkat, J. V.; Singh, S. A.; Rao, A. G. A.; Food Chem 2010, 58, 11130. [Crossref]
» Crossref -
21 Li, M. M.; Liu, Z.; Zhang, Z. L.; Ma, L.; Front. Chem. China 2006, 2, 227. [Crossref]
» Crossref -
22 Yu, L.; Li, Y.; Yang, Y.; Guo, C.; Li, M.; Int. J. Food Sci. Technol. 2022, 57, 4646. [Crossref]
» Crossref -
23 Ma, T. X.; Zhang, L.; Xu, L.; Ye, Y. H.; Huang, T.; Zhou, Q. M.; Liu, H. L.; Int. J. Biol. Macromol 2019, 15, 1133. [Crossref]
» Crossref -
24 Al Jaseem, A.; Abdullah, K. M.; Qais, F. A.; Shamsi, A.; Naseem, I.; Int. J. Biol. Macromol 2021, 181, 426. [Crossref]
» Crossref -
25 Liu, L.; Dong, Q.; Kong, Y. M.; Kong, Y. R.; Yu, Z. Y.; Li, B.; Yan, H. X.; Chen, X.; Shen, Y. X.; Food Res. Int. 2023, 168, 112744. [Crossref]
» Crossref -
26 Raghav, A.; Ahmad, J.; Alam, K.; Khan, A.U.; Int. J. Biol. Macromol 2017, 101, 84. [Crossref]
» Crossref -
27 Wang, W. Q.; Yuan, P. P.; Zhou, J. Y.; Gu, Z. H.; J. Food Sci 2021, 86, 1228. [Crossref]
» Crossref -
28 Qi, X.; Yuan, L. X.; Wang, Q. L.; Zhang, Y. Q.; Jia, G. W.; Wu, Y. S.; Zhao, Y. N.; Zhang, Y. F.; Liu, M.; LWT-Food Sci. Technol. 2024, 195, 115855. [Crossref]
» Crossref - 29 Frisch, M. J.; Trucks, G. W.; Schlegel, H. B.; Scuseria, G. E.; Robb, M. A.; Cheeseman, J. R.; Scalmani, G.; Barone, V.; Petersson, G. A.; Nakatsuji, H.; Li, X.; Caricato, M.; Marenich, A. V.; Bloino, J.; Janesko, B. G.; Gomperts, R.; Mennucci, B.; Hratchian, H. P.; Ortiz, J. V.; Izmaylov, A. F.; Sonnenberg, J. L.; Williams-Young, D.; Ding, F.; Lipparini, F.; Egidi, F.; Goings, J.; Peng, B.; Petrone, A.; Henderson, T.; Ranasinghe, D.; Zakrzewski, V. G.; Gao, J.; Rega, N.; Zheng, G.; Liang, W.; Hada, M.; Ehara, M.; Toyota, K.; Fukuda, R.; Hasegawa, J.; Ishida, M.; Nakajima, T.; Honda, Y.; Kitao, O.; Nakai, H.; Vreven, T.; Throssell, K.; Montgomery Jr., J. A.; Peralta, J. E.; Ogliaro, F.; Bearpark, M. J.; Heyd, J. J.; Brothers, E. N.; Kudin, K. N.; Staroverov, V. N.; Keith, T. A.; Kobayashi, R.; Normand, J.; Raghavachari, K.; Rendell, A. P.; Burant, J. C.; Iyengar, S. S.; Tomasi, J.; Cossi, M.; Millam, J. M.; Klene, M.; Adamo, C.; Cammi, R.; Ochterski, J. W.; Martin, R. L.; Morokuma, K.; Farkas, O.; Foresman, J. B.; Fox, D. J.; Gaussian 09W, Gaussian, Inc., Wallingford CT, 2016.
-
30 Protein data Bank. [Link] accessed in November 2025
» Link -
31 Automated Topology Builder (ATB) and Repository Version 3.0. [Link] accessed in November 2025
» Link -
32 Abraham, M. J.; Murtola, T.; Schulz, R.; Páll, S.; Smith, J. C.; Hess, B.; Lindahl, E.; SoftwareX 2015, 1, 19. [Crossref]
» Crossref -
33 Ren, Y. F.; Liu, H.; Wang, D. F.; Liu, T. T.; Zhang, R. Y.; Wu, Y. S.; Zhang, Y. F.; Han, J.; Liu, M.; Food Chem 2022, 371, 131385. [Crossref]
» Crossref -
34 Ahmed, N.; Argirov, O. K.; Minhas, H. S.; Cordeiro, C. A. A.; Thornalley, P. J.; Biochem. J. 2002, 364, 1. [Crossref]
» Crossref -
35 Banerjee, S.; J. Fluoresc. 2017, 27, 1213. [Crossref]
» Crossref -
36 Villa, M.; Parravano, M.; Micheli, A.; Gaddini, L.; Matteucci, A.; Mallozzi, C.; Facchiano, F.; Malchiodi-Albedi, F.; Pricci, F.; Metabolism 2017, 71, 64. [Crossref]
» Crossref -
37 Zhang, Y. Q.; Yuan, L. X.; Wang, Q. L.; Zhang, X. J.; Yang, Y. Y.; Liu, M.; J. Mol. Liq. 2024, 415, 126322. [Crossref]
» Crossref -
38 Siddiqui, S.; Riaz, S.; Ahmad, R.; Wani, M. J.; Hashmi, M. A.; Syeda, F. F. Z.; Mateen, S.; Moin, S.; Int. J. Biol. Macromol. 2023, 245, 125497. [Crossref]
» Crossref -
39 Wei, Y. S.; Wu, J. M.; Peng, X.; Hu, X.; Gong, D. M.; Zhang, G. W.; Food Biosci. 2024, 61, 104971. [Crossref]
» Crossref -
40 Song, G. S.; Zhou, L. K.; Zhao, L. W.; Wang, D. L.; Yuan, T. L.; Li, L.; Gong, J. Y.; Int. J. Biol. Macromol. 2024, 256, 128529. [Crossref]
» Crossref -
41 Ding, H. F.; Ni, M. T.; Zhang, G. W.; Liao, Y. J.; Hu, X.; Zhang, Y.; Gong, D. M.; LWT-Food Sci. Technol. 2020, 125, 109253. [Crossref]
» Crossref -
42 Ma, S.; Yang, X.; Zhao, C. H.; Guo, M. R.; Food Sci. Nutr. 2018, 6, 1053. [Crossref]
» Crossref -
43 Chikkanayakanahalli, M. D.; Basha, S.; D’Souza, M. G.; Chandra, S.; Ameera, K.; Stanley, W.; Mazumder, N.; Mahato, K. K.; Analyst 2024, 149, 4029. [Crossref]
» Crossref -
44 Chaves, O. A.; Ferreira, R. C.; da Silva, L. S.; de Souza, B. C. E.; Cesarín-Sobrinho, D.; Netto-Ferreira, J. C.; Sant’Anna, C. M. R.; Ferreira, A. B. B.; J. Braz. Chem. Soc. 2018, 29, 1551. [Crossref]
» Crossref -
45 Tabasi, M.; Maghami, P.; Amiri-Tehranizadeh, Z.; Saberi, M. R.; Chamani, J.; J. Mol. Liq. 2023, 392, 123472. [Crossref]
» Crossref -
46 Chaves, O. A.; Fernandes, T. V. A.; de Melos, J. L. R.; Netto Ferreira, J. C.; Echevarria, A.; J. Mol. Liq. 2020, 310, 113117. [Crossref]
» Crossref -
47 Zhong, Y. J.; Yang, L.; Dai, T. T.; Zhu, Z. Y.; Chen, H.Y.; Wu, J. Y.; Gong, E. S.; Food Chem. 2022, 387, 132892. [Crossref]
» Crossref -
48 Yuan, L. X.; Liu, T. T.; Qi, X.; Zhang, Y. Q.; Wang, Q. L.; Liu, M.; Spectrochim. Acta, Part A 2024, 313, 124090. [Crossref]
» Crossref -
49 Ren, Y. F.; Zhu, Y. H.; Qi, X.; Yan, H.; Zhao, Y. N.; Wu, Y. S.; Zhang, N.; Ding, Z.; Yuan, L. X.; Liu, M.; LWT-Food Sci. Technol. 2023, 175, 114493. [Crossref]
» Crossref -
50 Jayaprakasha, G. K.; Jaganmohan Rao, L.; Sakariah, K. K.; Food Chem. 2006, 98, 720. [Crossref]
» Crossref -
51 Qiu, Y. Q.; Wang, Y. M.; Lu, J. H.; Zhu, Q. H.; Jia, L.; Lei, F. H.; Shen, L. Q.; Jiang, L. H.; Wu, A. Q.; J. Biomol. Struct. Dyn 2024, 42, 13447. [Crossref]
» Crossref -
52 Silva, F. A. M.; Borges, F.; Guimarães, C.; Lima, J. L. F. C.; Matos, C.; Reis, S.; J. Agric. Food Chem 2000, 48, 2122. [Crossref]
» Crossref -
53 Rege, S.; Momin, S.; Wadekar, S.; Pratap, A.; Bhowmick, D.; J. Food Process. Preserv. 2012, 38, 296. [Crossref]
» Crossref -
54 Intagliata, S.; Spadaro, A.; Lorenti, M.; Panico, A.; Siciliano, E.A.; Barbagallo, S.; Antioxidants 2020, 10, 12. [Crossref]
» Crossref -
55 Liu, J. L.; He, Y. L.; Wang, S.; He, Y.; Wang, W. Y.; Li, Q. J.; Cao, X. Y.; J. Funct. Foods 2018, 48, 19. [Crossref]
» Crossref