Monitoring N-Nitrosamines in Cosmetic Thermal Waters: Analytical Method Development, Validation, and Market Analysis in Brazil
Abstract
The cosmetics industry is expanding, with growing demand for natural and green products, including “cosmetic thermal water”. Brazil, the fourth largest cosmetic market of the world, has seen increased availability of these products, which may contain ingredients such as natural extracts, moisturizers, and preservatives, which can be potential sources of contamination with carcinogenic N-nitrosamines. This study aimed to map cosmetic thermal waters in Brazil, assess their composition and risk of N-nitrosamines formation, and develop and validate an analytical method for detecting N-nitrosamines in these products. A bidimensional liquid chromatography coupled with tandem mass spectrometry method was developed and validated for the precise quantification of N-nitrosodiethanolamine, N-nitrosodimethylamine, N-nitrosomorpholine, and N-nitrosodiethylamine in cosmetic thermal waters. The method was effective for most of the commercial samples analyzed. For accurate detection in the case of samples with more complex matrices, an offline solid phase extraction preparation method was also developed, ensuring reliable quantification for a variety of formulations. No detectable levels of the four N-nitrosamines were found in the 12 samples evaluated. The findings demonstrated the effectiveness of the method for monitoring contamination with N-nitrosamines in cosmetic thermal waters and indicated the need for ongoing surveillance and detailed analysis of formulations to ensure product safety.
Keywords:
N-nitrosamines; bidimensional chromatography; cosmetic thermal water
Introduction
Cosmetic products play an integral role in daily life, with the cosmetics industry being one of the fastest-growing sectors in the last decade, showing an annual growth rate of approximately 7%.1 A 2022 study revealed that 71% of consumers from ten European countries considered cosmetics and personal care products to be important or very important in improving their quality of life, with the average consumer using over seven different cosmetics daily and nearly thirteen different cosmetics weekly.2 In parallel with the general growth of the cosmetics market, there has been increased interest in natural or green cosmetics that contain ingredients from natural and organic sources, avoiding synthetic chemicals in the formulations. This shift has been driven by heightened awareness of the risks associated with many of the synthetic chemicals found in cosmetics, as well as the health benefits of products derived from plants and other natural sources, which have been amplified by social media and the internet. As a result, the cosmetics industry is now prioritizing natural products, a focus that has intensified following the coronavirus (COVID-19) pandemic.1,3 The increasing demand for these products has motivated global cosmetics companies to develop more cosmetic and personal care products that incorporate natural ingredients, together with the introduction of natural product lines.4
Brazil is the fourth largest cosmetics market globally, with a value of US$ 26.9 billion, and ranks second in the annual launching of new products, behind only the USA.5 This suggests a consumer market keen on following innovations and trends. Brazil has accompanied the increasing interest in green cosmetics, with a 2017 survey indicating that around 53% of respondents were interested in natural beauty products.6 Reflecting this trend, one rapidly growing area of cosmetics in Brazil is that of “thermal water” cosmetics.
It is important to differentiate this new type of cosmetic product marketed in Brazil, henceforth denoted “cosmetic thermal water”, from the long-established product with alleged therapeutic effects, known as “thermal spring water” or “eau thermal”. Thermal spring waters are sourced from springs and are classified as a type of mineral water characterized by three main attributes: spring origin, bacteriological purity, and potential therapeutic effects.7 Known since antiquity for their therapeutic benefits on the skin, there is substantial documentation in the literature supporting the efficacy of thermal spring waters in treating various skin conditions.7,8 In Brazil, thermal spring waters are marketed in propellant-based spray bottles, containing only the thermal water and the propellant gas as ingredients. In contrast, cosmetic thermal waters are water-based products that do not necessarily use mineral water. These products include additional ingredients such as natural extracts, moisturizers, emollients, preservatives, and sometimes fragrances, and they are claimed to provide benefits such as hydrating, refreshing, and soothing effects. However, the marketing of both types of products under the general name “thermal water” can lead to confusion among consumers.
A significant concern regarding toxicity in cosmetics is the potential presence of N-nitrosamines, a risk that has been recognized since 1977.9 These compounds, known for decades to have carcinogenic and mutagenic properties10,11 are formed by reactions between amines, particularly secondary amines, and nitrosating agents such as nitrous acid, nitrites, and nitrogen oxides.12 Consequently, key raw materials extensively used in cosmetics, including amides, amino acids, and other nitrogen-containing compounds, can potentially serve as precursors for nitrosation reactions during both production and storage of the product. In addition, the presence of N-nitrosamines in cosmetics can originate from contaminated raw materials.13 The N-nitrosamines that have been found in cosmetics include N-nitrosodiethanolamine, N-nitrosodimethylamine, N-nitrosomorpholine, and N-nitrosodiethylamine.11,14,15 In the present study, it was noted that cosmetic thermal waters contain substances that are potential precursors of N-nitrosamines.
In scientific literature, various methods for the determination of N-nitrosamines in cosmetics are available, employing both liquid chromatography15,16 and gas chromatography,17-19 depending on the volatility of the analytes. Mass spectrometry is commonly used due to its high sensitivity and selectivity in quantifying these compounds. Among the official methods, the protocol published in 2020 by the European Network of Official Cosmetics Control Laboratories20 stands out, describing a liquid chromatography-based methodology for the determination of polar N-nitrosamines in cosmetics and tattoo inks, at concentrations range between 10 and 1000 µg kg-1.
Therefore, the objectives of this study were to: (i) map the occurrence of cosmetic thermal waters marketed in Brazil and evaluate their compositions, considering the presence of possible precursors of N-nitrosamines; (ii) develop and validate an analytical method for detecting N-nitrosamines in these cosmetic products; and (iii) analyze samples of cosmetic thermal waters sold in Brazil.
Experimental
Cosmetic thermal water composition analysis
Cosmetic products containing the term “thermal water” in their names were identified using the search tool available on the website of the Brazilian Health Regulatory Agency (ANVISA).21 The search criteria included products registered and regulated under terms such as “thermal spring water”, “thermal water”, “eau thermal”, and “eau thermale”. The identified products were firstly sorted according to the year of their regulatory approval by ANVISA, followed by filtering to include only those intended for facial use. Subsequently, these products were categorized based on their classification in the ANVISA system (Grade 1 or Grade 2 facial products).22 Finally, the ingredient compositions of these products were compiled based on information provided by the manufacturers.
Chemicals and reagents
Analytical standards of N-nitrosodimethylamine (NDMA) (100%), N-nitrosomorpholine (NMOR) (100%), and N-nitrosodiethylamine (NDEA) (98.7%) were obtained as a mixed solution at a concentration of 2000 µg mL-1 (AccuStandard, Chem Service, USA). N Nitrosodiethanolamine (NDELA) (≥ 99%) was obtained from Sigma-Aldrich (USA). Isotopically labeled standards of N-nitrosodiethanolamine-d8, N-nitrosodimethylamine-d6, N-nitrosomorpholine-d4, and N-nitrosodiethylamine-d10 were purchased from Toronto Research Chemicals (Canada). Formic acid was acquired from Merck (Germany). Methanol and dichloromethane (high-performance liquid chromatography (HPLC) grade) were acquired from Honeywell (USA). SupelcleanTM Coconut Charcoal solid phase extraction (SPE) cartridges (2 g, 6 mL) were supplied by Sigma-Aldrich (Brazil). Ultrapure water used throughout the experiments was obtained from a Milli-Q purification system (Millipore, USA).
Stock, intermediate, and working standard solutions
A stock solution of NDELA (1000.0 µg mL-1) was prepared by dissolution of the standard in methanol. A stock solution of the NDELA-d8 internal standard was prepared at 100.0 µg mL-1 in methanol. An intermediate NDELA standard solution (10.0 µg mL-1) was prepared by dilution of the stock solution in methanol. A stock solution (10.0 µg mL-1) of the N-nitrosamines mixture containing NDMA, NMOR, and NDEA was prepared by dilution in methanol.
Working solutions of NDELA (200.0 ng mL-1) were prepared daily by dilution of the intermediate standard solution with water. Working solutions containing the NDELA-d8 internal standard (3.0 µg mL-1) were prepared by dilution of the stock solution with water. Working solutions of the N-nitrosamines mixture containing NDMA, NMOR, and NDEA (500.0 ng mL-1) were prepared daily by dilution of the intermediate standard solution with water. Working solutions of the N-nitrosamines mixture containing the NDMA-d6, NMOR-d4, and NDEA-d10 internal standards (1.5 µg mL-1) were prepared by dilution of the stock solution with water.
Bidimensional liquid chromatography-tandem mass spectrometry (LC-LC-MS/MS) instrumentation
The analyses were performed using an LC-LC-MS/MS system (Waters, USA) equipped with an autosampler (single injection capacity of 250 µL), binary solvent manager (BSM) and quaternary solvent manager (QSM) pumps, a column manager, and a triple quadrupole mass detector (Xevo TQD Zspray, Waters) with an atmospheric pressure chemical ionization (APCI) source operating in the positive mode. The probe temperature was 350 ºC, the desolvation gas (nitrogen) flow rate was 600 L h-1, the cone gas (nitrogen) flow rate was 60 L h-1, and the corona voltage was 3.5 kV. Argon was used as the collision-induced dissociation gas. The injection volume was 250 µL. Quantification was performed using the selective reaction monitoring (SRM) mode. The precursor ions, fragments, cone voltage, and collision energy are described in Figure 1. MassLynx v. 4.1 software was used for data acquisition and control of the equipment, with TargetLynx software for chromatogram data treatment.

Diagram of the LC-LC-MS/MS system. The red lines indicate the solvent delivered by the quaternary solvent manager (QSM) pump and the blue lines the solvent delivered by the binary solvent manager (BSM) pump. Valve position 1: sample loading step and valve position 2: transfer of the analytes from the 1D to the 2D column. MS/MS: mass spectrometer.
An Atlantis T3 C18 column (3.0 × 50 mm; 3 µm), maintained at ambient temperature, was employed in the first chromatographic dimension, while an Acquity UPLC HSST3 column (2.1 × 50 mm; 1.8 µm), kept at 40 ºC, was used in the second chromatographic dimension. Both columns were from Waters (Ireland). The samples were kept at 22 °C during the analysis. The flow rates of the solvents delivered from the BSM and QSM pumps were 0.45 and 0.87 mL min-1, respectively. Two valves controlled the system. In the first position (valve position 1), the sample was loaded using the QSM pump and was percolated through the LC column. In the second step, the valve position was switched (valve position 2) and the compounds retained on the LC column were eluted by the mobile phase supplied by the BSM pump (Figure 1). In this stage, the analytes were transferred to the analytical column for separation, before quantification by MS/MS. The diagram and operating conditions of the QSM and BSM pumps are shown in Figure 1 and Table 1, respectively. The MS parameters are provided in the Supplementary Information (SI) section (Table S1).
LC-LC optimization
For optimization of the 2D conditions, evaluation was made of the effects of different injection volumes (100, 150, 200, and 250 µL), loading solvents (water:methanol at 100:0, 97:3, 95:5, and 93:7 v/v), loading volumes (0.218, 0.261, 0.348, 0.435, and 0.609 mL), column regeneration time (time to return to valve position 1), and mobile phase composition and gradient. These analyses were performed (in duplicate) using a solution containing 25.0 ng mL-1 of NDELA, 60.0 ng mL-1 of NDELA-d8, 40.0 ng mL-1 of NDMA, NDEA, and NMOR, and 30.0 ng mL-1 of NDMA-d6, NMOR-d4, and NDEA-d10.
Sample preparation
Procedure A - direct injection
A 0.10 mL volume of the internal standards solution was added to 1.9 mL of the sample to obtain concentrations of 60.0 ng mL-1 for NDELA-d8 and 30.0 ng mL-1 for NDMA-d6, NDEA-d10, and NMOR-d4. The mixture was vortexed for 30 s, followed by filtering (0.22 µm pore size filter) and injection of 250 µL into the LC-LC-MS/MS system. Quantitation was carried out using the internal standard calibration.
Procedure B - solid phase extraction
A 0.40 mL volume of the internal standards solution was added to 20 mL of the sample to obtain concentrations of 60.0 ng mL-1 for NDELA-d8 and 30.0 ng mL-1 for NDMA-d6, NDEA-d10, and NMOR-d4. The sample was loaded onto a previously conditioned (2 × 3 mL of methanol and 2 × 3 mL of water) SupelcleanTM Coconut Charcoal SPE cartridge (2 g, 6 mL), using an SPE manifold. The eluate from the percolated sample was discarded. The cartridge was dried under vacuum, maintaining a nitrogen flow in the manifold for 30 min. The analytes and internal standards were eluted with 10 mL of dichloromethane:acetone (1:1 v/v). The eluate was transferred to a Falcon tube containing 50 µL of methanol. The solvent was evaporated for ca. 7 h in a vacuum concentrator at 450 mbar, 750 rpm, and 35 °C. The residue was reconstituted with 1 mL of water and filtered (0.22 µm pore size filter) directly into a 2 mL vial. A volume of 250 µL was injected into the LC LC-MS/MS system.
Method validation
Procedure A - direct injection
The method was validated considering the parameters linear range, linearity, intra-day and inter-day precisions, limit of quantification (LOQ), and accuracy. The target analytes were quantified using the corresponding isotopically labeled internal standards.
Each calibration solution was prepared in triplicate, using water samples fortified at five concentration levels: 5.0, 10.0, 15.0, 20.0, and 25.0 ng mL-1 for NDELA and 20.0, 25.0, 30.0, 35.0, and 40.0 ng mL-1 for NDMA, NDEA, and NMOR. The internal standards used were NDELA-d8 (60.0 ng mL-1), NDMA-d6, NDEA-d10, and NMOR-d4 (30.0 ng mL-1). The solutions were filtered (0.22 µm pore size filter) and volumes of 250 µL were injected directly into the LC-LC-MS/MS system. The linearity and equation of the regression line were determined by the linear least-squares regression method.
The precision of the method, in terms of repeatability, expressed as the relative standard deviation (RSD) of replicate analyses, and intra-day precision, expressed as the RSD of replicate analyses performed on the same day, were determined by analyzing fortified water samples containing the N-nitrosamines at three concentration levels: 5.0, 15.0, and 25.0 ng mL-1 for NDELA and 20.0, 30.0, and 40.0 ng mL-1 for NDMA, NDEA, and NMOR. The internal standards used were NDELA-d8 (60.0 ng mL-1), NDMA-d6, NDEA-d10, and NMOR-d4 (30.0 ng mL-1). Five replicates were analyzed at each concentration level. Inter-day precision was determined by analyzing the same fortified samples in quintuplicate on the first day and in quadruplicate on another day. The LOQs were estimated using a signal-to-noise ratio of 10:1. Satisfactory accuracy and precision were obtained for the determination of NDELA at 5.0 ng mL-1 and NDMA, NDEA, and NMOR at 20.0 ng mL-1.
Procedure B - solid phase extraction
The method was validated considering the parameters linear range, linearity, intra-day and inter-day precisions, LOQ, and accuracy. The target analytes were quantified using the corresponding isotopically labeled internal standards.
Each calibration solution was prepared in triplicate, using water samples fortified at five concentration levels: 0.1, 0.5, 1.0. 1.5 and 2.0 ng mL-1 for NDELA, NDMA, NDEA, and NMOR. The internal standards used were NDELA-d8, NDMA-d6, NDEA-d10, and NMOR-d4 (1.0 ng mL-1). For each concentration level, a volume of 100 mL was percolated through the charcoal cartridge. This procedure resulted in a concentration factor of 100 fold. The solutions were filtered (0.22 µm pore size filter) and volumes of 250 µL were injected directly into the LC LC MS/MS system. The linearity and equation of the regression line were obtained by the linear least-squares regression method.
The precision of the method, in terms of repeatability, expressed as RSD of replicate analyses, and intra-day precision, expressed as the RSD of replicate analyses performed on the same day, were determined by analyzing fortified water samples containing the N-nitrosamines at two concentration levels: 0.1 and 1.0 ng mL-1 for NDELA, NDMA, NDEA, and NMOR. The internal standards used were NDELA-d8, NDMA-d6, NDEA-d10, and NMOR-d4 (1.0 ng mL-1). Five replicates were analyzed for each concentration level. Inter-day precision was determined by analyzing the same fortified samples in quintuplicate on the first day and in quadruplicate on another day. The LOQ values were estimated using a signal-to-noise ratio of 10:1. Satisfactory accuracy and precision were obtained for the determination of NDELA at 1.0 ng mL-1 and NDMA, NDEA, and NMOR at 0.1 ng mL-1.
Cosmetic thermal water samples
Twelve commercially available cosmetic thermal water samples of nine different brands and labeled from A to L were purchased from Brazilian retail outlets during 2024. Samples A, B, C, G, J, K, and L were in aerosol spray format and samples D, E, F, H and I in pump spray format. The chemical compositions of the samples are provided in Table 2.
Results and Discussion
Cosmetic thermal water composition analysis
Firstly, a search was performed for products registered by the Brazilian Health Regulatory Agency (ANVISA) from 2014 to 2023, using the search terms described before. The data were organized according to the year of the regulatory process at ANVISA (Figure 2).

Thermal water products registered by the Brazilian Health Regulatory Agency (ANVISA) from 2014 to 2023.
A notable increase in the number of registered products occurred from 2014 to 2018, followed by a period of sustained high registration numbers in subsequent years. This trend suggested that these products had been well received by consumers and were in significant demand within the Brazilian market.
The identified products were then filtered to only include those intended for facial use, followed by analysis according to their classification in the ANVISA system (Grade 1 or Grade 2 facial products). ANVISA has two classifications for personal hygiene products, cosmetics, and perfumes: Grade 1, for products with basic or elementary properties that do not initially require proof of efficacy or detailed information regarding their usage and restrictions, due to the intrinsic characteristics of the product; and Grade 2, for products with specific indications that require proof of safety and/or efficacy, as well as information and precautions, usage instructions, and restrictions. Thermal spring waters are classified as Grade 2 products by ANVISA, while cosmetic thermal waters are classified as Grade 1 products.22
Thermal spring waters are a type of mineral water sourced from natural springs. Mineral water labels are subject to classification by legislation such as Decree No. 7,841/1945 in Brazil (Mineral Water Code),23 European Parliament Directive 2009/54/EC,24 and Food and Drug Administration (FDA) regulations.25 Mineral waters are distinguished by their three main characteristics, namely spring origin, bacteriological purity, and potential therapeutic effects. They are categorized based on their chemical composition, physical characteristics, salt concentration, temperature at the source, and other aspects such as their therapeutic effects (proven or not). The classification includes the temperature at the source, considering waters with temperatures below 20 °C as cold, between 20 and 30 °C as hypothermal, between 30 and 40 °C as thermal, and above 40 °C as hyperthermal.7 Since antiquity, thermal spring waters have been renowned for their therapeutic effects on the skin. Substantial documentation in the literature supports their efficacy in treating skin conditions, while ongoing studies continue to explore and elucidate their mechanisms.8,26 The thermal spring water products marketed in Brazil consist only of thermal spring water and a propellant.
On the other hand, cosmetic thermal waters have more complex formulations. Therefore, in the present study, the ingredient compositions of cosmetic thermal water products for facial use were obtained based on information provided by the manufacturers. A total of 187 different ingredients were found in the compositions of the 12 cosmetic thermal waters purchased for analysis, based on information provided on the packaging labels. The product samples contained water, emollient agents, flower and fruit extracts, minerals, preservatives, and propellant. One of the samples (H) contained 29 different ingredients. Samples I and L contained triethanolamine, a substance widely recognized as a precursor in the formation of N-nitrosamines. The ingredients labelled in the samples are listed in Table 2.
N-Nitrosamines, recognized as carcinogenic compounds since the 1970s, can penetrate human skin.27 Given the substantial health risks posed by these contaminants, N-nitrosamines are listed among substances prohibited in cosmetic products by various regulatory bodies worldwide, including in the European Union (Regulation EC 1223/2009).28 However, these contaminants may be present in certain cosmetic ingredients. N-Nitrosamines are formed in reactions between amines, particularly secondary amines, and nitrosating agents such as nitrous acid (HONO), nitrites, and nitrogen oxides. Consequently, key raw materials extensively used in cosmetics, including amides, amino acids, and other nitrogen-containing compounds, can serve as precursors for nitrosation reactions during both manufacture and storage of the product.13 In 2012, the European Scientific Committee on Consumer Safety29 established the maximum permissible level of N-nitrosamines in certain cosmetic raw materials, whereby fatty acid dialkylamides, dialkanolamides, monoalkylamides, monoalkanolamines, and their salts, as well as trialkylamines, trialkanolamines, and their salts, are allowed to contain N-nitrosamines at levels not exceeding 50 µg kg-1.
Cosmetic thermal waters contain components that could act as potential precursors for N-nitrosamines. Evaluation of the components of the cosmetic thermal water formulations revealed a potential risk of N-nitrosamines contamination. Triethanolamine, commonly used as an emollient, has been associated with the possible formation of NDELA27 and was listed on the labels of samples I and L. The preservative imidazolidinyl urea has also been identified as a source of NDELA30 and was listed as an ingredient in samples B, G, I, K, and L. In addition, the water itself could contribute to N-nitrosamines contamination, since potable water has been reported to contain traces of N-nitrosamines, particularly NDMA and NMOR.31,32
In addition, packaging material, such as rubber components, adhesives, inks, plastics, can contribute to N-nitrosamine formation by introducing or interaction of nitrosamine precursors.33
Four N-nitrosamines have been detected previously in cosmetics34 but their presence in cosmetic thermal waters has not been evaluated in any previous studies. Consequently, NDELA, NDMA, NDEA, and NMOR were considered as potential contaminants in cosmetic thermal water, prompting the development of an analytical method to monitor their presence in this type of product. Although the concentration levels in cosmetics are typically on the order of parts per billion (ppb), ongoing monitoring is essential, due to the toxicity associated with these compounds.
Cosmetic thermal waters are invariably marketed in spray or aerosol packaging designed to create an aerosol (or mist) for facial application. These include both pump sprays, which use a mechanical pump system to release the liquid, and propellant-based sprays, which utilize a propellant (typically nitrogen). These products are intended to be sprayed at 20-30 cm from the face and allowed to dry naturally. It is necessary to highlight this mode of application, because sprayed products, particularly those intended for facial use, can be inadvertently inhaled or ingested by consumers. Consequently, the substances in these products are not only absorbed by the skin but can also present lung and systemic exposure risks. The dynamics and size of the droplets formed depend on various factors, including the composition of the formulation. Propellant-based systems generally produce smaller droplets, which can result in a higher risk of inhalation for users. Therefore, in addition to dermal and oral exposure, the possibility of inhalation exposure must be taken into consideration.35
The presence of potential N-nitrosamine precursors in the formulations of cosmetic thermal waters, together with the fact that these products are used as facial sprays, potentially increases the risk of user exposure. For this reason, given the lack of reported studies concerning the presence of N-nitrosamines in cosmetic thermal waters, it was decided to develop a method for the quantification of N-nitrosamines in these products.
Method development
As shown in Table 2, cosmetic thermal water formulations contain both polar components (such as minerals and some natural extracts) and nonpolar components (such as emollients and preservative agents), which could interfere with the analysis of N-nitrosamines. This complexity, combined with the expected low levels (typically on the order of ppb) of N-nitrosamines in cosmetics, can make it challenging to accurately quantify these contaminants. To address this issue, without resorting to laborious sample preparation procedures that often involve offline concentration and cleanup steps, this study employed bidimensional chromatography (LC-LC-MS/MS) with two columns: one for the first dimension (1D column) and another for the second dimension (2D column).
In the developed method, polar concomitants were eluted from the first column, while N-nitrosamines and nonpolar concomitants were retained (Figure 3a). Subsequently, the fraction containing N-nitrosamines was transferred to the 2D column, with nonpolar concomitants continuing to be retained in the 1D column (Figure 3b). Finally, N-nitrosamines were chromatographically separated in the 2D column and directed to the MS/MS for mass detection and quantification, while the nonpolar concomitants were eluted from the 1D column (Figure 3c).

Schematic representation of the two-dimensional LC chromatography process. (a) Loading step: polar matrix components are directed to waste while the analytical (2D) column is equilibrating; (b) N-nitrosamines are transferred from the first dimension (1D) to the second dimension (2D) column; (c) separation of N-nitrosamines on the 2D column followed by transfer to the MS/MS detector.
The optimization of this method required a precise balance among the interactions of the sorbent phases of the columns and the mobile phases. Critical parameters considered during method development included the sorbent materials of the columns, the volume and composition of the loading solvent, the elution gradient, and the injection volume.
In previous work by the same research group15 an OASIS HLB reversed-phase sorbent was used in the first chromatographic dimension for the determination of NDELA in shampoo. It was observed that NDELA interacted weakly with this sorbent, so it was not possible to use a solvent (methanol) in the loading and washing step, without significant loss of the analyte.
Given these previous results, an Atlantis T3 C18 column with particle size of 3 µm was evaluated, since this sorbent is suitable for the separation of more polar compounds. In addition, the smaller particle size of the sorbent enhanced the separation efficiency of the column. Use of the Atlantis T3 column resulted in a more efficient cleanup step to eliminate concomitants that could negatively influence the ionization process in the APCI source, without significant losses of the N-nitrosamines.
After selecting the 1D column, the next step was to optimize the loading solvent composition and volume. The loading solvent must achieve two main objectives: (i) concentration of the analytes on the column and avoidance of their elution to waste during loading; and (ii) removal of polar components from the sample matrix (Figure 4). To determine the optimal solvent composition, water:methanol ratios of 100:0, 97:3, 95:5, and 93:7 (v/v) were evaluated (Figure 4a). For all the N-nitrosamines, higher proportions of methanol resulted in smaller peak areas, indicating inadequate retention during the sample loading step. Consequently, 100% water was selected as the loading solvent, which provided the best concentration of the analytes on the column, while allowing the removal of polar compounds.

Areas of the signals for NDELA, NDMA, NDEA, and NMOR using different loading solvent ratios (a), loading volumes (b), and injection volumes (c) (n = 3). The standard solution used contained 25.0 ng mL-1 of NDELA and 40.0 ng mL-1 of NDMA, NDEA, and NMOR.
Next, for further optimization of the loading process, the loading volume was assessed, using volumes of 0.218, 0.261, 0.348, 0.435, and 0.609 mL. The goal was to use the largest possible volume, to efficiently eliminate polar concomitants, without losing the target N-nitrosamines retained on the 1D column. The results, expressed as peak areas (Figure 4b), indicated that use of the highest volume (0.609 mL) resulted in loss of all the N-nitrosamines during sample loading. Volumes of 0.348 and 0.435 mL were effective for NDMA, NDEA, and NMOR, but led to decreased NDELA peak areas. The use of 0.261 mL provided a maximum peak area for NDELA, without affecting NDMA, NDEA, and NMOR. Therefore, 0.261 mL was selected as the optimal loading volume.
Next, evaluation was made of the effect of the injection volume, using volumes of 100, 150, 200, and 250 µL. Although larger volumes introduce more analyte, potentially increasing signal strength, they can also introduce more potential concomitants, causing nonlinear signal increases. Furthermore, a larger injection volume may lead to analyte loss from the 1D column during loading, particularly for analytes with lower affinity for the sorbent phase. However, the results (Figure 4c) showed that increasing the injection volume consistently increased the areas of the signals for the N-nitrosamines. Consequently, an injection volume of 250 µL was selected as the optimal condition.
After establishing the best loading solvent composition, loading volume, and sample injection volume, the next step was to optimize the elution gradient to ensure efficient elution of the N-nitrosamines from the 1D column, without eluting nonpolar matrix concomitants. In addition, the elution gradient for separating the N-nitrosamines on the 2D column was refined. An essential aspect of this optimization was to determine appropriate washing and regeneration times for the 1D column, ensuring that less polar concomitants remaining on the 1D column were adequately removed and that the column was re equilibrated, prior to the next injection. Different washing times were evaluated, with the optimal condition identified as 1.90 min for washing the column with 100% methanol, followed by 2 min of reconditioning with the initial loading solvent. This procedure was effective in removing residual polar components and preparing the column for the next injection. Importantly, under these conditions, no carryover was observed and the total chromatographic run was completed in 7 min. The final method gradient used is shown in Table 1.
Sample preparation and method validation
The primary objective was to develop a method with minimal sample preparation, while maintaining sufficient sensitivity to detect concentrations in the ng mL-1 range. To achieve this, an initial evaluation involved a straightforward approach (procedure A-direct injection) where internal standards were added to the samples, followed by filtration and direct injection into the LC-LC-MS/MS system.
It was observed that under the MS/MS conditions used, the signal intensity was inherently higher for NDELA, compared to NDMA, NDEA, and NMOR. This difference resulted in different LOQ values for the N-nitrosamines, necessitating the use of different concentrations in the method validation assays (Table 3). Consequently, the calibration curves and the samples used in the precision, accuracy, and recovery assays were prepared using concentrations of NDELA that differed from those of NDMA, NDEA, and NMOR. The calibration curves and corresponding residual plots are presented in Figure S1 (SI section). Despite these differences, the method was successfully validated, with the results (Table 3) indicating that for the concentration ranges used in this work, the validation parameters were satisfactory for all the N-nitrosamines. This demonstrated that the developed method was able to accurately and precisely quantify NDELA, NDMA, NDEA, and NMOR in samples of cosmetic thermal water.
Although the method was straightforward, the LOQ values were relatively high (5 ng mL-1 for NDELA and 20 ng mL-1 for NDMA, NDEA, and NMOR). To address this, a second sample preparation procedure was evaluated, incorporating a concentration step (procedure B-solid phase extraction). This involved the use of solid phase extraction (SPE) with a charcoal sorbent, resulting in a concentration factor of 100-fold. The method was validated, obtaining the parameters shown in Table 4. The calibration curves and corresponding residual plots are presented in Figure S2 (SI section).
Incorporating the concentration step prior to quantification resulted in LOQ values that were 5 times lower for NDELA and 200 times lower for NDMA, NDEA, and NMOR. Both accuracy and precision were within acceptable ranges for the concentration levels analyzed.
Following this validation, comparison was made between the calibration curves obtained for the compounds in solvent, with and without the SPE concentration step. The aim was to assess the feasibility of using internal standardization in solvent for quantification of analytes concentrated in the cartridge, given that the use of internal standards can correct for losses or variations during sample preparation. Application of the paired t-test (95% confidence level) showed no significant differences in the slopes of the analytical curves for any of the compounds (NDELA, NDMA, NMOR, and NDEA). These results showed that calibration curves prepared with the analytes in solvent could be used to quantify the N-nitrosamines in aqueous samples concentrated by offline SPE, streamlining the process and reducing the use of solvents and consumables. However, it is important to note that this procedure was only viable when the deuterated standard of the analyte was used.
Analysis of cosmetic thermal water samples
The twelve samples were analyzed for the presence of NDELA, NDMA, NDEA, and NMOR using procedure A for sample preparation, followed by LC-LC-MS/MS quantification. For all the N-nitrosamines, the results were below the LOQ values (NDELA 5.0 ng mL-1 and NDMA, NMOR, and NDEA 20 ng mL-1). To evaluate accuracy of the method, the samples were fortified at the LOQ concentration for each analyte. The results showed satisfactory accuracy for NDMA, NMOR (except sample L), NDELA (except samples H, I, and L) and NDEA (except samples A, H and L) (Table 5, direct injection - procedure A). The findings reflected the complexity of these cosmetic formulations that contained many other components additional to water. Although the method was designed to maximize separation of the N-nitrosamines from other matrix components in the first chromatographic dimension, some of the sample matrices still contained coeluting components that interfered with the N-nitrosamine signals.
The validated method with offline SPE for sample preparation (procedure B) was applied to samples H, I, and L, which had shown unsatisfactory recovery performance. Additionally, three samples (B, G, and K) that had shown satisfactory results using direct injection (procedure A) were randomly selected to determine whether inclusion of the SPE step had any influence on the recovery values. For comparison of the recoveries using the sample preparation B, the samples were fortified with the same concentration level as used at procedure A, and 20 mL were percolated onto the SPE cartridge. Quantitation was carried out using internal standard calibration curves (Figure S3, SI section). The concentration range was 100 to 500 ng mL-1 for NDELA, NDMA, NDEA, and NMOR. The internal standards were added at concentrations of 1200.0 ng mL-1 for NDELA-d8 and 600.0 ng mL-1 for NDMA-d6, NMOR-d4, and NDEA-d10. The recovery results obtained using the additional SPE step (offline SPE, procedure B) are presented in Table 5.
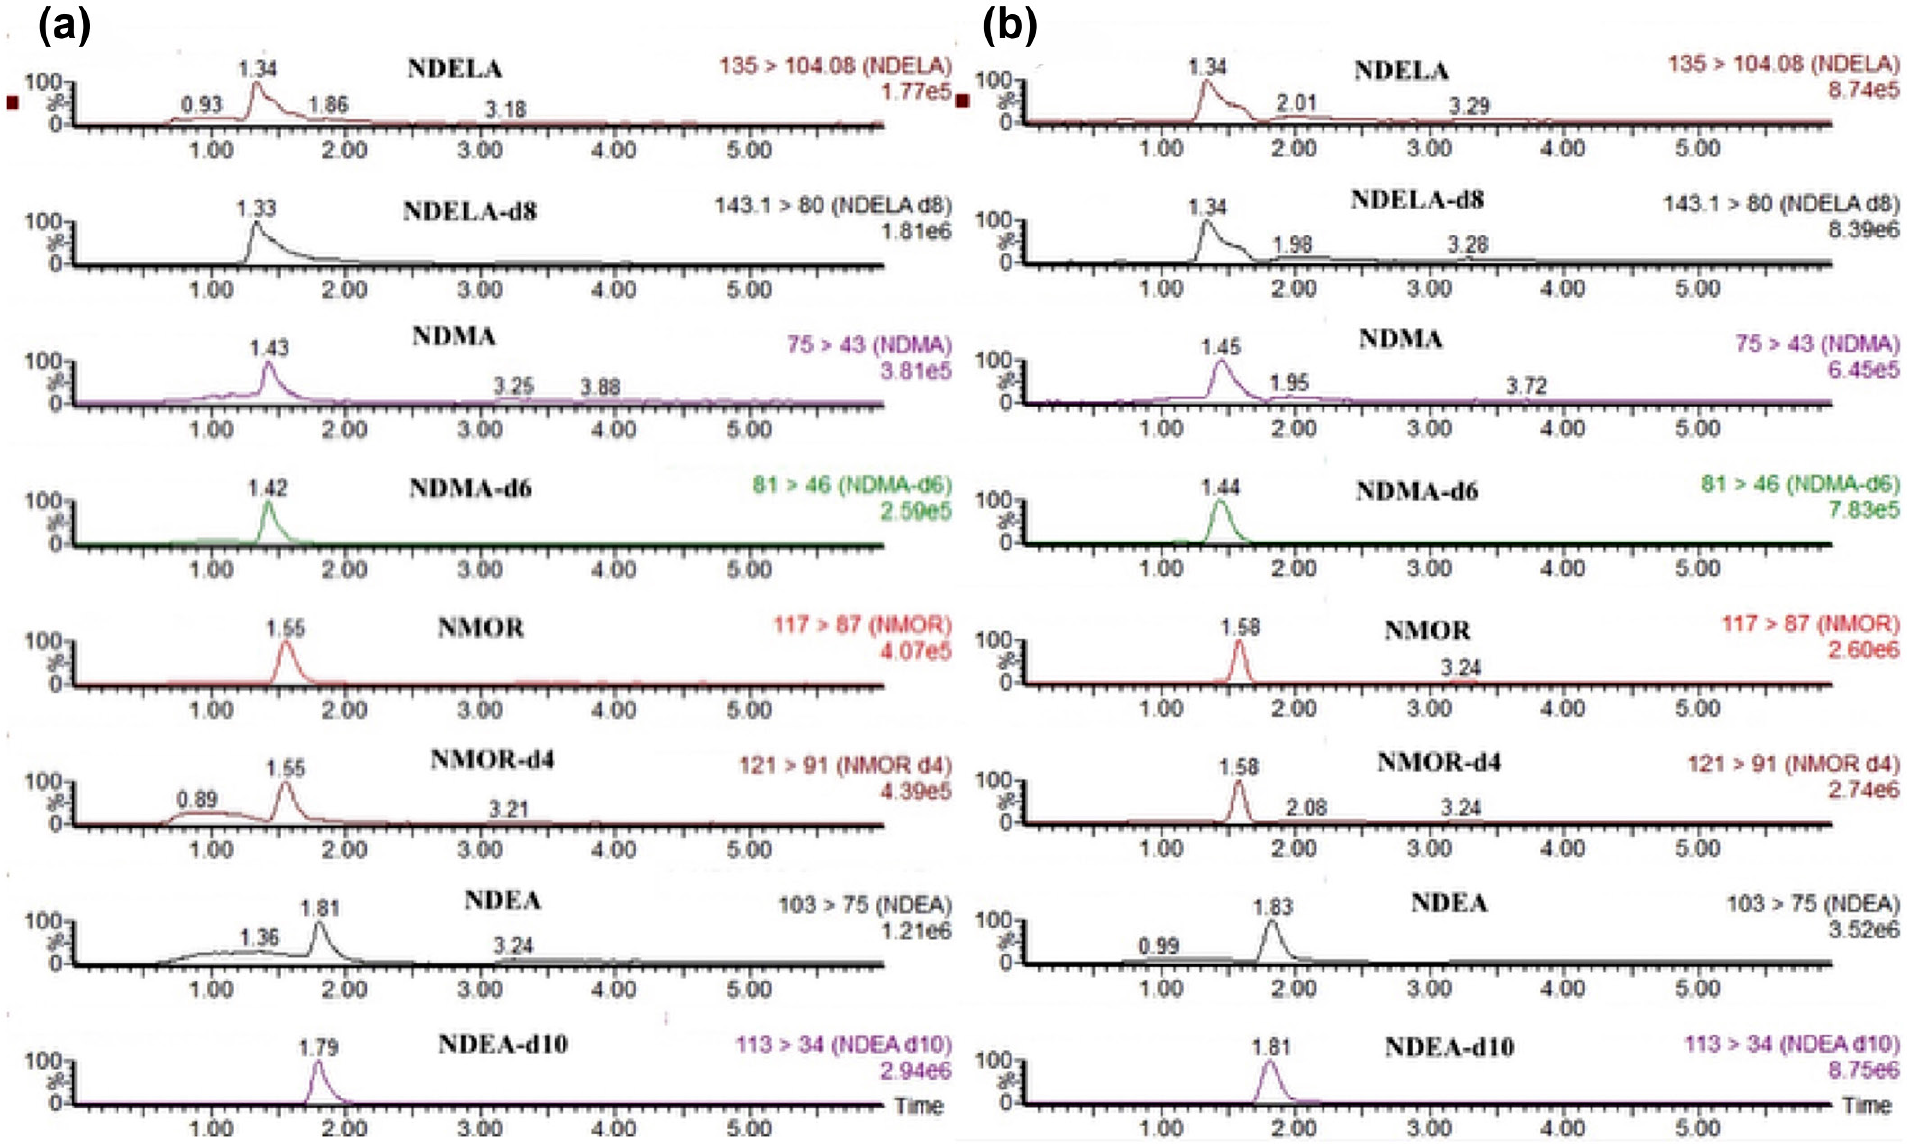
Typical chromatograms using sample preparation procedures A and B are shown for the fortified sample G in Figures 5.

LC-LC-MS/MS chromatograms of sample G fortified with NDELA (5 ng mL-1), NDMA, NDEA, and NMOR (20 ng mL-1). Internal standards: NDELA-d8 60 ng mL-1, and NDMA-d6, NDEA-d10, and NMOR-d4 30 ng mL-1: (a) direct injection - procedure A; (b) solid phase extraction - procedure B.
The additional SPE sample preparation step was effective in enabling the quantification of NDELA in samples I and L, as well as NMOR in sample L, obtaining acceptable recoveries. For NDMA and NMOR in sample I, as well as NDMA in sample L, for which satisfactory recovery had already been achieved without pretreatment, the use of offline SPE did not provide any additional benefits. Similarly, for samples B, G, and K, which had already shown satisfactory recoveries using only LC LC MS/MS, inclusion of the offline SPE step did not markedly affect the recovery outcomes. In addition, NDEA was successfully recovered for all the samples prepared using the SPE procedure. For sample H (29 labelled ingredients, Table 2), NDELA could not be recovered, even with inclusion of the SPE step, indicating that although this additional step could resolve some of the issues associated with complex matrices, it was unable to eliminate all the potential problems.
Overall, for most of the samples, the developed method with direct injection provided successful recovery of the target N-nitrosamines. The additional offline SPE step enhanced the approach for samples with interferents that hindered N-nitrosamine quantification, except for one sample.
Conclusions
This study investigated the potential for the presence of N-nitrosamines in formulations of cosmetic thermal water products marketed in Brazil. The analysis suggested a potential risk of contamination with N-nitrosamines in these products. To address this risk, a bidimensional chromatography method was developed and validated for the precise and accurate quantification of NDELA, NDMA, NDEA, and NMOR in cosmetic thermal waters, with limits of quantification of 5.0 ng mL-1 for NDELA and 20.0 ng mL-1 for NDMA, NDEA, and NMOR without sample preparation. Using a SPE procedure in the sample preparation step, lower LOQ can be achieved (< 1 ng mL-1).
Twelve cosmetic thermal water samples obtained from local commercial establishments in Brazil were analyzed. For most of the samples, the direct injection method provided satisfactory accuracy for the target N-nitrosamines, except for certain cases where matrix interferents coeluted with the N-nitrosamines, affecting quantification of the analytes. Therefore, for analysis of these challenging matrices, an additional SPE step using charcoal cartridges was developed and validated. This approach improved the recoveries of NDELA, NDEA, NDMA, and NMOR in specific samples, demonstrating its utility for more complex matrices.
The samples were analyzed for the presence of the four N-nitrosamines, with the bidimensional method without sample preparation being used for most samples, while the offline SPE followed by LC-LC-MS/MS analysis method was applied for six samples. The results showed that for all the analyzed samples, the levels of the N-nitrosamines were below the limits of quantification.
The findings demonstrated the effectiveness of the developed methods for monitoring contamination with N-nitrosamines in cosmetic thermal waters. The compositions of these products highlight the importance of ongoing surveillance and detailed formulation analysis to ensure their safety for consumers. The additional SPE step provided a robust solution for the analysis of complex matrices, further enhancing the applicability of the method.
Supplementary Information
Supplementary information (mass spectrometry conditions and internal standard calibration curves) is available free of charge at http://jbcs.sbq.org.br as PDF file.
Data Availability Statement
All data are available in the text.
Acknowledgments
This work was supported financially by the São Paulo State Research Foundation FAPESP, grant No. 2021/03239-0 and CNPq grant No. 304584/2021-5.
References
-
1 Liu, J. K.; Nat. Prod. Bioprospect. 2022, 12, 40. [Crossref]
» Crossref -
2 European Consumer Perception Study 2022, https://cosmeticseurope.eu/cosmetic-products/european-consumer-perception-study-2022, accessed in May 2025.
» https://cosmeticseurope.eu/cosmetic-products/european-consumer-perception-study-2022 -
3 Suphasomboon, T.; Vassanadumrongdee, S.; Sustainable Prod. Consumption 2022, 33, 230. [Crossref]
» Crossref -
4 Kumar, S.; Talwar, S.; Krishnan, S.; Kaur, P.; Dhir, A.; J. Retail. Consumption Serv. 2021, 63, 102668. [Crossref]
» Crossref -
5 Associação Brasileira da Indústria de Higiene Pessoal, Perfumaria e Cosméticos (ABIHPEC), Panorama do Setor 2024, https://abihpec.org.br/publicacao/panorama-do-setor-24/, accessed in May 2025.
» https://abihpec.org.br/publicacao/panorama-do-setor-24/ -
6 Associação Brasileira da Indústria de Higiene Pessoal, Perfumaria e Cosméticos (ABIHPEC), Vaidosas Brasileiras Buscam Beleza Natural, https://abihpec.org.br/vaidosas-brasileiras-buscam-beleza-natural, accessed in May 2025.
» https://abihpec.org.br/vaidosas-brasileiras-buscam-beleza-natural -
7 Ghersetich, I.; Brazzini, B.; Hercogova, J.; Lotti, T. M.; Clin. Dermatol. 2001, 19, 478. [Crossref]
» Crossref -
8 Seite, S.; Clin. Cosmet. Investig. Dermatol. 2013, 6, 23. [Crossref]
» Crossref -
9 Fan, T. Y.; Goff, U.; Song, L.; Fine, D. H.; Arsenault, G. P.; Biemann, K.; Food Cosmet. Toxicol. 1977, 15, 423. [Crossref]
» Crossref -
10 Barnes, J. M.; Magee, P. N.; Br. J. Ind. Med. 1954, 11, 167. [Crossref]
» Crossref -
11 Telling, G. M.; Trends Anal. Chem. 1982, 1, 277. [Crossref]
» Crossref -
12 Rath, S.; Canaes, L. S.; Quim. Nova 2009, 32, 2159. [Crossref]
» Crossref -
13 Ikeda, K.; Migliorese, K. G.; J. Soc. Cosm. Chem. 1990, 41, 283. [Crossref]
» Crossref -
14 Lim, D. S.; Lim, S. K.; Kim, M. K.; Kwon, Y. C.; Roh, T. H.; Choi, S. M.; Yoon, S.; Kim, H. S.; Lee, B. M.; J. Toxicol. Environ. Health, Part A 2018, 81, 241. [Crossref]
» Crossref -
15 Tada, A.; Rodrigues-Silva, C.; Rath, S.; J. Pharm. Biomed. Anal. 2021, 202, 114132. [Crossref]
» Crossref -
16 Joo, K.-M.; Shin, M.-S.; Jung, J.-h.; Kim, B.-M.; Lee, J.-W.; Jeong, H.-J.; Lim, K.-M.; Talanta 2015, 137, 109. [Crossref]
» Crossref -
17 Choi, N. R.; Kim, Y. P.; Ji, W. H.; Hwang, G.-S.; Ahn, Y. G.; Talanta 2016, 148, 69. [Crossref]
» Crossref -
18 Davarani, S. S.; Masoomi, L.; Banitaba, M. H.; Zhad, H. R.; Sadeghi, O.; Samiei, A.; Talanta 2013, 105, 347. [Crossref]
» Crossref -
19 Schettino, L.; Benedé, J. L.; Chisvert, A.; RSC Adv. 2023, 13, 2963. [Crossref]
» Crossref -
20 The network of Official Cosmetic Control Laboratories (OCCLs), https://www.edqm.eu/en/occls-analytical-methods-guidance-documents-and-studies, accessed in May 2025.
» https://www.edqm.eu/en/occls-analytical-methods-guidance-documents-and-studies -
21 Agência Nacional de Vigilância Sanitária (ANVISA); Consultas/Cosméticos - Produtos Regularizados, https://consultas.anvisa.gov.br/#/cosmeticos/regularizados/, accessed in May 2025.
» https://consultas.anvisa.gov.br/#/cosmeticos/regularizados/ -
22 Agência Nacional de Vigilância Sanitária (ANVISA); Resolução da Diretoria Colegiada (RDC), No. 7, de 10 de fevereiro de 2015, Dispõe sobre os Requisitos Técnicos para a Regularização de Produtos de Hygiene Pessoal, Cosméticos e Perfumes e dá Outras Providências, http://bvsms.saude.gov.br/bvs/saudelegis/anvisa/2015/rdc0007_10_02_2015.pdf, accessed in May 2025.
» http://bvsms.saude.gov.br/bvs/saudelegis/anvisa/2015/rdc0007_10_02_2015.pdf -
23 Brasil, Decreto Lei No. 7.841 de 8 de Agosto de 1945, Estabelece o Código de Águas Minerais, FAOLEX Database, https://www.fao.org/faolex/results/details/en/c/LEX-FAOC181050/, accessed in May 2025.
» https://www.fao.org/faolex/results/details/en/c/LEX-FAOC181050/ -
24 The European Parliament and the Council of the European Union, Directive 2009/54/EC of the European Parliament and of the Council of 18 June 2009 on the Exploitation and Marketing of Natural Mineral Waters, 2009, https://eur-lex.europa.eu/eli/dir/2009/54/oj, accessed in May 2025.
» https://eur-lex.europa.eu/eli/dir/2009/54/oj -
25 Porowski, A. In Environmental Geology, Encyclopedia of Sustainability Science and Technology Series; LaMoreaux, J., ed.; Springer, New York, NY, 2019, p. 149. [Crossref]
» Crossref -
26 Cacciapuoti, S.; Luciano, M. A.; Megna, M.; Annunziata, M. C.; Napolitano, M.; Patruno, C.; Scala, E.; Colicchio, R.; Pagliuca, C.; Salvatore, P.; Fabbrocini, G.; J. Clin. Med. 2020, 9, 3047. [Crossref]
» Crossref -
27 Bronaugh, R. L.; Congdon, E. R.; Scheuplein, R. J.; J. Invest. Dermatol. 1981, 76, 94. [Crossref]
» Crossref -
28 European Commission (EC); Regulation (EC) No. 1223/2009 of the European Parliament and of the Council; Official Journal of the European Union L 342, p. 59-209. [Link], accessed in May 2025
» Link -
29 Scientific Committee on Consumer Safety; Opinion on Nitrosamines and Secondary Amines in Cosmetic Products, https://ec.europa.eu/health/scientific_committees/consumer_safety/docs/sccs_o_090.pdf, accessed in May 2025.
» https://ec.europa.eu/health/scientific_committees/consumer_safety/docs/sccs_o_090.pdf -
30 Lim, D. S.; Roh, T. H.; Kim, M. K.; Kwon, Y. C.; Choi, S. M.; Kwack, S. J.; Kim, K. B.; Yoon, S.; Kim, H. S.; Lee, B. M.; J. Toxicol. Environ. Health, Part A 2018, 81, 465. [Crossref]
» Crossref -
31 Planas, C.; Palacios, Ó.; Ventura, F.; Rivera, J.; Caixach, J.; Talanta 2008, 76, 906. [Crossref]
» Crossref -
32 Gushgari, A. J.; Halden, R. U.; Chemosphere 2018, 210, 1124. [Crossref]
» Crossref -
33 Aglio, T. C.; Diniz, V.; Matos, M. F. A. V.; Rosa, P. P. C.; Rath, S.; Quim. Nova 2022, 45, 959. [Crossref]
» Crossref -
34 Zhu, Y. G.; Xia, Y.; Chen, Z.; Lin, L.; Juniper Online J. Dermat. Cosm. 2023, 5, 555656. [Crossref]
» Crossref -
35 Berrada-Gomez, M. P.; Bui, B.; Bondarenko, H.; Ferret, P. J.; Regul. Toxicol. Pharmacol. 2023, 139, 105359. [Crossref]
» Crossref
Edited by
-
Editor handled this article:
César Ricardo Teixeira Tarley (Associate)