Optimizing Raman Spectroscopy for Kerogen Maturity in Carbonate-Rich Source Rocks: The Critical Role of Targeted Decarbonation
Abstract
Raman spectroscopy is a powerful tool for assessing the thermal maturity of kerogen; however, its application to carbonate-rich source rocks is hampered by methodological challenges, particularly spectral interference from fluorescent mineral matrices and sample heterogeneity. This study systematically evaluates three preparation protocols: fresh (raw), macerated (ground), and decarbonated, on samples from the Formação Coqueiros (Campos Basin-RJ, Brazil) to identify the most reliable workflow, using Rock-Eval pyrolysis as a geochemical benchmark. Direct analysis of fresh samples proved unreliable, yielding inconsistent data in which the combined effects of heterogeneity and mineral fluorescence masked the true kerogen signal. While mechanical maceration successfully addressed physical heterogeneity, allowing for a basic qualitative distinction between maturity levels, it was insufficient, as the fundamental problem of spectral interference remained unresolved. The decarbonated protocol, however, yielded the optimal result. This two-step procedure, involving mechanical grinding followed by targeted chemical removal of carbonates, successfully mitigated both issues, producing stable, precise, and geologically coherent maturity data that correlates with the Rock-Eval temperature of maximum hydrocarbon generation (Tmax) benchmark. This work validates the targeted procedure as a robust, accessible workflow that avoids aggressive chemical treatments that risk altering the kerogen structure, offering a more efficient and potentially more accurate path for analysis in these common lithologies.
Keywords:
Raman spectroscopy; Rock-Eval pyrolysis; maturation; Formação Coqueiros; Campos Basin
Introduction
The characterization of organic matter in sedimentary source rocks is a fundamental step in petroleum system analysis, providing critical parameters for assessing hydrocarbon generation potential and mitigating exploration risks.1 The Campos Basin, a prolific hydrocarbon province offshore Brazil, hosts significant accumulations generated from lacustrine shales of the Early Cretaceous Lagoa Feia Group. Within this group, the Formação Coqueiros is recognized as a key source rock interval, containing type I/II kerogen capable of generating substantial volumes of oil and gas.2,3 A precise determination of its thermal maturity is therefore essential for understanding the timing of hydrocarbon generation and the distribution of petroleum phases within the basin.
The industry-standard method for evaluating source rock maturity is Rock-Eval pyrolysis, from which the temperature of maximum hydrocarbon generation during pyrolysis (Tmax) parameter is derived. Tmax serves as a robust proxy for the bulk thermal maturity of the organic matter.4 In parallel, Raman spectroscopy has gained prominence as a powerful, non-destructive technique for characterizing carbonaceous materials. The combination of Raman spectroscopy and optical microscopy allows for high spatial resolution analysis. It serves as a spectral fingerprint of the analyzed material, providing structural details that enable the identification of different maturation stages of organic matter.5-7
The characteristic Raman spectra of carbonaceous materials present two main bands: the G-band (at ca. 1600 cm-1) and the D-band (generally, a broad feature centered ca. 1350 cm-1). The G-band corresponds to the E2g vibrational mode of sp2-hybridized carbon. Conversely, the D-band, arising from the A1g vibrational mode, is attributed to defects in the C-sp2 lattice, which are associated with sp3-hybridized carbon.8 Carbonaceous materials in different stages of maturity present distinct G- and D-bands in the Raman spectra. The characterization of the characteristic features can be used to obtain Raman parameters that correlate with thermal maturity. The most used parameters are the full width at half maximum (FWHM) of the G-band, the intensity ratio of the D- and G-bands, and the G- and D-bands separation (RBS).5-7 We previously developed a methodology that uses Raman spectroscopy and machine learning to calculate the Raman-based equivalent vitrinite reflectance (%RRaman) from thin-section samples. The approach, which focused on samples from the Santos Basin, was validated against Rock-Eval pyrolysis.9 However, the application of Raman spectroscopy to whole rock samples presents methodological challenges, especially in complex matrices such as carbonate-rich shales. The sample preparation protocol can significantly influence the quality of the Raman spectra and the resulting parameters.
The Campos Basin, situated off the northern coast of the state of Rio de Janeiro and southern Espírito Santo in Brazil, spans an approximate area of 100,000 km2.3,10 It is one of the most prolific Brazilian basins, holding for a long time over 90% of the oil reserves of the country.10,11 Geologically, the basin began to form approximately 100 million years ago during the breakup of the Gondwana supercontinent and the subsequent separation of the South American and African plates, resulting in the development of a passive-margin basin.2,3,12
The Formação Coqueiros, a key component of the Lagoa Feia Group (LFG), is a significant stratigraphic unit within the Campos Basin.11,13 It comprises a substantial succession of lacustrine carbonates that were deposited during the Early Cretaceous period, specifically spanning the Barremian and Eoaptian ages.11,12 This deposition occurred during the late syn-rift to early post-rift (sag) phase, transitioning from fault-controlled subsidence to a more regional thermal subsidence regime. The Formação Coqueiros preserves evidence of a large brackish-water lacustrine system, characterized by bivalve, gastropod, and ostracod communities, with an absence of charophytes and evaporites.12,14 Micro-scale analysis via scanning electron microscopy (SEM) reveals a heterogeneous fabric, exhibiting variations in grain size, morphology, and porosity, consistent with a dynamic depositional setting influenced by factors like storm events and fluctuations in terrigenous input. Furthermore, the presence of authigenic minerals such as saddle dolomite, mega-quartz, and various sulfides provides evidence of hydrothermal alteration, linked to Late Cretaceous magmatic activity within the basin.12
Formação Coqueiros is recognized for its promising characteristics as a source rock within the Campos Basin of the petroleum system.11,12 The organic-rich shales intercalated within its lacustrine carbonate deposits, particularly those from the Barremian/Aptian rift phase (local stages Buracica and Jiquiá), are considered primary source rocks.2,3 These shales typically contain type I kerogen, with total organic carbon (TOC) content ranging from 2 to 6%.3,15 Analyses have shown that the organic matter in these shales has achieved a high thermal maturity level, values consistently between 1.03 and 1.40. This indicates that the organic matter has exceeded the oil window and entered the condensate-wet gas zone, indicating significant hydrocarbon generation. The occurrence of pyrite in the samples further suggests anoxic conditions favorable for organic matter preservation.12 While the coquina facies of the Formação Coqueiros are well-known prolific hydrocarbon reservoirs, the interbedded shales play a crucial role as source rocks, contributing substantially to the hydrocarbon accumulations of the basin.2,3,12
In a previous study, we characterized the mineralogy and thermal maturity of the Formação Coqueiros using Raman spectroscopy on samples prepared in three different ways: as fresh bulk rock (cutting samples), macerated and decarbonated with mild acid.12 That study revealed that the different preparation protocols yielded systematically different maturity values. Crucially, it lacked an independent geochemical benchmark to determine which protocol provided the most accurate representation of the true thermal maturity. This uncertainty leaves a critical methodological gap for the reliable application of Raman spectroscopy in this important geological context.
The present study aims to explicitly bridge that gap. By analyzing the same suite of samples from the Formação Coqueiros using Rock-Eval pyrolysis, we establish a definitive Tmax benchmark. The primary objectives of this work are to quantitatively compare the Rock-Eval Tmax data against the Raman spectral parameters obtained from each of the three preparation protocols, determine which protocol yields the most statistically robust correlation with the benchmark maturity, and propose a validated and optimized workflow for the use of Raman spectroscopy as a reliable tool for thermal maturity assessment in carbonate-rich source rocks.
Experimental
Samples and preparation for Raman spectroscopy
Thirteen cutting samples were collected for this study from two wells in the Campos Basin: 6 DEV 18P RJS and 3-BP-11-RJS. Six samples originated from the 6 DEV 18P RJS well, covering depths from 5324 to 5444 m. The remaining seven samples were retrieved from the 3-BP-11-RJS well, spanning depths from 6220 to 6382 m. The stratigraphic locations of these samples are shown in our previous work.12
To systematically evaluate the effect of sample processing on Raman spectra, three types of aliquots representing different preparation stages were analyzed:
-
(i) Fresh samples: these were raw cutting samples taken directly from the well, used for analysis without any form of sample preparation, grinding, or polishing.
-
(ii) Macerated samples: this protocol involved only mechanical disaggregation (it is not about chemical maceration procedures). The raw cuttings were ground using a ball mill in 5 min cycles at 40 rpm and subsequently sieved through a 106 µm mesh. This dry, powdered material is referred to throughout the text as macerated.
-
(iii) Decarbonated samples: this protocol involved a subsequent chemical treatment on the macerated powder. 10 g of the macerated material were immersed in a heated (80 °C) buffered solution of acetic acid (2 mol L-1) and sodium acetate (2 mol L-1) for 1 h to dissolve the carbonate mineral matrix. The resulting residue was filtered, dried, and is referred to as decarbonated.
Raman spectroscopy
Raman spectroscopic measurements were performed using a Bruker SENTERRA spectrometer coupled to an Olympus BX51 microscope, following the exact instrumental and acquisition protocols detailed in Barberes et al.12 Briefly, key parameters included a 532 nm laser excitation source, a 50× objective (numerical aperture (NA) = 0.50), a laser power of 0.2 mW, 50 μm confocal aperture, and an acquisition time of 50 s per spectrum. For each sample type, multiple spectra (at least five) were collected from at least three different areas to ensure statistical representation. A low laser power of 0.2 mW was used for all acquisitions to prevent laser-induced thermal alteration of the kerogen, a known risk for low-maturity organic matter that can artificially increase its apparent maturity.16
A standardized data processing workflow followed four sequential steps: (i) spectral smoothing via Savitzky Golay method with a 21-point cubic polynomial algorithm; (ii) a linear baseline correction was applied with control points at 1750 and 1100 cm-1 defined the as the spectral window; (iii) Raman intensities were normalized, scaling from zero (minimum intensity) to one (maximum intensity) using OriginPro 8.0 (OriginLab Corporation, OriginLab Corporation, Northampton, USA, 2009); and (iv) deconvolution of the bands was performed by Fityk 1.3.1 software or Python scripts to separate the overlapping signals, which was carried out using the Levenberg-Marquardt iteration algorithm and Gaussian-shaped functions in the description of D-bands and Lorentzian-shaped functions in the description of G-bands. Fityk 1.3.1 software (Marcin Wojdyr, Warsaw, Poland, 2016) or Python scripts were used to extract Raman key parameters, such as band heights, centers, areas, full width at half-maximum (FWHM), Raman band separation (RBS), and the D1/G area ratio.9,12
To achieve the primary objective of this study, the derived Raman parameters were quantitatively correlated against the Rock-Eval Tmax benchmark. Regression analysis using the least absolute shrinkage and selection operator (LASSO) method was performed for each of the three preparation protocols (fresh, macerated, and decarbonated), as previously established by Almeida et al.9 for thin section samples (Table S1, Supplementary Information (SI) section).
Briefly, the LASSO method combined the initial Raman parameters with additional variables derived from Raman parameters (such as exponential and logarithmic transformations) as multiple inputs to generate a %RRaman output. An initial vitrinite calibration was used with standard vitrinite samples to correlate the %Ro with Raman derived parameter to predict %RRaman through the LASSO algorithm regression. Details regarding the LASSO algorithm parameters and evaluation metrics can be found in our previous work.9
Rock-Eval pyrolysis
To establish an independent geochemical benchmark for thermal maturity, all thirteen samples were subjected to analysis on a Vinci Technologies Rock-Eval 7S instrument. The standard bulk rock-basic method was employed, using approximately 80 mg of powdered whole rock for each analysis.
The analytical procedure consists of a multi-stage thermal program conducted under a nitrogen atmosphere. The cycle begins with an initial isothermal hold at 300 °C for 3 min to volatilize free hydrocarbons (S1 peak), followed by a pyrolysis ramp from 300 to 650 °C at a heating rate of 25 °C min-1. During this ramp, hydrocarbons generated from the thermal cracking of kerogen are measured (S2 peak), and the temperature of maximum generation is recorded as Tmax. The carbon monoxide released during the pyrolysis was measured in two temperature intervals: S3CO, in the 300 - 390 °C range (associated with thermal cracking of oxygen containing functional groups of kerogens), and S3’CO, in the 400 - 650 °C range (associated with thermal decomposition of carbonated minerals). The carbon dioxide released during pyrolysis was measured as a single parameter (S3) in the entire pyrolysis temperature range. After pyrolysis, the sample residue undergoes oxidation up to 850 °C to determine the residual carbon. Free and generated hydrocarbons (S1 and S2) are quantified by a flame ionization detector (FID), while the CO and CO2 released during the entire process are measured by non-dispersive infrared (IR) cells to calculate the total organic carbon (TOC) content. This entire procedure follows the established standards for the technique.4 Instrument calibration and performance were verified using the IFPEN-160 000 international reference standard.17
Results and Discussion
Geochemical characterization (Rock-Eval) and establishment of a maturity benchmark
The complete results from the Rock-Eval pyrolysis are presented in Table 1. The samples exhibit high TOC content, ranging from 2.69 to 5.29%, confirming the excellent source rock potential from Formação Coqueiros and establishing a clear maturity gradient between the two wells. The hydrogen index (HI) and production index (PI) values clearly differentiate the samples from the two wells into distinct groups.
Samples from well 6-DEV-18P-RJS are characterized by high HI values (495 to 609 mg HC g-1 TOC) and lower Tmax values (426 to 438 °C). These parameters are consistent with oil prone type I or type I/II kerogen at the earlyto peak-oil generation window. In contrast, samples from well 3-BP-11-RJS are demonstrably more mature. They exhibit significantly lower HI values (235 to 376 mg HC g-1 TOC) and higher Tmax values, which range from 435 to 443 °C. This trend is consistent with the same kerogen type being more thermally advanced, placing it further within the oil window and closer to the condensate/wet gas zone. Collectively, the Rock-Eval data establishes a clear and robust maturity gradient, confirming that well 3-BP-11-RJS is thermally more mature than well 6-DEV-18P-RJS.
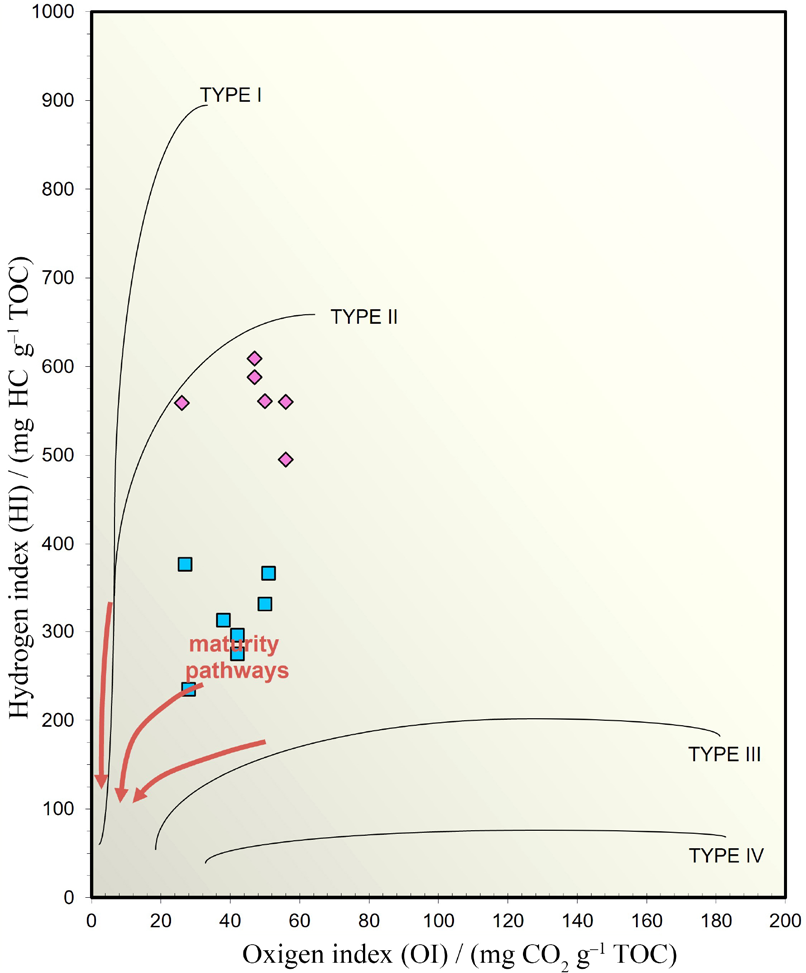
The modified van Krevelen diagram (Figure 1, HI vs. OI) indicates that the organic matter in both wells originates from the same high-quality, oil-prone source. The samples plot along the maturation pathway for type I/II kerogen, characterized by very high initial hydrogen index (HI) values and low oxygen index (OI) values, typical of a lacustrine depositional environment.
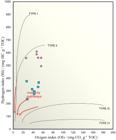
Modified van Krevelen diagram (hydrogen index (HI) vs. oxygen index (OI)) plotting the geochemical data for samples from well 6 DEV 18P-RJS (pink diamonds) and well 3-BP-11-RJS (blue squares). The data indicate a common type I/II kerogen origin for all samples, characteristic of a lacustrine depositional environment. The two sample sets form distinct clusters along a single maturation pathway (red arrows), with the samples from well 3-BP-11-RJS clearly shifted towards lower HI values, confirming their more advanced thermal maturity.
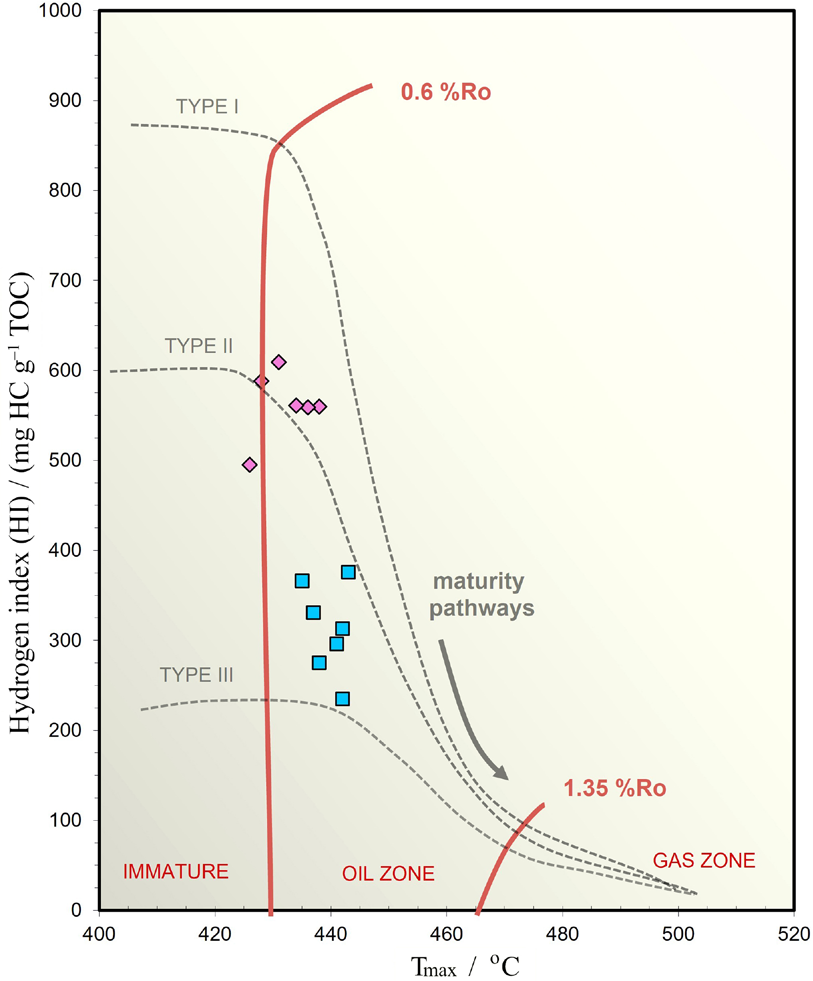
The plot of HI versus Tmax (Figure 2) is fundamental because it directly reveals the difference in thermal evolution. The samples from well 6-DEV-18P-RJS (pink diamonds) cluster in a zone of lower maturity, with Tmax values ranging from 426 to 438 °C. These samples retain high HI values (up to 609 mg HC g-1 TOC), placing them at the threshold between the immature stage and the onset of the oil generation window. In contrast, samples from well 3-BP-11-RJS (blue squares) are clearly shifted along the maturity pathway to higher Tmax values (435 to 443 °C) and consequently lower HI values (235 to 376 mg HC g-1 TOC).
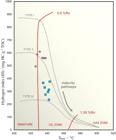
Plot of HI versus Tmax to determine the kerogen type and thermal maturity of the samples studied. All samples plot along the maturation pathway for type I/II kerogen. The samples from well 6-DEV-18P-RJS (pink diamonds) cluster at lower Tmax values (426 - 438 °C), placing them at the onset of the oil generation window (equivalent Ro ca. 0.6 - 0.8%). In contrast, samples from well 3-BP-11-RJS (blue squares) are clearly shifted to higher Tmax values (435 - 443 °C), positioning them further within the oil zone. This confirms the more advanced thermal state of well 3-BP-11-RJS. Tmax: temperature of maximum generation of hydrocarbons; HI: hydrogen index.
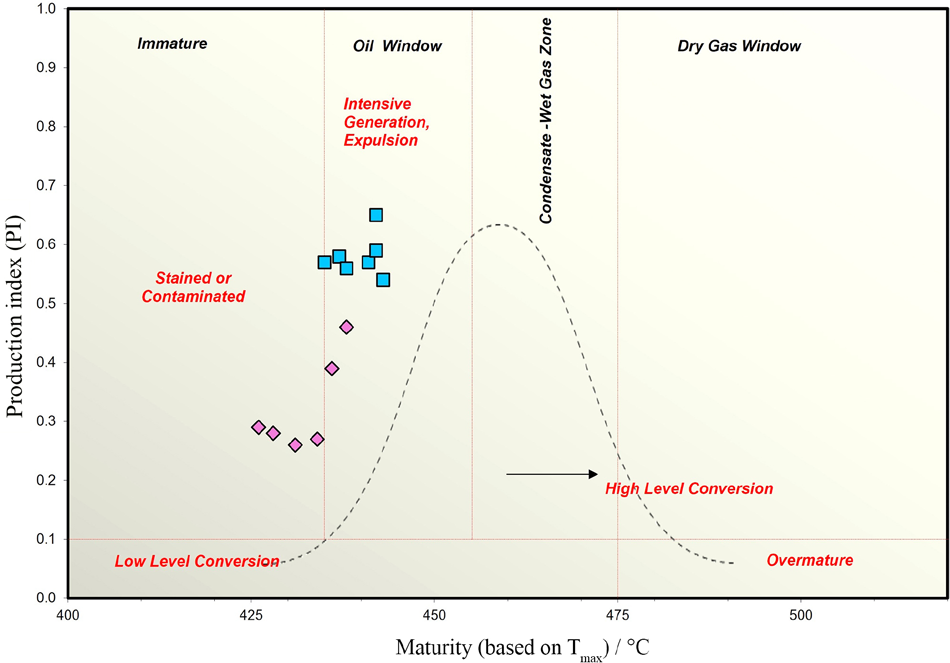
The above interpretation is further corroborated by the plot of production index (PI) versus Tmax (Figure 3), which reflects the hydrocarbon conversion ratio. The less mature samples from well 6-DEV-18P-RJS exhibit low PI values (0.26 to 0.46), indicating a low level of hydrocarbon conversion, as expected for organic matter just entering the oil window. Conversely, the more mature samples from well 3-BP-11-RJS show significantly higher PI values (0.54 to 0.65). These high values signify an intensive phase of hydrocarbon generation and expulsion, confirming that a much larger fraction of the kerogen has already been converted into petroleum.
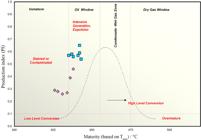
Plot of PI versus Tmax, illustrating the hydrocarbon conversion ratio of the samples. The samples from well 6-DEV-18P-RJS (pink diamonds) are characterized by low PI values (0.26-0.46), indicative of a low level of kerogen-to-hydrocarbon conversion, consistent with their position at the onset of the oil window. In contrast, the more mature samples from well 3-BP-11-RJS (blue squares) show significantly higher PI values (0.54-0.65), signifying an intensive phase of hydrocarbon generation and expulsion. This provides strong corroborating evidence for the more advanced thermal maturity of well 3-BP-11-RJS. Tmax: temperature of maximum generation of hydrocarbons; PI: production index.
Therefore, the combined Rock-Eval data provide unequivocal evidence that: (i) all samples share a common type I/II lacustrine origin, and (ii) the samples from well 3-BP-11-RJS are significantly more thermally mature than those from well 6-DEV-18P-RJS. This well-defined geochemical separation provides an ideal and robust benchmark for the primary objective of this study: to validate Raman spectroscopy as a sensitive and accurate tool for discriminating between unprocessed and processed samples.
Comparative Raman spectroscopy maturity data
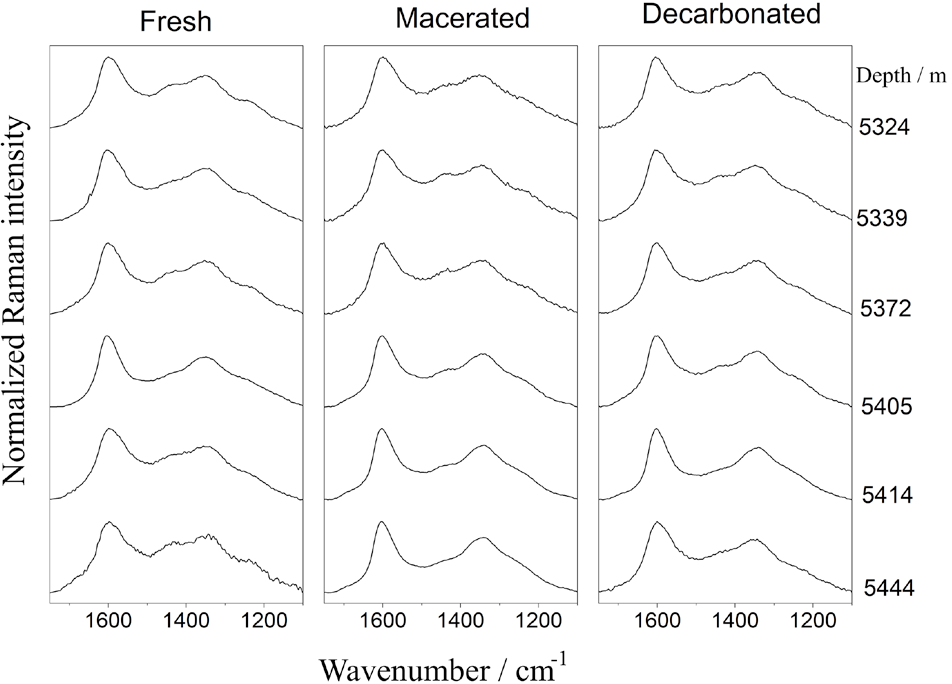
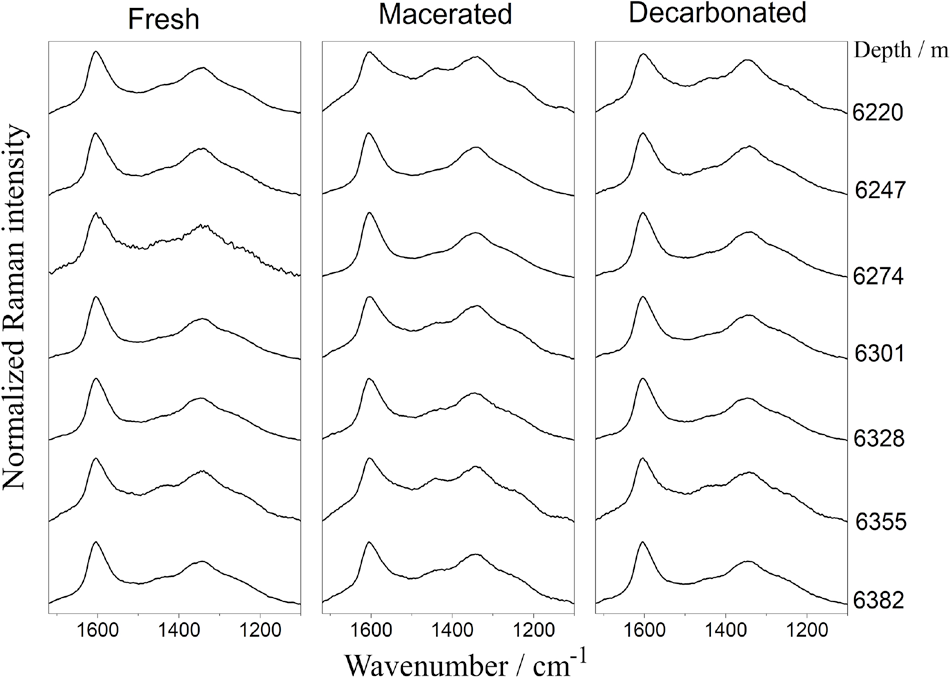
The Raman spectra for the three preparation protocols (fresh, macerated, and decarbonated) for the samples from wells 6-DEV-18P-RJS and 3-BP-11-RJS are shown in Figures 4 and 5, respectively. The spectra presented in Figures 4 and 5 are the average, normalized (0 - 1) results from at least three different sample areas. The characteristic G- and D-bands are present in all spectra, indicating the presence of organic matter. However, no discernible spectral differences were observed with increasing depth (Figures S1 and S2, SI section, show these data as superimposed plots). Regarding the comparison among protocols, it is worth mentioning that the spectra of fresh samples are slightly noisier, particularly for the 6 DEV 18P-RJS well. On the other hand, the similarity among the Raman spectra of the samples from the 3-BP-11-RJS well is much greater. Since the spectral changes are very subtle (probably due to the small depth difference between these wells), it should be noted that this Raman data agrees with the Rock-Eval interpretation, which showed that the samples from each well are similar. However, organic matter maturity can be evaluated by processing the Raman spectra (deconvolution) and calculating %RRaman to achieve a more comprehensive analysis of the Raman data.
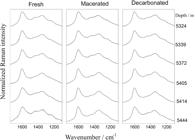
Raman spectra of drill cuttings samples from well 6 DEV 18P RJS at three processing stages: fresh, macerated, and decarbonated samples obtained with a 532 nm laser source. The spectra are stacked in order of increasing depth, as indicated on the right side of the figure.
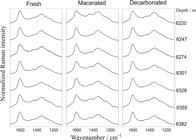
Raman spectra of drill cuttings samples from 3-BP-11-RJS at three processing stages: fresh, macerated, and decarbonated samples obtained with 532 nm laser source. The spectra are stacked in order of increasing depth, as indicated on the right side of the figure.
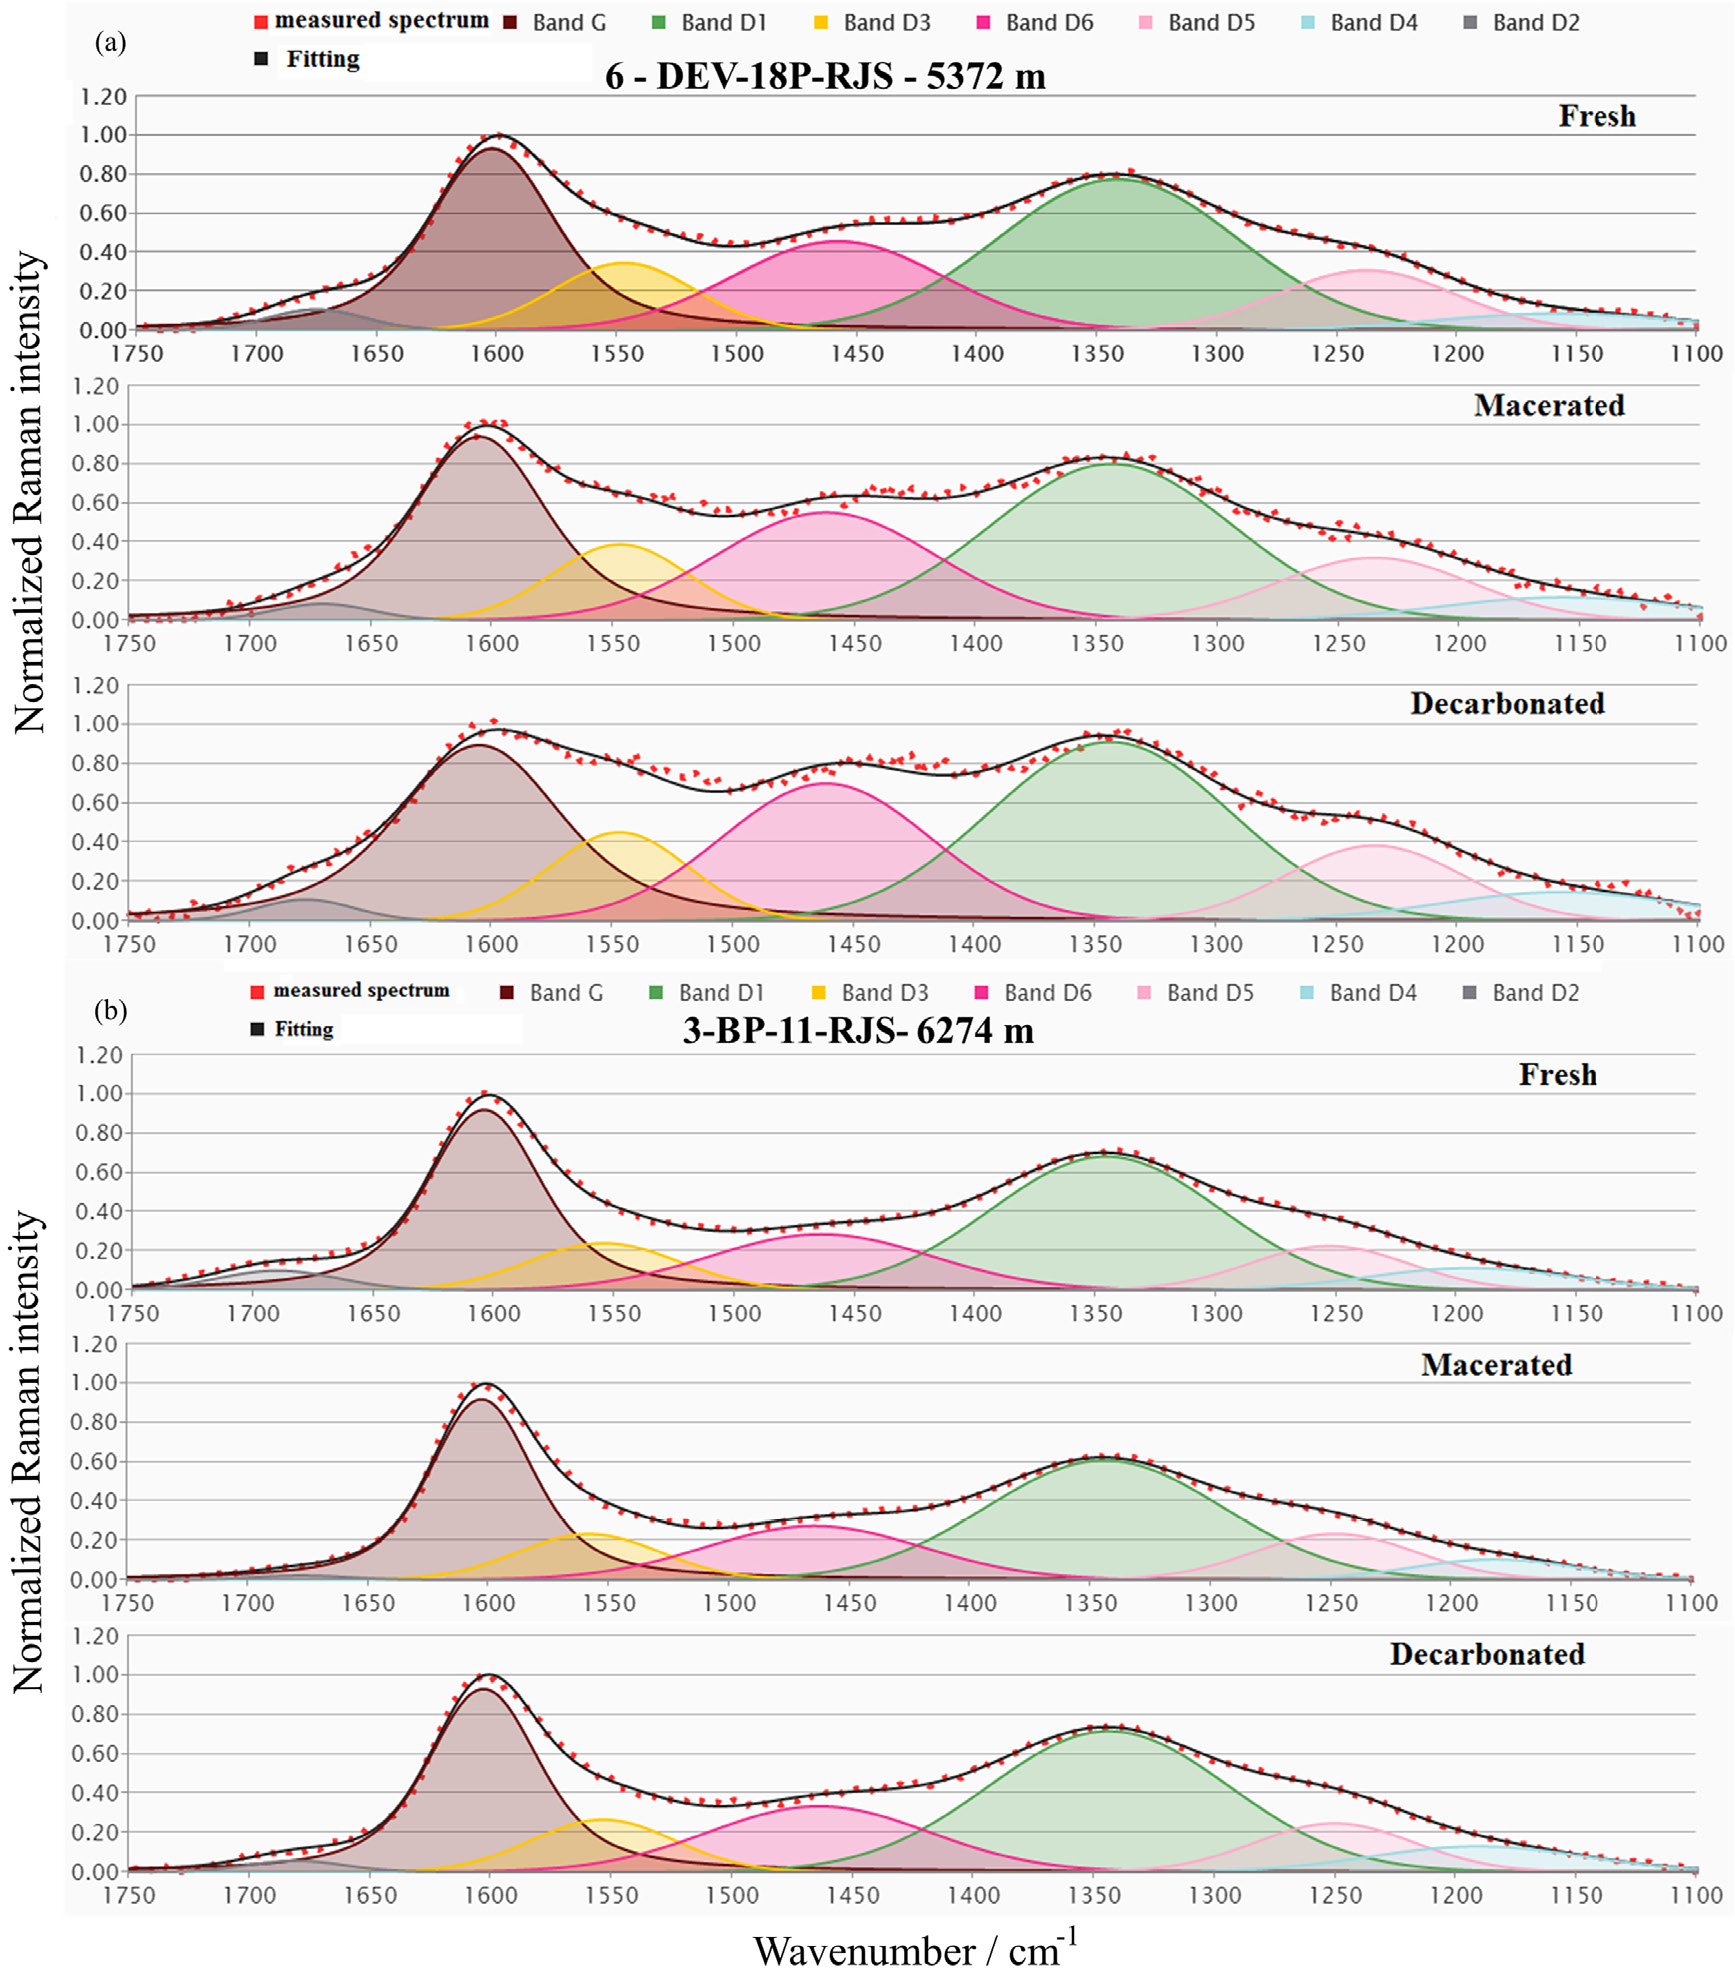
Figure 6 illustrates the normalized Raman spectra and the corresponding deconvoluted fitted bands for selected depths from both wells. The deconvolution was performed using seven bands (G and D1 to D6, as indicated in Figure 6) within the 1750 and 1100 cm-1 spectral range, with all correlation coefficients (R2) for all samples higher than 0.995. It is important to notice in Figure 6 that the D2 and D3 bands, related to disordered organic matter, and the D4, D5, and D6 bands, related to CH moieties in organic species,9 increase the intensity at the macerated and principally decarbonated sample of 6-DEV-18P-RJS, indicating the sample was more immature. For the sample of 3-BP-11-RJS, the intensities stay similar, showing a little difference between the two wells. From this procedure, the spectral parameters, such as integrated areas, position, and FWHM, were determined for all fitted bands. These parameters were then used to determine the %RRaman of the wells 6-DEV-18P-RJS and 3-BP-11-RJS samples, based on the %RRaman calibrated with vitrinite standard samples of our previous work.9
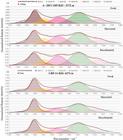
Representative Raman spectra and corresponding deconvoluted fitted bands for fresh, macerated, and decarbonated samples at selected depths from wells (a) 6-DEV-18P-RJS and (b) 3-BP-11-RJS.
The Raman-derived equivalent vitrinite reflectance (%RRaman) values were calculated for the same suite of samples using a machine learning model (LASSO) based on key spectral parameters derived from Raman, as detailed in Almeida et al.,9 and are shown in Table 2, considering the three different preparation protocols (fresh, macerated, and decarbonated). The LASSO algorithm automatically selects the most significant parameters to construct the regression model for predicting %RRaman. This capability is a distinct advantage for spectroscopic datasets, such as Raman spectra, which often exhibit complex and multicollinear variables. Consequently, LASSO was preferred over conventional techniques, such as standard linear regression.
Raman-derived equivalent vitrinite reflectance (%RRaman) values for fresh, macerated, and decarbonated samples (adapted from Barberes et al.12)
A primary observation is the significant variability in %RRaman values for the same sample when analyzed under different preparation protocols. For example, the sample from 5372 m (well 6-DEV-18P-RJS) yields a %RRaman of 1.26% on fresh rock, which decreases to 1.03% after full maceration and 1.10% after decarbonation (Table 2). This highlights the critical influence of the preparation method on the final calculated maturity value.
Despite this protocol-induced variability, a qualitative analysis of the data in Table 2 shows that all three methods generally capture the relative maturity difference between the two wells. On average, samples from the more mature well (3-BP-11-RJS) yielded higher %RRaman values than those from the less mature well (6-DEV-18P-RJS), regardless of the preparation method.
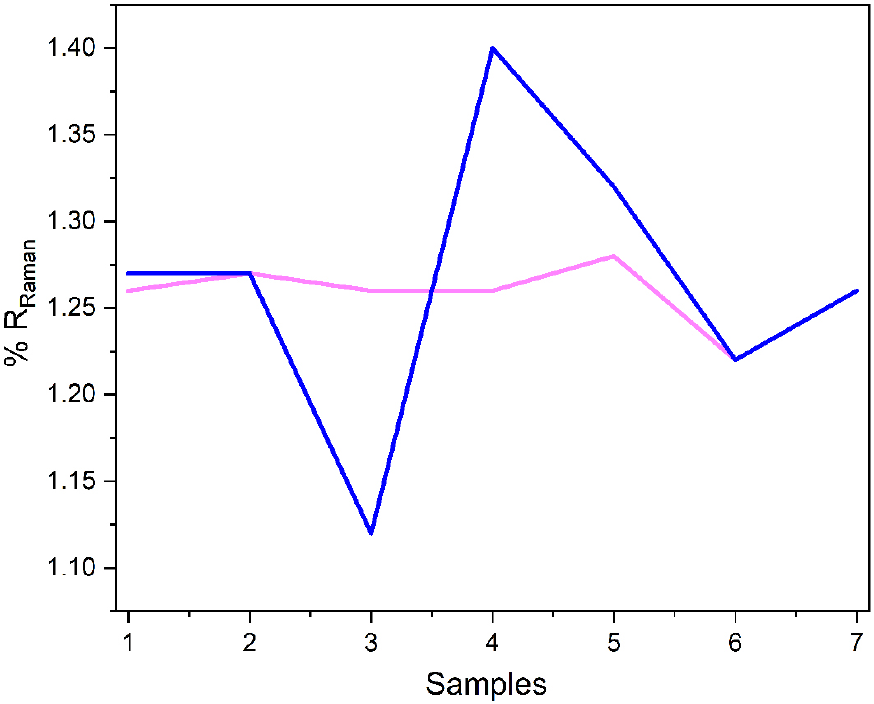
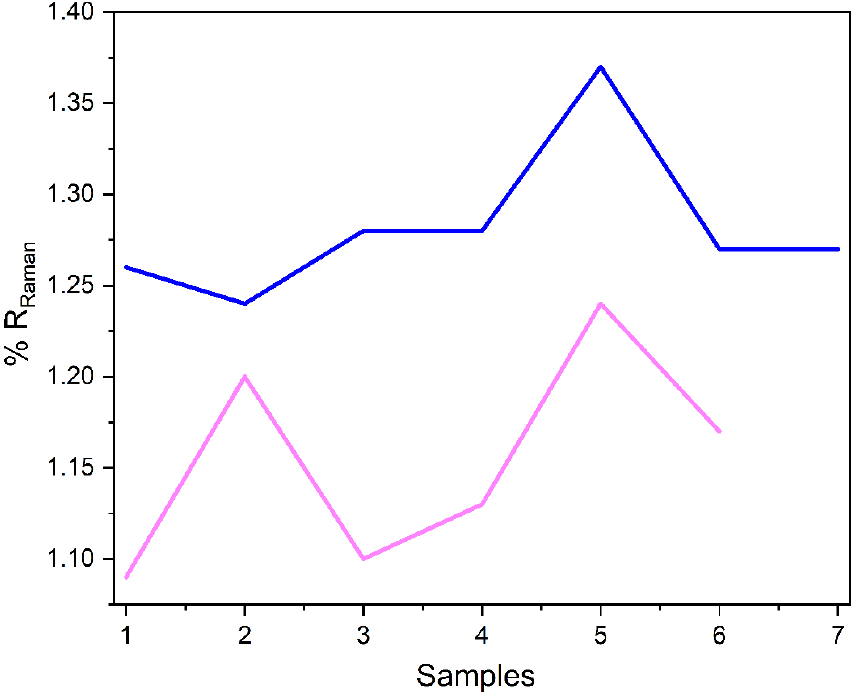
Having established a clear maturity benchmark with Rock-Eval data, the next step was to evaluate which Raman spectroscopy preparation protocol could most accurately and reliably reproduce this trend. The %RRaman for each of the three protocols is plotted in Figure 7. The plot shows the results for the less mature well, 6-DEV 18P-RJS (pink line), and the more mature well, 3-BP-11-RJS (blue line).
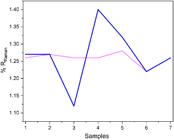
Raman-derived equivalent vitrinite reflectance (%RRaman) for the fresh (raw) cutting samples, plotting well 6-DEV-18P-RJS (pink line) and well 3-BP-11-RJS (blue line). The plot demonstrates the unreliability of analyzing unprepared samples. The two trend lines are erratic and frequently cross, failing to consistently identify well 3-BP-11-RJS as the more mature of the two. This poor performance is attributed to strong spectral interference from the mineral matrix and sample heterogeneity, which mask the true kerogen signal.
Fresh (raw) samples
Direct analysis of fresh (raw) cuttings proved less effective at discriminating between the two wells compared to macerated and decarbonated samples, as illustrated in Figure 7. The results failed to consistently distinguish the maturity levels of the two wells and exhibited sharp, geologically implausible fluctuations. The low significance of the outcomes is very likely to stem from two compounding factors inherent to unprepared geological samples.
First, the physical heterogeneity of the raw cuttings leads to non-representative sampling at the micro-scale. Second, and more critically, overwhelming fluorescence from the abundant carbonate matrix masks the true kerogen signal. These challenges are well documented; fluorescence is a known issue that affects Raman signals in low-maturity samples,16 while the impact of sample heterogeneity and surface artifacts is a key consideration in the analysis of carbonaceous materials.18
The dramatic swing in calculated maturity for a single well (for instance, from %RRaman 1.12 to 1.40 between adjacent samples in well 3-BP-11-RJS) is not a reflection of geochemical reality but a direct artifact of this unreliable approach. These results confirm that direct analysis is less effective than decarbonated analysis for both quantitative and qualitative assessment in this lithology.
Macerated samples
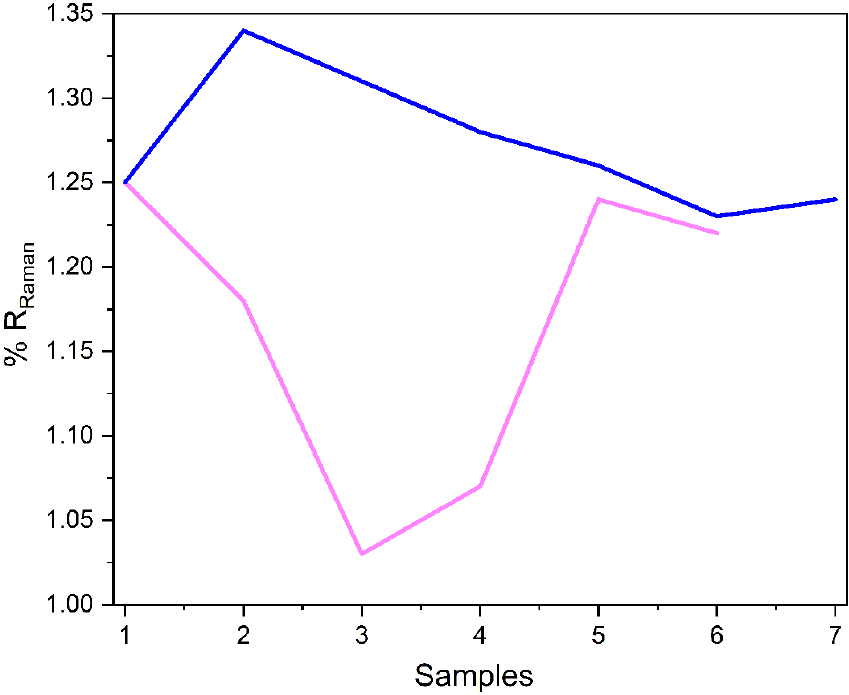
The macerated samples, which underwent mechanical grinding, represent a critical first processing step and show a marked improvement over the analysis of fresh cuttings (Figure 8). A consistent separation between the two wells became evident: the blue line (representing the more mature well, 3-BP-11-RJS) plots at consistently higher %RRaman values than the pink line (6-DEV-18P-RJS). This indicates that mechanical homogenization of the sample is sufficient to allow the Raman technique to qualitatively distinguish relative maturity differences, which was not possible with the raw samples.
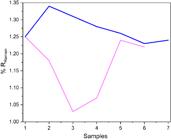
Raman-derived equivalent vitrinite reflectance (%RRaman) for the macerated (ground) samples, plotting well 6-DEV-18P-RJS (pink line) and well 3-BP-11-RJS (blue line). A marked improvement over the fresh samples is observed, with a consistent separation now evident between the less mature (pink) and more mature (blue) wells. However, the data still exhibits significant instability, particularly the sharp, geologically implausible fluctuations in the pink line. This indicates that while mechanical homogenization improves the result, the data quality is still compromised by unresolved spectral interference.
However, the results are still not quantitatively satisfactory. The data exhibits high variability and sharp, geochemically implausible fluctuations, demonstrating that while physical homogeneity has been achieved, the fundamental problem of spectral interference from the mineral matrix remains unresolved. This finding aligns with a broad consensus in the literature. Khatibi et al.19 demonstrated on the Bakken Shale that fluorescence from the mineral matrix can mask the true kerogen signal, concluding that isolating the organic matter was essential. This aligns with the work of Lin et al.,18 who identified sample preparation as a key factor influencing spectral quality.
Therefore, our results establish that mechanical processing may be considered a necessary but insufficient intermediate step for organic matter maturity evaluation. It successfully addresses sample heterogeneity but fails to mitigate the dominant issue of spectral interference, which could only be resolved by the subsequent chemical decarbonation.
Decarbonated samples
The analysis of the decarbonated samples presented in Figure 9, yielded the optimal and most conclusive result, successfully overcoming the limitations observed in both the fresh and macerated states. This success is a direct consequence of the two-step procedure, which systematically addresses the primary analytical challenges. While the initial grinding addressed physical heterogeneity, the subsequent chemical decarbonation addressed the dominant issue of spectral interference. By removing the fluorescent carbonate matrix, this partial isolation of the kerogen yielded a much cleaner signal, eliminating the erratic fluctuations and replacing them with smoother, geologically coherent trends. This validates the procedure as both sensitive enough to consistently distinguish the subtle maturity differences between the wells and robust enough to provide precise, reliable measurements.
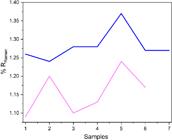
Raman-derived equivalent vitrinite reflectance (%RRaman) for the decarbonated samples, plotting well 6-DEV-18P-RJS (pink line) and well 3-BP-11-RJS (blue line). This protocol yields the optimal result, showing a clear and consistent separation between the two wells, with significantly improved data stability and geological coherence compared to the fresh and macerated samples. The removal of the fluorescent carbonate matrix results in a cleaner spectral signal, eliminating the erratic fluctuations and yielding precise, reliable maturity data.
While Khatibi et al.19 effectively demonstrated the benefits of full kerogen isolation using both HCl and HF, our results show that, for carbonate-rich source rocks, a targeted, milder chemical step is not only sufficient but potentially superior. By removing solely the carbonates, the primary source of fluorescence, excellent data stability, and a strong correlation with Rock-Eval benchmarks were achieved. This targeted approach may avoid the need for more aggressive hydrofluoric acid, thereby minimizing the risk of introducing structural artifacts to the kerogen and offering a more efficient workflow for this common lithology.
Furthermore, the present study demonstrates that a carefully designed sample preparation protocol offers a robust and practical solution to the problem of fluorescence. While advanced analytical techniques like surface-enhanced Raman spectroscopy (SERS) have been proposed to “significantly enhance the ratio of the Raman signal to the fluorescence background”,16 the present study shows that a comparable outcome (a clean, stable, and quantitatively reliable spectrum) can be achieved with conventional Raman spectroscopy.
Conclusions
The present study systematically evaluated the impact of three sample preparation protocols: fresh (raw), macerated (ground), and decarbonated, on the reliability of Raman spectroscopy for thermal maturity assessment in carbonate-rich source rocks of two different wells from the Formação Coqueiros, using Rock-Eval pyrolysis as a definitive benchmark. Direct analysis is unreliable as the analysis of fresh (raw) cuttings is less suitable for quantitative maturity assessment; considering the samples in the present study, the analysis of fresh cuttings was not effective to differentiate the two wells, but they can provide preliminary qualitative information about the samples. The results are compromised by a combination of physical sample heterogeneity and overwhelming spectral interference (fluorescence) from the carbonate matrix.
Mechanical homogenization is insufficient, although mechanical grinding (maceration) was a necessary first step that addresses physical heterogeneity and allows for a basic qualitative distinction between maturity levels, it was insufficient on its own. Targeted chemical treatment is the critical step: the two-step procedure of mechanical grinding followed by chemical decarbonation provides the optimal results. This protocol successfully mitigates both physical and spectral issues, yielding stable, geologically coherent data that reliably reflect the maturity trends established by the Rock-Eval benchmark. In the present study, this procedure allowed a clear distinction of the two wells, in agreement with the Rock-Eval benchmark.
The present study validates a robust and accessible workflow for the use of conventional Raman spectroscopy in challenging lithologies, offering a practical alternative to more complex techniques and to more aggressive chemical treatments that risk altering the kerogen structure during the preparation of thin-section samples. Results from fresh samples across both wells indicate that Raman spectroscopy can evaluate the feasibility of analysis without prior sample pre-processing.
While the decarbonation protocol proved highly effective, complete isolation of kerogen by additional removal of silicate minerals could lead to further refinement in precision. However, such an approach must be carefully considered, as the use of more aggressive acids carries the risk of introducing structural artifacts that could alter the intrinsic properties of kerogen. Future work should focus on comparing these targeted isolation techniques to establish the ultimate balance between signal purity and preservation of the original kerogen structure.
Supplementary Information
Supplementary information is available free of charge at http://jbcs.sbq.org.br as PDF file.
Supplementary PDF
Acknowledgments
The authors gratefully acknowledge the Brazilian agencies FAPERJ, CNPq, FAPEMIG, CAPES (financing code 001), and FINEP for financial support, and ANP for providing data from wells 6-DEV-18P-RJS and 3-BP-11-RJS.
Data Availability Statement
The authors state that all data are available in the text.
References
- 1 Law, C. A. In Handbook of Petroleum Geology - Exploring for Oil and Gas Traps; Beaumont, E. A.; Foster, N. H., eds.; American Association of Petroleum Geologists: Tulsa, USA, 2000.
- 2 Mohriak, W. U. In Geologia do Brasil; Hasui, Y.; Carneiro, C. D. R.; Almeida, F. F. M.; Bartorelli, A., eds.; Beca Produções Culturais: São Paulo, Brazil, 2012.
-
3 Agência Nacional do Petróleo, Gás Natural e Biocombustíveis (ANP); Bacia de Campos - Sumário Geológico e Setores em Oferta; ANP: Rio de Janeiro, Brazil, 2017. [Link] accessed in March 2026
» Link - 4 Lamoureux-Var, V.; Bouton, N.; Espitalie, J.; Benoit, Y. In The Rock-Eval Method: Principles and Application; Baudin, F., ed.; John Wiley & Sons: Hoboken, USA, 2023.
-
5 Henry, D. G.; Jarvis, I.; Gillmore, G.; Stephenson, M.; Int. J. Coal Geol. 2019, 203, 87. [Crossref]
» Crossref -
6 Schito, A.; Spina, A.; Corrado, S.; Cirilli, S.; Romano, C.; Mar. Pet. Geol. 2019, 104, 331. [Crossref]
» Crossref -
7 Schito, A.; Corrado, S. In Application of Analytical Techniques to Petroleum Systems; Dowey, P. J.; Osborne, M.; Volk, H., eds.; The Geological Society of London: London, UK, 2020. [Link] accessed in November 2025
» Link -
8 Schmidt, J. S.; Hinrichs, R.; Araujo, C. V.; Int. J. Coal Geol. 2017, 173, 1. [Crossref]
» Crossref -
9 Almeida, D. A. L.; Marques, F. C.; Oliveira, R.; Barberes, G.; Peixoto, L. P. F.; Maia, L. F.; Feital, T. S.; Câmara, M. M.; Pinto, J. C. C. S.; Sant’ana, A. C.; Izumi, C. M. S.; Andrade, G. F. S.; Ibanez, D. M.; Dias Filho, D. C.; Menezes, T. R.; Oliveira, L. F. C.; ACS Earth Space Chem. 2025, 9, 2004. [Crossref]
» Crossref -
10 Pré-Sal Petróleo S/A; Bacia de Campos [Link] accessed in November 2025
» Link -
11 Winter, W. R.; Jahnert, R. J.; França, A. B.; Bol. Geocien. Petrobras 2007, 15, 511. [Crossref]
» Crossref -
12 Barberes, G. A.; Marques, F. C.; Almeida, D. A. L.; Peixoto, L. P. F.; Maia, L. F.; Sant’Ana, A. C.; Andrade, G. F. S.; Izumi, C. M. S.; Salgado-Campos, V.; Feital, T.; Oliveira, L. F. C.; Albuquerque, A. L.; Geosciences 2024, 14, 286. [Crossref]
» Crossref -
13 Rangel, H. D.; Martins, F. A. L.; Esteves, F. R.; Feijó, F. J.; Bol. Geocien. Petrobras 1994, 8, 203. [Crossref]
» Crossref -
14 Muniz, M. C.; Bosence, D. W. J.; Am. Assoc. Pet. Geol. Bull. 2018, 102, 2569. [Crossref]
» Crossref -
15 Barbosa, G. S.; Pena dos Reis, R.; Garcia, A. J. V.; Barberes, G. A.; Garcia, G. G.; Energies 2022, 15, 8224. [Crossref]
» Crossref -
16 Jin, Y.; Wu, S.; Gao, L.; Jiang, C.; Meng, F.; Tang, Y.; ACS Omega 2021, 6, 18504. [Crossref]
» Crossref -
17 Lamoureux-Var, V.; Rock-Eval® 7 Sulfur: Calibration and Verification; IFP Energies Nouvelles. [Link] accessed in November 2025
» Link -
18 Lin, Y.; Zhu, H.; Feng, H.; Ju, Y.; Lu, Y.; Pan, Y.; Song, C.; J. GeoEnergy 2025, 2025, 3984723. [Crossref]
» Crossref -
19 Khatibi, S.; Ostadhassan, M.; Tuschel, D.; Gentzis, T.; Carvajal Ortiz, H.; Energies 2018, 11, 1406. [Crossref]
» Crossref
Edited by
-
Editor handled this article:
Josué Carinhanha Caldas Santos (Associated)