Pereskia aculeata Leaves Valorization from the Application of Pressurized Liquid Extraction
Abstract
In this work, pressurized liquid extraction was applied to recover active compounds from ora-pro-nobis (OPN) leaves. The Box-Behnken experimental design was used to evaluate the effect of experimental variables in the extraction yield (EY) and phenolic compound yield (PCY). The extracts were analyzed for antioxidant activity, soluble protein and active compound contents. The results demonstrated that temperature and solvent polarity (SP) were significant factors in EY and PCY, while pressure did not influence the process. The experimental condition of maximum response was 100 °C, 50 bar and SP of 6.2, obtaining an EY of 21.09% and the PCY of 10.15 mgGAE g-1leaf. The extracts showed antioxidant activity, which can be attributed to the polarity of the solvent used and the nature of the compounds present in the matrix. Compounds of industrial interest were identified in the extracts (squalene, octacosanol, α-tocopherol and β-sitosterol) and the content of these compounds was influenced by the SP and these can be considered thermoresistant at 100 °C. The soluble protein content in the extracts was around 22.0% and the phenolic compound profile indicated the presence of phenolic acids, flavonoids and nicotinic acid.
Keywords:
ora-pro-nobis; phenolics compounds; antioxidant activity; pressurized liquid extraction
Introduction
Pereskia aculeata Miller is an unconventional food plant (UCFP), with a high protein content, commonly known as ora-pro-nobis (OPN), is a plant native to tropical America, easy to propagate and resistant to pests, widely distributed in Brazil. OPN leaves have balanced nutritional composition,1 fiber (39.1 wt.%), calcium and iron.2 Furthermore, it has a high protein content (28 wt.%), which makes it attractive to vegetarian and vegan consumers.3 The potential use of OPN leaves is reported to arise from the antioxidant capacity,4,5 antibiotic potential,6 antinociceptive and anti-inflammatory activity,7,8 thus allowing its use in pharmaceutical, food or cosmetic industries. Due to all these properties, OPN leaves have been highlighted in research for various purposes. The leaf flour can be used to enrich various types of foods such as breads9 and pies,10 among others. Pinto et al.11 reported that the use of gels containing the methanolic extract (ME) and the hexane fraction (HF) of OPN leaves accelerated the healing process of skin wounds in mice.
The use of natural raw materials to obtain active compounds is a worldwide trend and the application of ecologically and economically sustainable processes is a priority. In this sense, green extractions are applied to improve the use of raw materials and minimize environmental impact. Pressurized liquid extraction (PLE) is a green extraction technique that has proven to be efficient in terms of time and operational cost savings compared to conventional techniques. The use of non-toxic solvents and high extraction yields makes the use of this technique viable.12 The use of high pressures allows the use of liquid solvents at temperatures above their boiling point, which promotes better solubility and diffusion rate of target compounds, while surface tension and solvent viscosity are reduced.13 PLE performance in terms of yield and selectivity is directly affected by the factors temperature, solvent, pressure and extraction time.
The choice of solvent should be based on the polarity of the compounds of interest.14 In this sense, it is common to use solvent mixtures to maximize extraction and expand the types of compounds extracted, with the hydroalcoholic solution being the most used due to its moderate polarity and ability to extract hydrophilic and lipophilic compounds,15 benefiting the extraction of phenolic compounds.16 The temperature varies from 50 to 200 °C, this choice must consider the thermal stability of the target compounds,12 the highest value of this variable promotes the reduction of solvent viscosity, allowing the solubilization of the analytes of interest.17 The pressure used ranges from 5 to 15 MPa,15,18,19 so that the combination of high pressures and temperature reduces the extraction time and volume of required solvent, which provides recovery of compounds, in a yield similar to other techniques.14
The application of PLE to obtain extracts from OPN leaves using ethanol and water as a solvent, evaluated separately, was studied by Torres et al.,3,8,20 in which the authors evaluated the extraction yield, phenolic compound content and antioxidant activity of the extracts. Torres et al.8 evaluated the effect of temperature (50, 80 and 110 °C), keeping the other conditions fixed. Torres et al.3,20 applied the technique as a complementary step in the recovery of compounds after Soxhlet and supercritical CO2 extraction, respectively. The compilation of information obtained by these authors indicates that the use of water allows greater recovery of proteins and carbohydrates, while ethanol benefits the obtaining of phenolic compounds and the application of hydroalcoholic solutions promotes the obtaining of extracts with greater antioxidant activity.
The aim of this work was to establish the operating conditions that provide maximum extraction of active compounds from OPN leaves using the green pressurized liquid extraction (PLE) process. For this purpose, (i) the effect of the process variables (temperature, pressure and solvent polarity) was investigated, to (ii) maximize the responses (extraction and phenolic compounds yield), and (iii) the composition of the dry extract was determined. The present research presents the difference of employing a single green method evaluating unexplored variables (pressure and polarity of the solvent) to obtain compounds from OPN leaves.
Experimental
Materials
Ethanol (Dinâmica, Indaiatuba, Brazil, 99.8% purity) and reverse osmosis water (Evolution RO0310, Permutation, Curitiba, Brazil) were used in the extractions, which were mixed to obtain the extraction solvents in different polarities.
In the subsequent characterization steps, the following materials were used: ethanol (99.8% purity), Folin-Ciocalteu (Alphatec, Cotia, Brazil), sodium carbonate (Dinâmica, Indaiatuba, Brazil), gallic acid (Vetec, Duque de Caxias, Brazil), 2,2-difenil-1-picrilhidrazil (DPPH•, Sigma-Aldrich, St. Louis, USA, 95% purity), 2,2’-azinobis(3-ethylbenzothiazoline-6-sulfonic acid) diammonium salt (ABTS•+, Sigma-Aldrich, St. Louis, USA, 98% purity), (±)-6-hydroxy-2,5,7,8-tetramethylchroman-2-carboxylic acid (Sigma-Aldrich, St. Louis, USA, 97% purity), bovine albumin (Sigma-Aldrich, St. Louis, USA, 96% purity), copper sulfate (Synth, Diadema, Brazil), sodium citrate (FMaia, São José dos Campos, Brazil), sodium hydroxide (Neon, Suzano, Brazil), chromatographic standards (Sigma-Aldrich, St. Louis, USA) of squalene (99.9%, purity), octacosanol (99.9%, purity), β-sitosterol (95%, purity), α-tocopherol (99.9%, purity) and gallic acid (99.9%, purity), methanol (Supelco, Bellefonte, USA) and acetic acid (Neon, Suzano, Brazil).
Sample preparation
Pereskia aculeata Miller was cataloged at the Herbarium of the Universidade Estadual do Oeste do Paraná (Cascavel, Paraná, Brazil) under No. UNOP 10803. Leaves were collected, in Toledo (Paraná, Brazil) at coordinates 24°44’33.81” S, 53°44’57.95” W, in the morning and without direct exposure to sunlight21 and then dried at 55 °C for 72 h,22 to a moisture content of 13.18 ± 1.08 wt.%. The dried leaves were crushed in a domestic blender, sieved (20, 24, 28 and 32 mesh) and stored in a freezer (–5 °C) until use. The particle diameter of the leaves (dp = 582 μm) was determined according to Gomide.23
Pressurized-liquid extraction (PLE)
The extractions were performed as described by Santos et al.24 according to the Box-Behnken experimental design of three factors evaluated at three levels (Table 1). The range of experimental variables was chosen based on recent studies, Torres et al.8 for temperature and Raspe et al.19 for pressure and proportion between water and ethanol in the extracting solvent. In each extraction, the extractor was filled with ca. 2 g of leaves, the solvent was pumped at a flow rate of 2 mL min-1 and 10 and 15 min of static and dynamic extraction were adopted, respectively. Therefore, the ratio between leaves and solvent in each extraction was fixed at 0.06 g mL-1. The dry extract was obtained after complete removal of the solvent from the sample using rotary vacuum evaporator at 50 °C (RV 10, Ika, Deutschland, Germany). The extraction yield (EY) was calculated considering the ratio between the extract mass obtained and the initial mass of leaves (in dry basis) inserted in the extractor.
Independent variables and levels used in the Box-Behnken factorial experimental design for pressurized liquid extraction
As extraction solvent, absolute ethanol and two solutions were tested in which water was added to ethanol in proportions of 12.5 and 25.0% (v/v). The polarity of the solvent was calculated considering the weighted average of the volume fractions of the solvents (ethanol and water) and their respective polarity.25
The content of total phenolic compounds (TPC) in the dry extracts were determined, in triplicate, adopting the Folin-Ciocalteau colorimetric method26 and spectrophotometer DR-200BS-NM-BI (Kasuaki, Tokyo, Japan) at 750 nm. The phenolic compounds yield (PCY) was obtained considering the TPC in the dry extract and the E Y.
The results of the experimental planning were evaluated by analysis of variation (ANOVA), using Statistica software (version 8.0),27 for a 95% confidence interval. The Derringer desirability function was applied to determine the conditions that maximize EY and PCY. Verification experiments were conducted, in triplicate, under maximum extraction conditions and the data obtained was verified through the Student’s t-test.
Extracts characterization
The compounds present in OPN extracts were quantified by gas chromatography (GC QP2010 SE, Shimadzu, Kyoto, Japan) using flame ionization detector (FID). For analysis, the extracts were diluted in ethanol and kept at 60 °C for 15 min. The solution was filtered and then injected (1 μL) into a NA-5 capillary column (Analytical, 5% phenyl-methylsiloxane, 30 m × 0.25 mm internal diameter, 0.25 μm) at a split rate of 1:30. The initial temperature of the column was 185 °C, which was subsequently increased by 6 °C min-1 until reaching 300 °C, remaining at this temperature for 8 min. The injector and detector temperatures were maintained at 280 and 300 °C, respectively. The compounds were identified by comparing the retention time of the chromatographic standards and quantification was carried out using calibration curves obtained by injecting solutions of these at different concentrations.
The antioxidant capacity of the extracts was evaluated using the DPPH• and ABTS•+ methods proposed by Li et al.28 and UV-Vis spectrophotometer (model Spectronic 200E, Thermo Fisher Scientific, Massachusetts, USA). The extracts were diluted in ethanol and a standard curve obtained with Trolox (11.71 to 200 µmol L-1) was used.
The soluble protein content was determined as described by Lowry et al.29 after extraction conducted as reported by Wani et al.30 A calibration curve obtained from bovine albumin solutions was used and the analysis was conducted on a UV-Vis spectrophotometer.
The data obtained from the characterization of the extracts were subjected to ANOVA and the Tukey test was applied (95% confidence interval), using Statistica software.27 Multivariate analysis was performed by applying principal component analysis (PCA) using PAST software (version 4.03),31 and correlations between different parameters were considered significant at p-value < 0.05.
The analysis of the phenolic compound profile was carried out on an ultra-high performance liquid chromatograph coupled to a triple-quadrupole mass spectrometer (UHPLC-MS/MS), using a Waters ZTQD LCMS Acquity model equipped with an electrospray ionization (ESI) source, operated in positive and negative mode as described by Rodrigues et al.32 Figure S1 (presented in the Supplementary Information (SI) section) shows the UHPLC-MS/MS spectum obtained.
Results and Discussion
Establishment and analysis of predictive equations
Table 2 presents the results obtained regarding the response variables (EY and PCY) considering the different combinations of levels evaluated in the experimental planning.
Box-Behnken experimental design and results obtained in terms of extraction yield (EY) and phenolics compound yield (PCY) by pressurized liquid extraction
Table 3 presents the statistical evaluation of the results obtained through ANOVA, in which it is verified that all the parameters, except the interaction between temperature and solvent polarity, were significant in the EY. While for PCY, the terms temperature and pressure (quadratic) and the interactions between temperature and pressure, pressure and solvent polarity had no effect on this response.
Analysis of variance in the Box-Behnkhen experimental design for the response variables; extraction yield (EY) and phenolics compounds yield (PCY)
The predictive equations in terms of the coded variables were obtained, considering only the significant terms, and are presented in equations 1 and 2.
The predictive capacity of the equations was assessed using diagnostic graphs (Figures S2 and S3, SI section), which showed that the residuals have a normal distribution (Figures S2a and S3a), since the data is close to the fitted line. The graphs of predicted versus observed values (Figures S2b and S3b) demonstrate the accuracy of the experimental data (R2 > 0.98). The F-test carried out by ANOVA, after excluding the non-significant variables, indicates that the equations were able to represent the experimental data for the experimental range investigated (Fcalc > Ftab in 15 times for EY and 54 times for PCY). From these evaluations it can be seen that although the lack of fit was significant (Table 3) for E Y, the model is predictive and represents the experimental data.
Effect of experimental variables
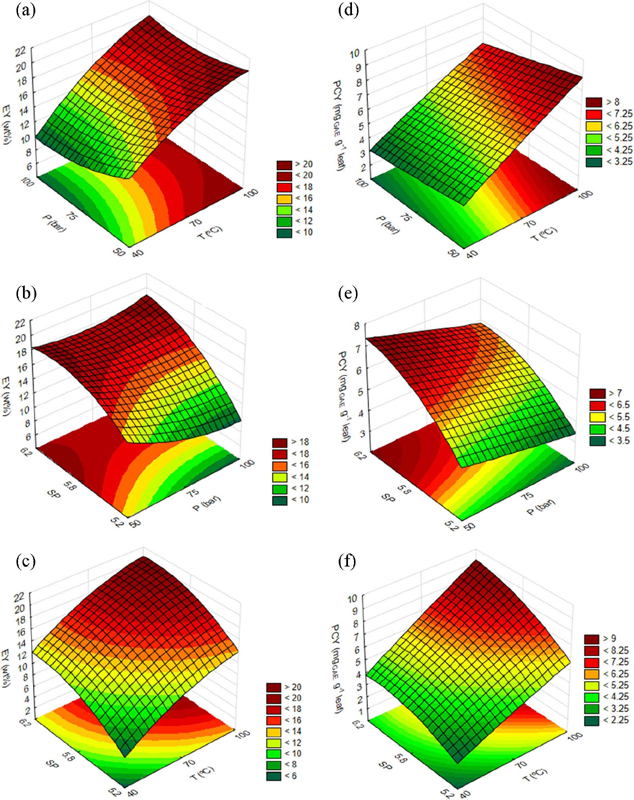
To represent the effects of the factors evaluated in the experimental planning, three-dimensional graphs were generated (Figure 1) that show the interactions between the factors and the responses (each graph is a function of two variables, keeping the third at the central point).

Response surface for pressurized liquid extraction (PLE) to obtain ora-pro-nobis leaf extract: extraction yield (EY) and phenolic compound yield (PCY). Correlative effects for EY: (a) pressure and temperature, (b) solvent polarity and pressure, (c) solvent polarity and temperature. Correlative effects for PCY: (d) pressure and temperature, (e) solvent polarity and pressure, (f) solvent polarity and temperature.
Increasing the temperature favors obtaining a greater mass of extract and therefore, the highest EY values were obtained at 100 °C, which was also observed for PCY. However, increasing the operating pressure (50 to 100 bar) did not affect the EY and PCY values. The solvent polarity factor of 6.2 and 5.8 presented the best EY and PCY results (Table 2), in addition to being a highly influential factor in the evaluated responses. Therefore, from the response surfaces (Figure 1) it was possible to identify the point of maximum EY and PCY when there was an increase in the temperature and polarity of the solvent and a decrease in pressure, allowing the extraction process to be more efficient. For EY, the interaction between T vs. P and P vs. SP was significant. For PCY, only the interaction between T vs. SP was significant. In both cases the effects were positive, indicating synergy between the variables.
Effect of temperature
Surface tension and viscosity are reduced by increasing temperature, while solvent diffusivity is increased, in turn promoting an increase in sample wetting and thus benefiting mass transfer.33 Furthermore, the desorption of compounds present in the matrix is facilitated, which results in a more complete and faster extraction.17 High temperatures may be responsible for breaking interactions due to van der Waals forces, hydrogen bonds and dipoles that occur in the solute-matrix interaction34 causing an increase in yield, as observed in the present study.
As the temperature increases, there is greater desorption of compounds from the matrix to the solvent, due to the reduction in intermolecular interactions.17 Rosa et al.33 studied the extraction of compounds from olive leaves by PLE and found that the increase from 20 to 60 °C resulted in greater solubility of the compounds present in the leaves in the solvent (0.0609 to 0.0787 g g-1 solvent). Rodrigues et al.35 evaluated the extraction of compounds from Passiflora edulis leaves using PLE and reported that increasing the temperature (80 to 100 °C) was the most influential factor in the extraction process, causing a higher extraction speed, which was verified by the slope of the line during the extraction kinetics (7.54 × 10⁻⁴ g g-1 s-1) and consequent diffusion coefficient of the process, which promoted the best results in overall yield, TPC and flavonoid content.
Effect of pressure
In the present study, pressure had less influence on EY and PCY when compared to the variables temperature and solvent polarity (Table 3), especially if the synergy between the variables (P vs. T and P vs. SP) is evaluated, which did not present a significant effect on the extraction process. Therefore, it was noted that this factor, within the evaluated range, could be used at the lowest level of experimental planning (50 bar), as it would present the best relationship in terms of cost and process control. For industrial-scale extraction, the use of lower pressures can be advantageous due to the ease of control and monitoring of the process. Therefore, they are achieved more easily and maintained with greater precision. Furthermore, PLE presents a reduced energy and economic cost when compared to other extraction techniques, being advantageous in relation to time, quantity of solvent, product recovery and waste generated.15
The effect observed for the pressure variable corroborates information available in the literature, which indicates that this variable does not directly influence the extractive process. Santos et al.36 indicate that PLE conducted at 10 MPa benefits compound recovery, as it helps the solvent to access regions that are difficult to access in the plant matrix, as well as controlling the formation of air bubbles that can occur and cause a decrease in the efficiency of the process, as the solvent would not reach the analyte. However, pressure can be a limiting factor, since its increase can interfere with the recovery of compounds of interest, as it causes compaction of the extractor bed, generating a decrease in solvent-solute contact in the pores, in addition to the formation of preferential paths, thus resulting in less lower interstitial velocity.37,38 The use of high pressures in organic solvents keeps them close to the supercritical region of the phase diagram, thus remaining in the liquid state.39 In this way, it is possible for the solvent to diffuse into the plant material, modify the dielectric constant of the solvent and also reduce the surface tension and viscosity of the solvent, facilitating mass transfer and diffusion, in addition to reducing extraction time and solvent consumption.17
Effect of solvent polarity
The highest values of EY and PCY occurred for the hydroalcoholic solution. This fact can be attributed to ethanol being polar and having low selectivity, which corroborates the extraction of other compounds such as sugars, organic acids, polyphenols, proteins and pigments,40 promoting high mass yields. The use of hydroalcoholic solutions allows the extraction of hydrophilic and lipophilic compounds,15 such as carbohydrates and phenolic compounds and fatty acids and esters, respectively.
The increase in polarity promoted by the addition of water to ethanol was indicated by Dobroslavić et al.41 as an explanation for the increase in extraction yield when compared to pure ethanol. The use of a higher water content increases the polarity of the hydroethanolic solvent, contributing to greater recovery of phenolic compounds, due to the breaking of the hydrogen bonds present in the structure of polyphenols.16 The application of water as an extracting solvent can also cause the weakening of hydrogen bonds with increasing temperature, which results in a lower dielectric constant, ranging from 80.2 at 20 °C to 55.51 at 100 °C.42
The efficiency of the extraction process is directly related to the choice of solvent. The polarity of the solvent must be close to that of the compound of interest in order for it to be released from the matrix and solubilized.43 The polarity of the solvent has synergy with the temperature, which directly influences the solubility of the target compounds, since the change in temperature modifies the dielectric constant and consequently the polarity of the solvent.44
Maximization of response variables
From the predictive equations (1 and 2) and using the desirability function, it was possible to maximize the value of the response variables, within the range evaluated for the variables. This made it possible to obtain EY of 20.41% and PCY of 9.85 mgGAE g-1leaf at 100 °C, 50 bar and solvent polarity of 6.2. The results of the verification experiments, conducted under these conditions, were 21.09 ± 0.86 wt.% for EY and 10.15 ±1.75 mgGAE g-1leaf for PCY, which show no statistical difference (p-value > 0.05) from the predicted values.
Characterization of the dry extract
For the characterization of the dry extract, in addition to the sample obtained in the maximized condition (MR), samples were selected from the application of the highest temperature, at the different pressures and solvent polarity evaluated. The results obtained are presented in Table 4 and the result of the PCA is presented in Figure 2 (as a two-dimensional scatter diagram).
Characterization of the dry extract of ora-pro-nobis leaf obtained from pressurized liquid extraction

Principal component analysis of characterization data of extracts obtained under different experimental conditions. Nomenclature as shown in Table 4.
The two principal components (PC) explained 78.29% of the data variability, with PC1 being responsible for 52.83% of the total data variance, being mainly associated with octacosanol, ABTS•+ and TPC, while PC2 (25.46%) was mainly associated with DPPH•. The Pearson coefficient (Table S1, SI section) was determined to evaluate the level of correlation between the evaluated properties. The vectors that showed a strong correlation with each other, Pearson’s coefficient r > 0.90, were TPC and ABTS•+, squalene and TPC, squalene and ABTS•+ and, finally, soluble protein and octacosanol. However, only the correlation between TPC and ABTS•+ was positive. The other vectors showed no significant correlation.
Polyphenols play a significant role in the antioxidant activity of plants due to their redox properties,45 which was confirmed in this study, by PCA and Pearson’s coefficient, the existence of a strong correlation between TPC and ABTS•+ (r > 0.90). With regard to the TPC and DPPH• properties, the increase in pressure from 50 to 75 bar did not influence the values obtained, as well as for the three SP levels evaluated. However, when increasing the pressure to 100 bar, these variables decreased. For antioxidant activity by ABTS•+, the use of high pressure (100 bar) and the combination of low pressure (50 bar) with a higher polarity solvent (6.2) resulted in a lower content compared to the other conditions evaluated. The moderate polarity of the hydroalcoholic solvent, compared to pure ethanol, benefits the extraction of active compounds, due to the increase in their solubility in the solvent, from simple carbon chains to polyphenols.46 Given the results of the influence of the SP variable, the impact of the choice of solvent on the extraction process is evident, since polarity directly influences the selectivity, and therefore, the chemical composition of the extract. Costa et al.47 studied the PLE of coffee bean husk compounds and noted that when using 60 °C, a solvent ratio of 45 mL g-1 and a 50% hydroalcoholic solvent (polarity 7.1) instead of ethanol, there was a 397% increase in the recovery of antioxidants. Rodrigues et al.35 evaluated the PLE of compounds from the leaves of Passiflora edulis using 70% ethanol (SP 6.3) at 100 °C and obtained 71.9% inhibition of DPPH•. Cruz et al.,4 in their study, obtained extracts from the leaf of OPN at 45 °C and reported an increase of 278% in the DPPH• antioxidant activity when using 50% ethanol (SP 7.1) instead of pure ethanol (SP 5.2).
Macedo et al.5 carried out the extraction of compounds from OPN leaves using ethanol and obtained extracts with 2.14 mgGAE g-1extract of TPC and antioxidant activity of 9.00 µMTE g-1extract and 28.22 µMTE g-1extract by the methods of ABTS•+ and DPPH•, respectively. Torres et al.3 employed PLE to obtain compounds from OPN leaves using ethanol and obtained 62 mgGAE g-1extract of TPC and 1642 µg mL-1 and 436 µMTE g-1extract of antioxidant activity by DPPH• (half maximal inhibitory concentration, IC50) and ABTS•+, respectively, while Torres et al.8 reported 60.09 mgGAE g-1extract of TPC and 1.64 mg mL-1 of antioxidant activity (DPPH•) in the OPN extracts obtained by PLE using ethanol. Variations in the content of phenolic compounds and antioxidant activity can be attributed to the climate, cultivation, stage of maturity and genetics of the plant, while drying techniques and experimental extraction conditions also affect the recovery of compounds.48,49
The OPN extracts had squalene, octacosanol and α-tocopherol in their composition (Table 4). The intermediate (5.8) and higher (6.2) solvent polarity together with the pressure of 100 and 50 bar, respectively, resulted in an extract with a higher squalene content. Octacosanol showed higher content when using solvent with SP 5.8 and 5.2 and pressure of 50 and 75 bar. However, the highest content of α-tocopherol was detected in the sample obtained by applying the solvent with SP 5.2 and intermediate pressure (75 bar). The analyzed compounds showed a greater affinity for solvents of low and medium polarity (5.2 and 5.8), except for squalene, which presented a higher content in intermediate level polarity (5.8) and higher (6.2), possibly due to its molecular structure. Compounds that are highly hydroxylated, those that have in their structure the presence of the hydroxyl functional group (–OH), such as α-tocopherol for example, are usually soluble in water, pure alcohols and hydroalcoholics, while highly methoxylated compounds are extracted in less polar solvents, such as ethyl acetate, acetone and chloroform.50,51,52 The compounds quantified in the present study have more nonpolar molecular structures, therefore, their recovery is benefited when using low and medium polarity solvents.
There is great commercial interest in new sources of squalene, as this compound is mainly obtained from shark liver oil. Due to its emollient and antioxidant properties, squalene is used in cosmetics,53 in addition to being an important adjuvant used in vaccines.54 The presence of squalene in OPN extract obtained by Soxhlet and supercritical fluid extraction (CO2) was verified by Torres et al.8 with area peaks of 1.48 × 10⁶ and 5.27 × 10⁶, respectively. The presence of squalene in the extracts makes them viable for consumption considering the detoxifying function that this compound presents, in addition to acting as a purifier of xenobiotic substances in the human body and being indicated for reducing cholesterol.55
Tocopherols are considered the antioxidant compounds most efficiently absorbed by humans56 and α-tocopherol has already been identified in extracts from OPN leaves. Barreira et al.57 obtained a content of 40 mg 100 g-1extract and Torres et al.8 identified the presence of the compound in OPN extracts obtained by Soxhlet and supercritical CO2 extraction.
Octacosanol stood out for its high content compared to the other compounds analyzed and studies have shown that this compound can be used for the purpose of cholesterollowering effect, cytoprotective use,58 as well as to improve insomnia caused by stress,59 and has been reported as an effective treatment for Parkinson’s disease.60
The extracts also presented a composition rich in β-sitosterol and in general the experimental conditions did not influence the content of this compound in the extract, except for the extract obtained at 50 bar and SP 5.8 (assay 2), which presented a lower content. This may have occurred due to the presence of the hydroxyl group in its structure, which has greater affinity for pure alcohols or water,52 thus the hydroalcoholic solution of medium polarity combined at low pressure did not favor the extraction of this compound. β-Sitosterol is associated with numerous benefits, such as anxiolytic and sedative effects, analgesics, immunomodulators, antimicrobials, anticancer, anti-inflammatory, antioxidant and antidiabetic activities.61 Maciel et al.62 obtained OPN extracts by maceration with the presence of β-sitosterol (normative area of 27.6%) in the composition and attributed the antiglycating activity present in the samples to this compound. Pinto et al.63 also determined β-sitosterol (normative area of 24.66%) in the composition of OPN extracts.
The soluble protein content (20.80 to 23.69 wt.%) was not influenced by the different experimental conditions evaluated. This effect may be related to the interaction of the molecular structure of the proteins with the solvents used and the extraction pressure used, as these factors within the range evaluated may have caused the proteins to denature, making them insoluble.64 Cruz et al.4 obtained OPN extracts and noted that the use of hydroalcoholic solvent benefited the extraction of soluble proteins in the extract compared to pure ethanol. Torres et al.3 obtained soluble protein content of 2.2 wt.% in OPN extracts by pressurized sequential methods (PLE) using ethanol and water as solvent. The same authors attribute the greater extraction of proteins to the use of water as a solvent in the extraction. The difference between the soluble protein levels reported in the present study and in the literature can be attributed mainly to the polarity of the solvent used, that is, the mixture of water and ethanol, which benefited the extraction of proteins.
The chemical composition of the OPN extracts in this study presented compounds of broad commercial interest and the choice of the best experimental condition must be based on the operational cost, that is, amount spent on solvent, energy cost, in addition to the level of ease of operational control of the process. However, the desired composition of the extract also influences this choice. In this sense, evaluating the best cost-benefit for the production of the extract, aiming for the highest possible content of TPC, DPPH•, ABTS•+ and octacosanol, the extract obtained at 100 °C, 50 bar and SP 5.8 would be ideal. However, if the intention is to produce an extract that has a higher content of squalene and β-sitosterol, the parameters used must be 100 °C, 50 bar and SP 6.2, a condition that differs from the previous one only in the octacosanol content and ABTS•+ value. The two conditions mentioned produce extracts with similar EY, as well as soluble protein and α-tocopherol content. Both experimental conditions use low pressure (50 bar), the change in composition occurred as a result of the change in the polarity of the solvent (5.8 and 6.2) and it is worth noting that the addition of water to ethanol allows for a reduction in production costs to the detriment of the use of ethanol pure.
Thus, the extracts obtained at 100 °C, 50 bar with SP 5.8 (assay 2) and 6.2 (MR) were analyzed in order to determine the profile of phenolic compounds recovered from OPN leaves (Table 5), which was similar between these two samples.
Phenolic compounds identified in the dry extract obtained from pressurized liquid extraction using UHPLC-MS/MS. Values per sample concentration (intensity/1.00 × 105)
Twelve phenolic compounds were determined in the analyzed OPN extracts, with phenolic acids being the major group detected. Phenolic acids are polar compounds, which explains why they presented higher recovery due to the solvent used and their polarity. Among the compounds evaluated, some have already been reported in OPN extracts by Macedo et al.,5 such as malic, ferulic, caffeic acids and rutin. The presence of nicotinic acid (NiAc) had not yet been reported in other studies of OPN extracts. This compound is used to reduce low-density lipoprotein (LDL) cholesterol levels and increase high-density lipoprotein (HDL) levels, and is used to treat dyslipidemia and prevent atherosclerosis.65 Rutin, a flavonol also reported in this extract, is considered a substance that has antioxidant and anticancer potential, in addition, it has protective effects on the renal, cardiovascular and hepatic systems.66 Caffeic and chlorogenic acids have cardioprotective and antioxidant effects.67
Conclusions
The present study suggests the use of the green extraction (PLE) method to extract active compounds from OPN leaves. The factors temperature and polarity of the solvent were those that most influenced the extraction yield and yield of phenolic compounds. The extracts presented a quality composition, with a high content of active compounds with wide industrial application. The polarity of the solvent was also a relevant factor for the phytochemical composition of the extracts, as it directly impacted the extracted compounds. On the other hand, the extracts presented similar soluble protein levels under the different experimental conditions applied. The best experimental condition was defined considering the desired composition of the extract, operational costs and ease of process control. In this sense, two experimental conditions are the most appropriate, in both conditions, the extractions showed similar yield (21.09 wt.%), as well as the content of soluble protein and α-tocopherol in the extracts, as did the phenolic compound profile. Therefore, extraction must occur at 100 °C and 50 bar, the polarity of the solvent must be chosen based on the desired composition. For extracts with a higher content of antioxidant activity (137.15 µmolTE g-1extract) and octacosanol (1851.00 mg 100 g-1extract), SP 5.8 is recommended, however, for extracts containing a higher content of squalene (95.03 mg 100 g-1extract) and β-sitosterol (421.66 mg 100 g-1extract), SP 6.2 should be used. Due to the compounds present in the extracts, they are as a potential source for application as adjuvants in vaccines, antioxidants in foods and cosmetics, as well as supplements for protein supply.
Supplementary Information
Supplementary information (generated diagnostic graphs and Pearson coefficient, Figures S1-S3 and Table S1) is available free of charge at http://jbcs.sbq.org.br as PDF file.
Acknowledgments
This study was financed by the Conselho Nacional de Desenvolvimento Científico e Tecnológico (CNPQ, process number 168181/2022-3) and Fundação Araucária (agreement 062/2023 - PDI) and CAPES (Coordenação de Aperfeiçoamento de Pessoal de Nível Superior/ Process 88887.658985/2021-00). The authors also thank the Universidade Estadual de Maringá and Universidade Estadual do Oeste do Paraná by the support to this research development.
References
-
1 Pinto, N. C. C.; Scio, E.; Plant Foods Hum. Nutr. 2014, 69, 189. [Crossref]
» Crossref -
2 Takeiti, C. Y.; Antonio, G. C.; Motta, E. M. P.; Collares-Queiroz, F. P.; Park, K. J.; Int. J. Food Sci. Nutr. 2009, 60, 148. [Crossref]
» Crossref -
3 Torres, T. M. S.; Guedes, J. A. C.; de Brito, E. S.; Mazzutti, S.; Ferreira, S. R. S.; J. Supercrit. Fluids 2022, 181, 105514. [Crossref]
» Crossref -
4 Cruz, T. M.; Santos, J. S.; do Carmo, M. A. V.; Hellström, J.; Pihlava, J. M.; Azevedo, L.; Granato, D.; Marques, M. B.; Food Chem. 2021, 361, 130078. [Crossref]
» Crossref -
5 Macedo, M. C. C.; Silva, V. D. M.; Serafim, M. S. M.; Correia, V. T. V.; Pereira, D. T. V.; Amante, P. R.; da Silva, A. S. J.; Mendonça, H. O. P.; Augusti, R.; de Paula, A. C. C. F. F.; Melo, J. O. F.; Pires, C. V.; Fante, C. A.; Metabolites 2023, 13, 691. [Crossref]
» Crossref -
6 Garcia, J. A. A.; Corrêa, R. C. G.; Barros, L.; Pereira, C.; Abreu, R. M. V.; Alves, M. J.; Calhelha, R. C.; Bracht, A.; Peralta, R. M.; Ferreira, I. C. F. R.; Food Chem. 2019, 294, 302. [Crossref]
» Crossref -
7 Pinto, N. C. C.; Machado, D. C.; da Silva, J. M.; Conegundes, J. L. M.; Gualberto, A. C. M.; Gameiro, J.; Chedier, L. M.; Castañon, M. C. M. N.; Scio, E.; J. Ethnopharmacol. 2015, 173, 330. [Crossref]
» Crossref -
8 Torres, T. M. S.; Álvarez-Rivera, G.; Mazzutti, S.; Sánchez-Martínez, J. D.; Cifuentes, A.; Ibáñez, E.; Ferreira, S. R. S.; J. Supercrit. Fluids 2021, 179, 105390. [Crossref]
» Crossref -
9 Izzo, S.; Domene, S. M. A.; Demetra 2021, 16, e53372. [Crossref]
» Crossref -
10 Rosa, L.; Queiroz, C. R. A. D. A.; Melo, C. M. T.; Biosci. J. 2020, 36, 376. [Crossref]
» Crossref -
11 Pinto, N. C. C.; Cassini-Vieira, P.; Fagundes, E. M. S.; Barcelos, L. S.; Castañon, M. C. M. N.; Scio, E.; J. Ethnopharmacol. 2016, 194, 131. [Crossref]
» Crossref -
12 Perez-Vazquez, A.; Carpena, M.; Barciela, P.; Cassani, L.; Simal-Gandara, J.; Prieto, M. A.; Antioxidants 2023, 12, 612. [Crossref]
» Crossref -
13 Mustafa, A.; Turner, C.; Anal. Chim. Acta 2011, 703, 8. [Crossref]
» Crossref -
14 Nieto, A.; Borrull, F.; Pocurull, E.; Marcé, R. M.; TrAC, Trends Anal. Chem. 2010, 29, 752. [Crossref]
» Crossref -
15 Hirondart, M.; Rombaut, N.; Tixier, A. S. F.; Bily, A.; Chemat, F.; Foods 2020, 9, 584. [Crossref]
» Crossref - 16 Khan, M. K.; Paniwnyk, L.; Hassan, S. In Plant Based “Green Chemistry 2.0”; Li, Y.; Chemat, F., eds.; Springer: Singapore, 2019, ch. 8.
- 17 Alvarez-Rivera, G.; Bueno, M.; Ballesteros-Vivas, D.; Mendiola, J. A.; Ibañez, E. In Liquid-Phase Extraction; Poole, F. C., ed.; Elsevier: Avignon, FR, 2019, ch. 13.
-
18 Frohlich, P. C.; Santos, K. A.; Ascari, J.; Refati, J. R. S.; Palú, F.; Cardozo Filho, L.; da Silva, E. A.; J. Supercrit. Fluids 2023, 196, 105865. [Crossref]
» Crossref -
19 Raspe, D. T.; da Silva, C.; da Costa, S. C.; J. Supercrit. Fluids 2023, 193, 105813. [Crossref]
» Crossref -
20 Torres, T. M. S.; Mendiola, J. A.; Álvarez-Rivera, G.; Mazzutti, S.; Ibáñez, E.; Cifuentes, A.; Ferreira, S. R. S.; Innovative Food Sci. Emerging Technol. 2022, 76, 102926. [Crossref]
» Crossref - 21 Rodrigues, V. G. S.; Cultivo, Uso e Manipulação de Plantas Medicinais, 1st ed.; Embrapa Rondônia: Porto Velho, 2004.
- 22 Association of Official Analytical Chemistry (AOAC); Official Methods of Analysis, 20th ed.; Rockville: Maryland, USA, 2016, ch. 39.
-
23 Gomide, R.; Operações Unitárias, 1º Volume: Operações com Sistemas Sólidos Granulares, edição do autor; Câmara Brasileira do Livro: São Paulo, 1983. [Link] accessed in February 2025
» Link -
24 Santos, K. A.; Klein, E. J.; da Silva, C.; da Silva, E. A.; Cardozo Filho, L.; J. Supercrit. Fluids 2019, 150, 30. [Crossref]
» Crossref - 25 Lide, D. R.; CRC Handbook of Chemistry and Physics, 73rd ed.; CRC Press: Boca Raton, FL, 1992.
-
26 Bobo-García, G.; Davidov-Pardo, G.; Arroqui, C.; Vírseda, P.; Marín-Arroyo, M. R.; Navarro, M.; J. Sci. Food Agric. 2015, 95, 204. [Crossref]
» Crossref - 27 Statistica, version 8.0; StatSoft Inc., Tulsa, OK, USA, 2011.
-
28 Li, Z.; Lan, Y.; Miao, J.; Chen, X.; Chen, B.; Liu, G.; Wu, X.; Zhu, X.; Cao, Y.; Food Biosci. 2021, 41, 100933. [Crossref]
» Crossref -
29 Lowry, O. H.; Rosebrough, N. J.; Farr, A. L.; Randall, R. J.; J. Biol. Chem. 1951, 193, 265. [Link] accessed in February 2025
» Link -
30 Wani, A.; Sogi, D. S.; Grover, L.; Saxena, D. C.; Biosyst. Eng. 2006, 94, 67. [Crossref]
» Crossref - 31 Hammer, Ø.; Harper, D. A. T.; Ryan, P. D.; PAST: Paleontological Statistics, version 4.03; Natural History Museum, University of Oslo, Oslo, Norway, 2020.
-
32 Rodrigues, C. A.; Zomer, A. P. L.; Rotta, E. M.; Visentainer, J. V.; Maldaner, L.; J. Food Compos. Anal. 2022, 112, 104647. [Crossref]
» Crossref -
33 Rosa, A. D.; Junges, A.; Fernandes, I. A.; Cansian, R. L.; Corazza, M. L.; Franceschi, E.; Backes, G. T.; Valduga, E.; J. Food Sci. Technol. 2019, 56, 3864. [Crossref]
» Crossref -
34 Herrero, M.; Castro-Puyana, M.; Mendiola, J. A.; Ibañez, E.; TrAC, Trends Anal. Chem. 2013, 43, 67. [Crossref]
» Crossref -
35 Rodrigues, L. C.; Bodini, R. B.; Caneppele, F. L.; Dacanal, G. C.; Crevelin, E. J.; de Moraes, L. A. B.; de Oliveira, A. L.; Processes 2023, 11, 2308. [Crossref]
» Crossref -
36 Santos, P. H.; Kammers, J. C.; Silva, A. P.; Oliveira, J. V.; Hense, H.; Food Chem. 2021, 344, 128620. [Crossref]
» Crossref -
37 Náthia-Neves, G.; Tarone, A. G.; Tosi, M. M.; Maróstica Jr., M. R.; Meireles, M. A. A.; Food Res. Int. 2017, 102, 595. [Crossref]
» Crossref -
38 Osorio-Tobón, J. F.; Meireles, M. A. A.; Food Public Health 2013, 3, 289. [Link] accessed in February 2025
» Link -
39 Kitrytė, V.; Kavaliauskaitė, A.; Tamkutė, L.; Pukalskienė, M.; Syrpas, M.; Venskutonis, P. R,; Food Chem. 2020, 322, 126767. [Crossref]
» Crossref -
40 Efthymiopoulos, I.; Hellier, P.; Ladommatos, N.; Eveleigh, A.; Mills-Lamptey, B.; Detritus 2019, 5, 75. [Link] accessed in February 2025
» Link -
41 Dobroslavić, E.; Garofulić, I. E.; Šeparović, J.; Zorić, Z.; Pedisić, S.; Dragović-Uzelac, V.; Molecules 2022, 27, 5099. [Crossref]
» Crossref -
42 Matweb, https://www.matweb.com/search/DataSheet.aspx?MatGUID=64a0e072a9ec430e92ed984c7131b690&ckck=1, accessed in February 2025.
» https://www.matweb.com/search/DataSheet.aspx?MatGUID=64a0e072a9ec430e92ed984c7131b690&ckck=1 -
43 Barp, L.; Višnjevec, A. M.; Moret, S.; Foods 2023, 12, 2017. [Crossref]
» Crossref -
44 Getachew, A. T.; Holdt, S. L.; Meyer, A. S.; Jacobsen, C.; Mar. Drugs 2022, 20, 263. [Crossref]
» Crossref -
45 Chaabani, E.; Vian, M. A.; Rebey, I. B.; Bourgou, S.; Zar Kalai, F.; Chemat, F.; Ksouri, R.; J. Food Meas. Charact. 2023, 17, 4705. [Crossref]
» Crossref -
46 Machado, A. P. D. F.; Pereira, A. L. D.; Barbero, G. F.; Martínez, J.; Food Chem. 2017, 231, 1. [Crossref]
» Crossref -
47 Costa, A. J. N.; Stevanato, N.; Raspe, D. T.; Cardozo Filho, L.; da Silva, C.; J. Chem. Technol. Biotechnol. 2024, 99, 788. [Crossref]
» Crossref -
48 Chemat, F.; Rombaut, N.; Sicaire, A. G.; Meullemiestre, A.; Tixier, A. S. F.; Vian, M. A.; Ultrason. Sonochem. 2017, 34, 540. [Crossref]
» Crossref -
49 Wang, L.; Weller, C. L.; Trends Food Sci. Technol. 2006, 17, 300. [Crossref]
» Crossref -
50 Lafka, T. I.; Sinanoglou, V.; Lazos, E. S.; Food Chem. 2007, 104, 1206. [Crossref]
» Crossref -
51 Dorta, E.; Lobo, M. G.; Gonzalez, M.; J. Food Sci. 2012, 77, c80. [Crossref]
» Crossref -
52 Kaczorová, D.; Karalija, E.; Dahija, S.; Bešta-Gajević, R.; Parić, A.; Zeljković, S. C.; Molecules 2021, 26, 1601. [Crossref]
» Crossref -
53 Huang, Z. R.; Lin, Y. K.; Fang, J. Y.; Molecules 2009, 14, 540. [Crossref]
» Crossref -
54 Calabro, S.; Tortoli, M.; Baudner, B. C.; Pacitto, A.; Cortese, M.; O’Hagan, D. T.; de Gregorio, E.; Seubert, A.; Wack, A.; Vaccine 2011, 29, 1812. [Crossref]
» Crossref -
55 Lozano-Grande, M. A.; Gorinstein, S.; Espitia-Rangel, E.; Dávila-Ortiz, G.; Martínez-Ayala, A. L.; Int. J. Agron. 2018, 2018, 829160. [Crossref]
» Crossref -
56 Shahidi, F.; de Camargo, A. C.; Int. J. Mol. Sci. 2016, 17, 1745. [Crossref]
» Crossref -
57 Barreira, T. F.; de Paula Filho, G. X.; Priore, S. E.; Santos, R. H. S.; Pinheiro-Sant’ana, H. M.; Food Sci. Technol. 2021, 41, 47. [Crossref]
» Crossref -
58 Taylor, J. C.; Rapport, L.; Lockwood, G. B.; Nutrition 2003, 19, 192. [Crossref]
» Crossref -
59 Kaushik, M. K.; Aritake, K.; Takeuchi, A.; Yanagisawa, M.; Urade, Y.; Sci. Rep. 2017, 7, 8892. [Crossref]
» Crossref -
60 Wang, T.; Liu, Y.; Yang, N.; Ji, C.; Chan, P.; Zuo, P.; Neural Regener. Res. 2012, 7, 1080. [Crossref]
» Crossref -
61 Babu, S.; Jayaraman, S.; Biomed. Pharmacother. 2020, 131, 110702. [Crossref]
» Crossref -
62 Maciel, M. S. F.; Freitas, P. H. S.; Almeida, M. A.; Silva, N. P.; Tavares, G. D.; Costa, J. C.; Scio, E.; Braz. J. Health Pharm. 2023, 5, 1. [Crossref]
» Crossref -
63 Pinto, N. C. C.; Maciel, M. S. F.; Rezende, N. S.; Duque, A. P. N.; Mendes, R. F.; da Silva, J. B.; Evangelista, M. R.; Monteiro, L. C.; da Silva, J. M.; da Costa, J. C.; Scio, E.; J. Pharm. Pharmacol. 2020, 72, 1933. [Crossref]
» Crossref -
64 Grossmann, L.; McClements, D. J.; Food Hydrocolloids 2023, 137, 108416. [Crossref]
» Crossref -
65 Szafarz, M.; Lomnicka, M.; Sternak, M.; Chlopicki, S.; Szymura-Oleksiak, J.; J. Chromatogr. B: Anal. Technol. Biomed. Life Sci. 2010, 878, 895. [Crossref]
» Crossref -
66 Enogieru, A. B.; Haylett, W.; Hiss, D. C.; Bardien, S.; Ekpo, O. E.; Oxid. Med. Cell. Longevity 2018, 2018, 241017. [Crossref]
» Crossref -
67 Agunloye, O. M.; Oboh, G.; Ademiluyi, A. O.; Ademosun, A. O.; Akindahunsi, A. A.; Oyagbemi, A. A.; Omobowale, T. O.; Ajibade, T. O.; Adedapo, A. A.; Biomed. Pharmacother. 2019, 109, 450. [Crossref]
» Crossref
Edited by
-
Editor handled this article:
Paulo Cezar Vieira (Associate)