 Characterization of Air Traffic Performance in Terminal Airspace with Point Merge at São Paulo/Guarulhos International Airport
ABSTRACT
Advancing Air Traffic Management with the implementation of novel airspace structures, systems and procedures is crucial to enhancing the economic and environmental performance of aviation. This requires a solid understanding of operational performance through advanced data analysis. In this paper, large-scale historical aircraft tracking data and aeronautical information data are used to characterize the performance of terminal area operations at São Paulo/Guarulhos International Airport (SBGR) after the most recent airspace redesign, known as TMA-SP Neo. A key aspect of the TMA-SP Neo project was redesigning the SBGR arrival procedures with a Point Merge (PM) system, an innovative operational concept for terminal area traffic management. A trajectory classification approach is developed to identify the use of arrival procedures and several performance indicators are proposed to evaluate the actual utilization of the terminal airspace structure with PM and to quantify trajectory efficiency and conformance. The results reveal an uneven distribution of air traffic across arrival gates and types of procedures and a significant utilization of the novel PM structure for delay absorption during the sequencing process. The findings also highlight air traffic control preferences and opportunities for further improvements in delay management.
Keywords
Air traffic management; Terminal area operations; Sequencing methods; Trajectory analysis; Data analysis
INTRODUCTION
Globally, initiatives to modernize Air Traffic Management (ATM) systems are advancing, incorporating novel technologies, systems, and procedures to handle anticipated increases in air traffic volume and diversity. In the Global Air Navigation Plan, the International Civil Aviation Organization (ICAO) outlines a systematic framework (known as Aviation System Block Upgrades [ASBU]) for the ATM system modernization and proposes a performance-based approach to identify improvement areas, prioritize investments, and measure the impacts of new solutions (ICAO, 2019). To this goal, several key performance indicators (KPIs) have been proposed to help quantify, analyze and improve the economic, operational and environmental performance of ATM. Operational performance is a major focus, with various KPIs evaluating the safety, efficiency, and predictability of flight operations across multiple phases and airspace regions (ICAO, 2024).
A region of airspace that poses challenges for operational performance management is the Terminal Maneuvering Area (TMA). The TMA (often referred to as terminal airspace) is the designated controlled airspace where aircraft are guided during critical phases of flight, such as arrival and departure. The high density and complexity of terminal operations, constrained by airport and airspace capacity, frequently lead to inefficiencies that impact system-level performance. To continuously improve the performance of flight operations during these complex flight phases, the terminal airspace is often redesigned, introducing novel concepts and operational procedures. One example is the Point Merge (PM) system, an innovative operational concept for managing arrival flows developed by the EUROCONTROL Experimental Center in 2006 (EUROCONTROL, 2021). As one of ICAO’s ASBU components, it has been implemented in more than 30 airports worldwide. In Brazil, this concept was introduced in the structure of arrival procedures at São Paulo/Guarulhos International Airport (SBGR) with the major redesign of the São Paulo terminal area (known as TMA-SP Neo) implemented in 2021 by the Brazilian Department of Airspace Control (Departamento de Controle do Espaço Aéreo [DECEA, 2021]). Despite being a standard procedure, each implementation of a PM system is unique, tailored to the traffic flow patterns of each particular airport, requiring a thorough analysis of the resulting operational performance towards continued system improvement.
In this work, historical aircraft tracking data and aeronautical information data are combined to perform a detailed characterization of air traffic performance in terminal airspace under PM operations at SBGR. First, a flight trajectory classification approach is developed to evaluate the actual use of the terminal airspace structure by arrival flights. Then, the air traffic performance is quantified using standard KPIs recommended by ICAO as well as novel indicators proposed to evaluate the PM system utilization and the level of conformance of flight operations. The results contribute to a better understanding of flight trajectory behavior and performance in the terminal area under PM operations, highlighting air traffic control preferences and opportunities for further operational improvements.
LITERATURE REVIEW
Extensive previous research has delved into quantifying and analyzing air traffic operational performance, offering key insights into its influencing factors, pinpointing areas for improvement, and informing decision-making. Gulding et al. (2010) used operational databases from the United States and Europe and presented indicators to assess efficiency, punctuality, and predictability across different phases of flight. Leones et al. (2018) also proposed indicators to capture the different perspectives of ATM performance, considering factors like fuel consumption, schedule adherence, sector capacity, and environmental impact. Zhang et al. (2018) proposed a sector capacity assessment method based on airspace utilization efficiency, rather than air traffic controller workload. Their research aimed at creating indicators such as flight miles in the sector per hour to help build up the correlation between airspace efficiency and dense air traffic flow. Babinski et al. (2024) proposed an indicator matrix to assess the perception of safety following airspace modifications, verifying whether the operational performance indicators intended in the conception of a new air circulation presented a favorable scenario and advancement in relation to the old structure, and how these indicators were perceived by professionals and experts after its implementation. Sampaio et al. (2022) discussed air traffic control strategies and the influence of human factors on aviation safety, emphasizing that operational decisions should take into account both technical variables and the subjective perceptions of those involved.
Given the density and complexity of the terminal area, many studies have focused on the analysis of operational performance for this particular airspace. Polishchuk and Smetanova (2023) performed a comprehensive quantitative assessment of arrival operations within TMAs, using historical flight data from several European airports to propose and validate new performance metrics. Lemetti et al. (2019) evaluated flight performance for arrivals at Stockholm Arlanda Airport, using indicators of punctuality and fuel consumption, concluding that deviations from flight plans are a major cause of arrival delays and additional fuel burn. Inefficient vertical profiles during descent led to significant fuel waste, emphasizing the need for optimized continuous descent operations (CDO). Murça et al. (2018) performed a detailed comparative analysis of terminal airspace design, utilization and performance for the New York, São Paulo, and Hong Kong multi-airport systems, investigating how differences in airspace structure and operational procedures impact efficiency, capacity, and predictability. Zanin (2020) and Pasutto et al. (2020) analyzed trajectories of aircraft arriving at large European airports, highlighting a high variability in performance across airports and within operations at the same airport.
Few studies have specifically analyzed the actual performance of terminal area operations with PM procedures. Hardell et al. (2023b) utilized open-source ADS-B data to measure the use of PM sequencing procedures at seven airports worldwide. Their analysis revealed that the arcs are underused at most airports, suggesting that PM systems could handle greater traffic volumes. In a separate study, Hardell et al. (2023a) employed ADS-B data to evaluate the performance of PM implementation at Oslo Gardermoen Airport, comparing various metrics for flights that did and did not use PM. Mutlu (2021) assessed the impact of the 2018 redesign of the Istanbul terminal area, which introduced a PM system, on airspace complexity and safety.
This study contributes to the literature with a detailed characterization of air traffic performance in terminal airspace with PM procedures for SBGR arrivals after the TMA-SP redesign implemented in 2021. As mentioned before, each airspace redesign and implementation of a PM system is unique, requiring thorough evaluation for continued operational improvement. Moreover, novel indicators are proposed to evaluate the utilization of the airspace and the level of conformance of flight operations to standard procedures. While trajectory conformance (TC) is a fundamental aspect of predictability analysis, it has not been considered in previous studies, which focus on other key performance areas such as efficiency.
METHODOLOGY
This section describes the methodological approach, detailing the case study, the datasets used and related preprocessing procedures, the trajectory classification approach developed for terminal airspace utilization evaluation and the performance indicators developed for operational performance analysis.
Case study
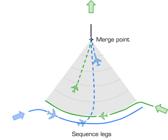
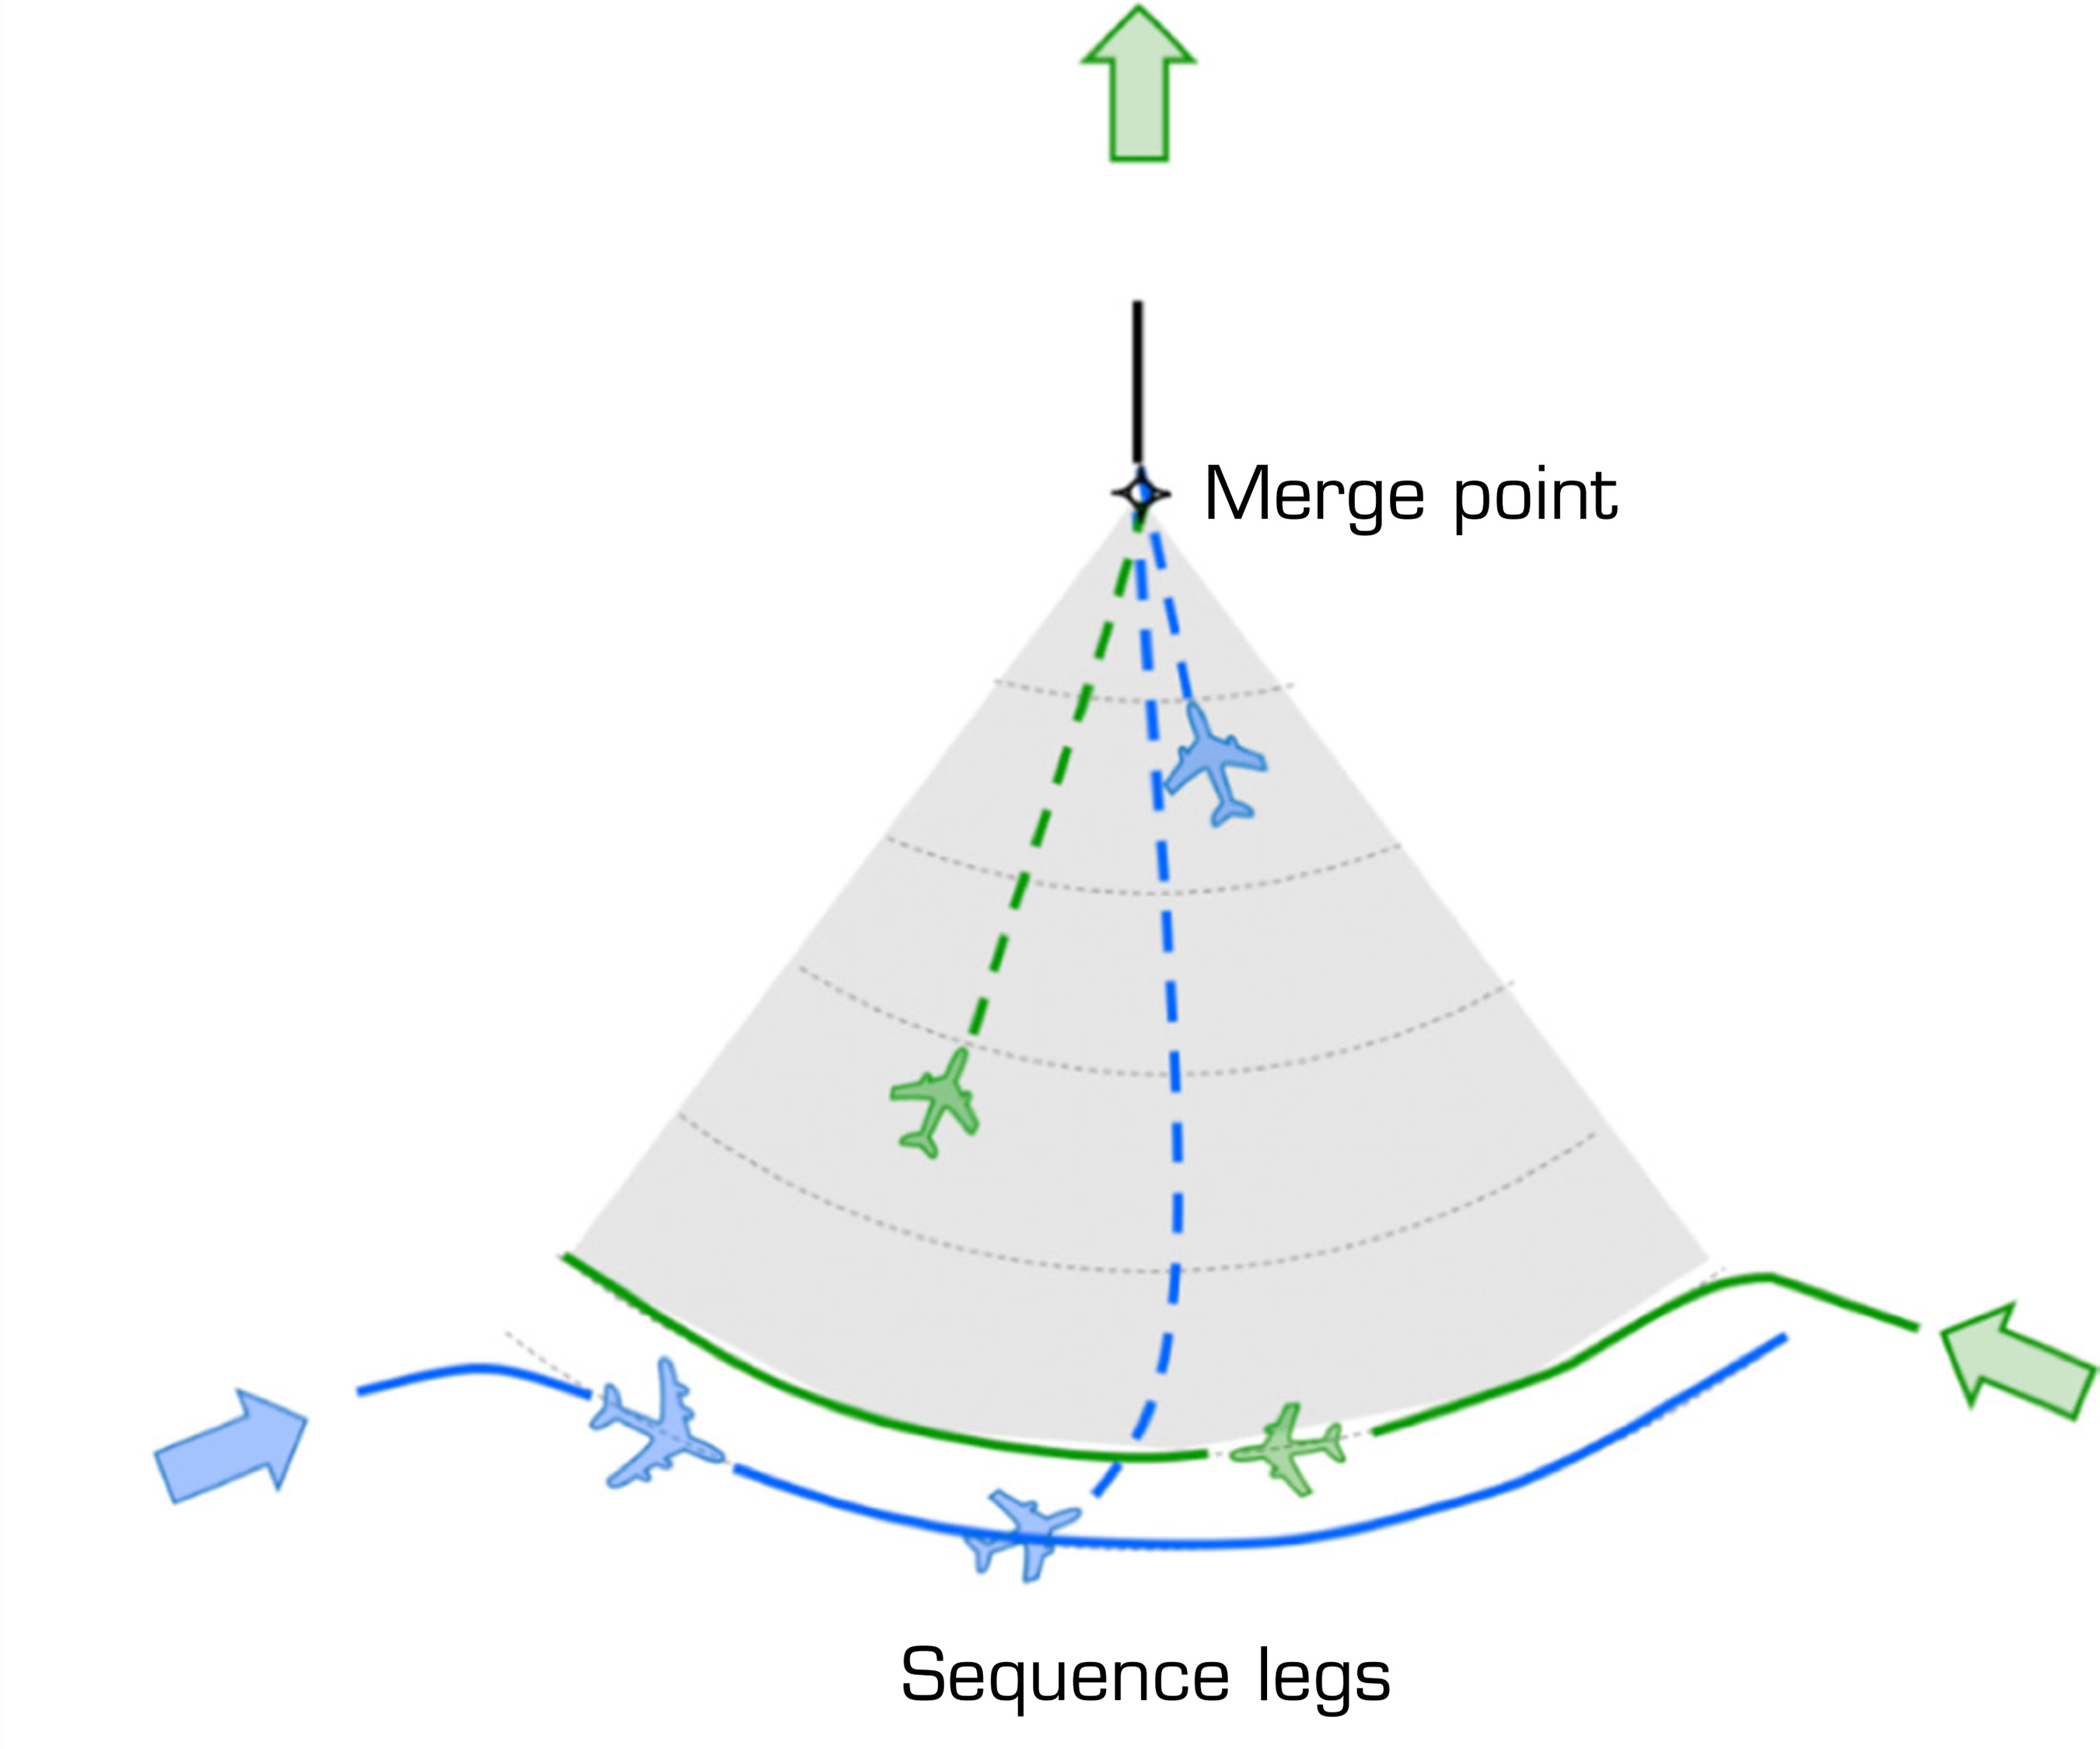
This study focuses on the performance of arrival operations at the SBGR, which handled 276,809 aircraft operations in 2023, making it the busiest airport in South America. A significant redesign of the São Paulo terminal area, known as TMA-SP Neo, was undertaken in 2021 to enhance capacity and reduce air traffic control complexity and workload. A key element of this redesign was the implementation of a PM system. The PM consists of a systematic technique for sequencing, merging, and spacing the arriving aircraft without the need to resort to vectoring, aimed at improving situational awareness and predictability and reducing controller workload. When an aircraft is on the arc, the pilot waits for the controllers’ “direct to” instruction to the merge point. This system operates based on a specific route structure, as illustrated in Fig. 1, utilizing a merge point and predefined sequencing legs, allowing for effective delay management and ensuring safe separation during high-traffic conditions.
Data description and preprocessing
This study used flight tracking data and aeronautical information data to analyze the actual operations in light of the current airspace structure. The actual flight tracking data for arrival operations at SBGR was collected from FlightRadar24 and contains flight data for the entire year of 2023 (FlightRadar24, 2024). The database holds multiple flight information elements, such as flight ID, time, latitude, longitude, altitude, speed, aircraft type, origin airport, and destination airport. Data preprocessing was performed to clean, filter, and transform the raw flight tracking dataset into a structured dataset of arrival trajectories within the terminal area (modeled as the cylindrical volume with a radius of 100 NM extending from the airport). Aeronautical information data collected from AISWEB (DECEA, 2024) was also used to create a dataset with the Standard Terminal Arrival Routes (STAR) at SBGR, containing information such as latitude, longitude, heading, distance between waypoints, and flight level for each arrival procedure. Similarly, data preprocessing was performed to obtain a structured dataset of standard arrival trajectories within the terminal area.
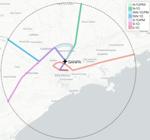
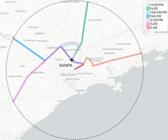
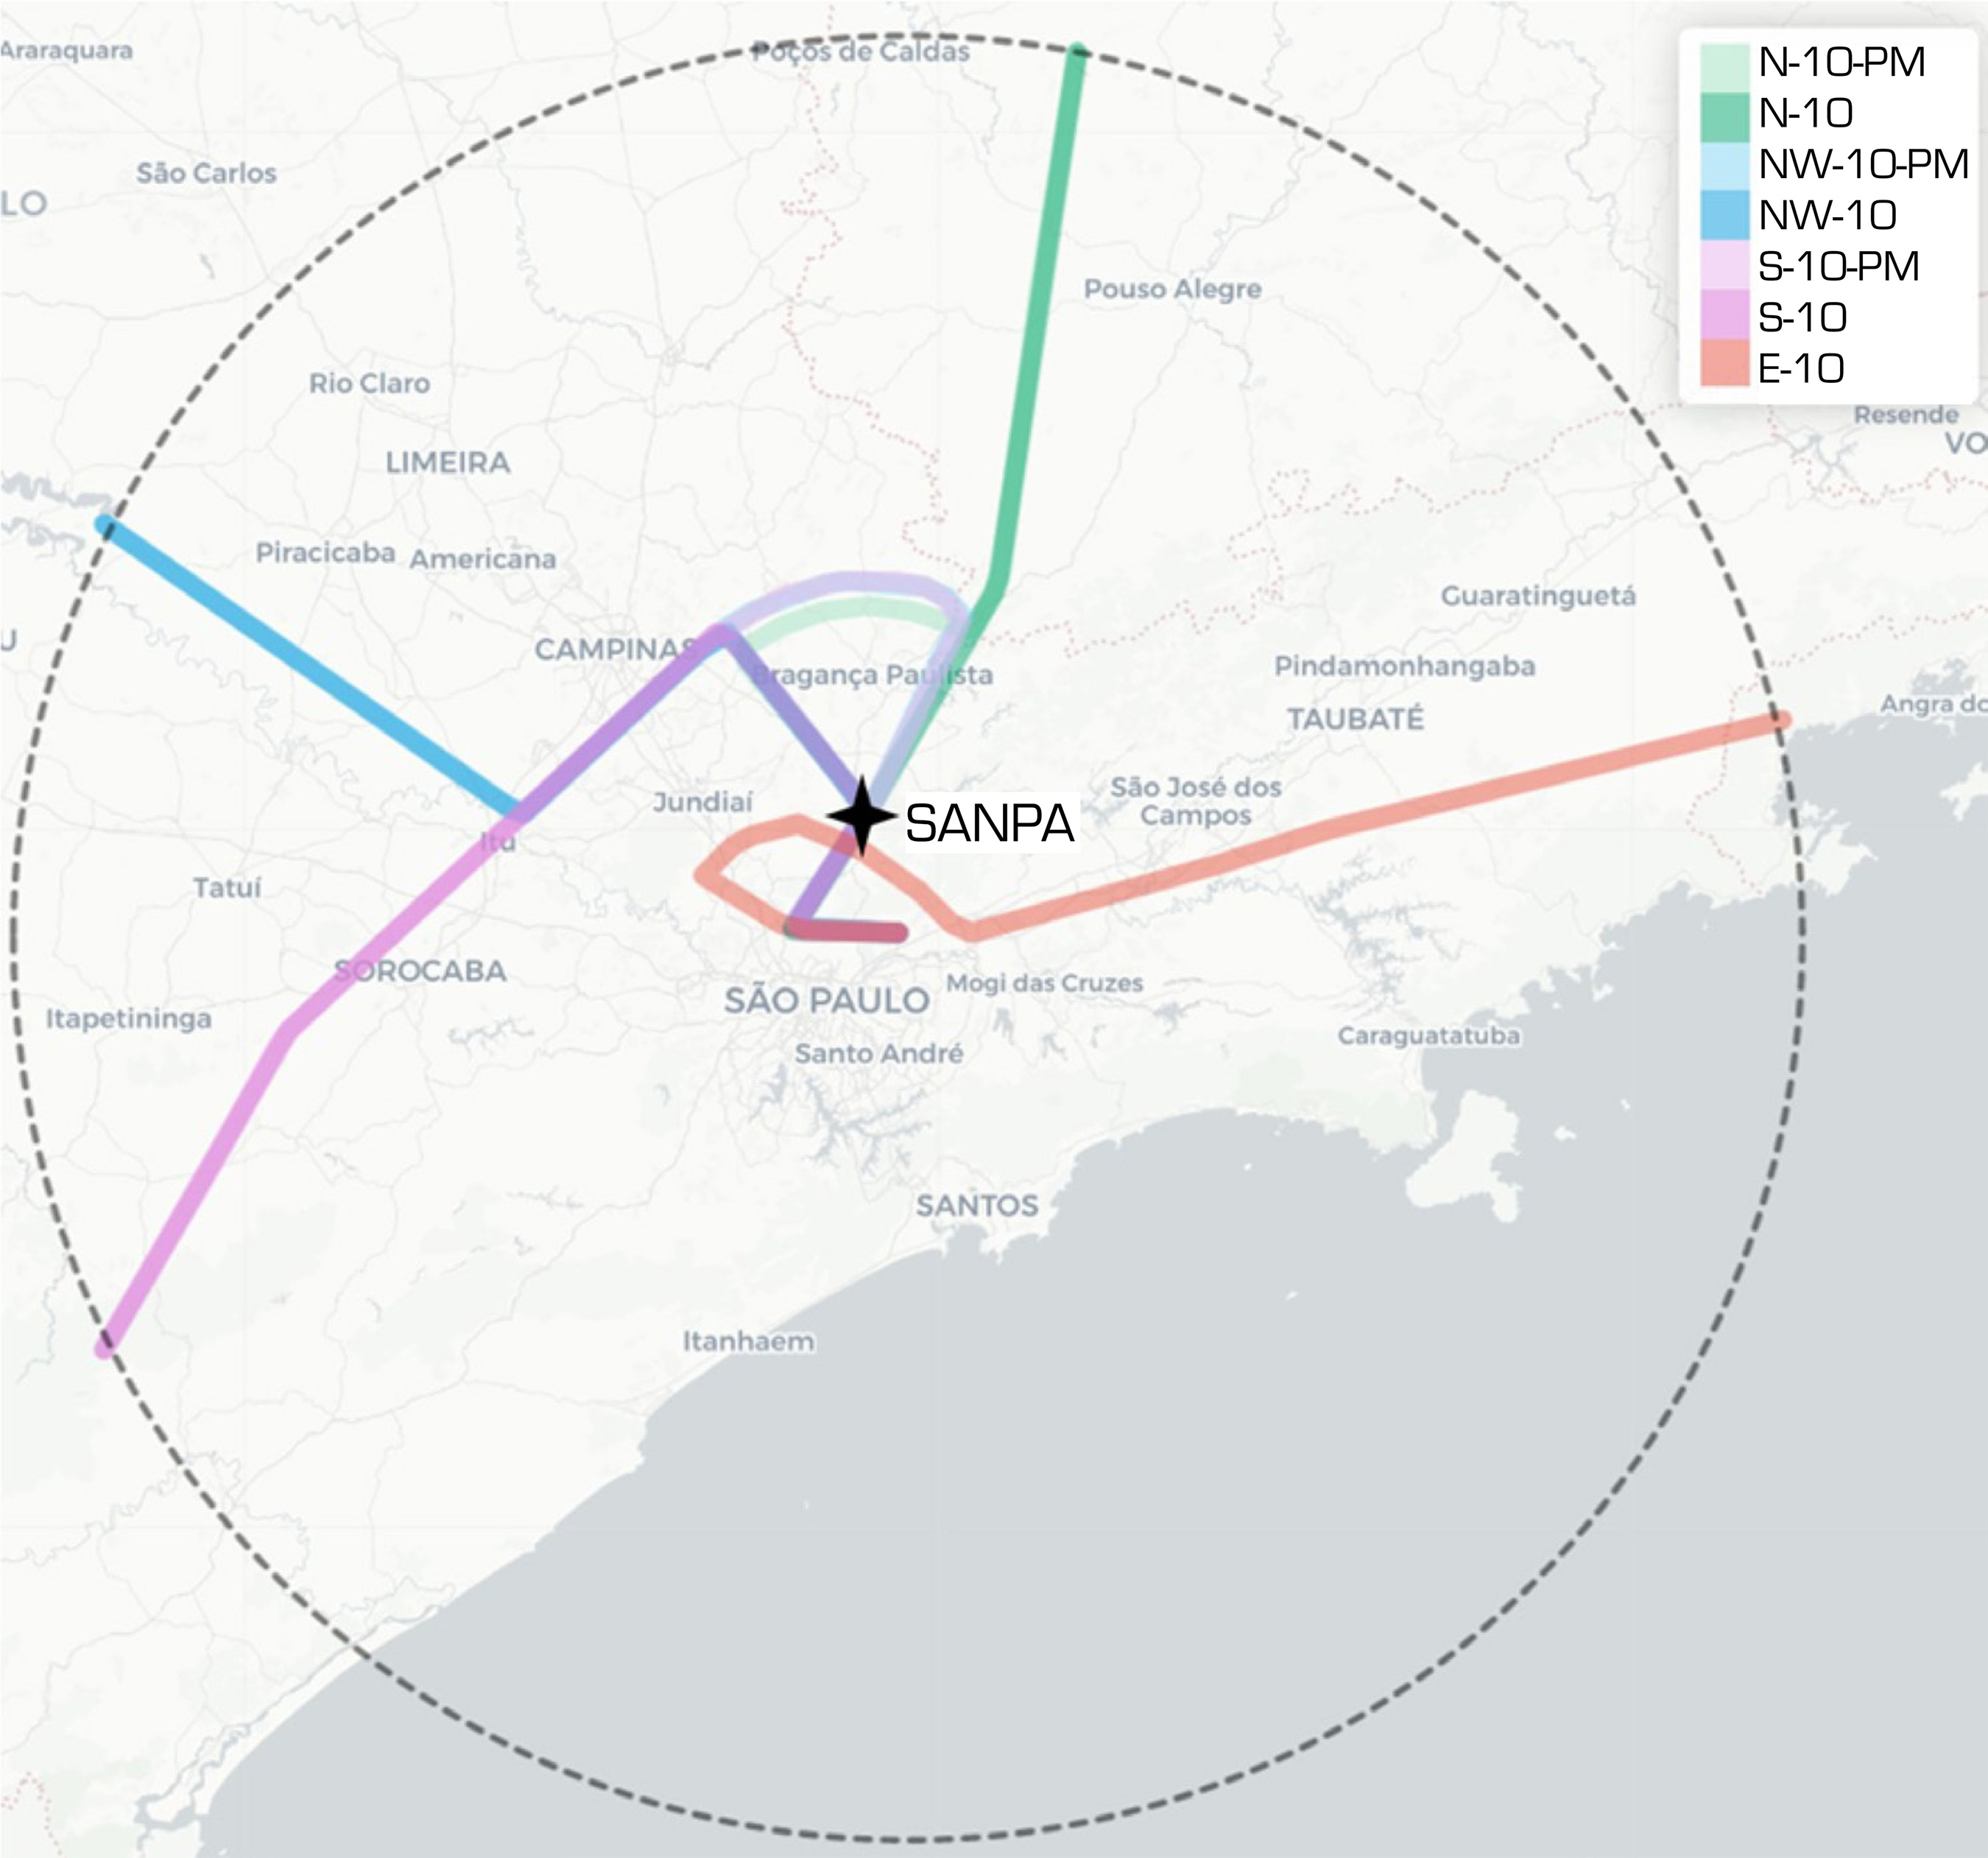
Figures 2 and 3 show the standard procedures for SBGR for arrivals on runway thresholds 10 and 28, respectively. It is observed that they connect four main arrival gates with runways 10/28, either through the main PM arc structure around the merge point SANPA or through direct segments. To improve readability, instead of using the actual name of the arrival procedure, a coding scheme was created, indicating the combination of arrival gate (North – N; Northwest – NW; South – S; and East – E) and runway configuration, along with the information of whether the procedure is part of the main PM structure or not. For instance, the first arrival procedure shown in light green in Fig. 2 connects the North (N) arrival gate with runway threshold 10 through the inner arc of the main PM structure. Based on this, it is identified as N-10-PM.
Trajectory classification
A trajectory classification approach was developed to identify the arrival pattern followed by each flight operation. For this, a trajectory clustering analysis with the Density-Based Spatial Clustering of Applications with Noise (DBSCAN) algorithm was performed to identify the main arrival patterns in the terminal area using a subset of one month of data. Then, a multi-way classifier was trained in a supervised learning fashion using the Random Forests algorithm to match the remaining flight trajectories in the dataset with the learned patterns. As the trajectory clustering process is computationally demanding, the classification model offered a more efficient method for handling the large volume of trajectory data.
Additional flight time
To quantify the efficiency of arrival trajectories, a key performance indicator recommended by ICAO, specifically the KPI 08 (ICAO, 2024), was used. The additional flight time (AFT) indicator computes the difference between the actual flight time and a reference unimpeded time in the terminal area, as defined in Eq. 1. This indicator measures the delay incurred due to tactical air traffic control for sequencing, metering and spacing the flights in the terminal area. The reference time is defined as the 20th percentile of the historical distribution of flight times for each arrival pattern and aircraft category, providing a proxy for an unimpeded arrival process.
where time is the actual flight time in the terminal area for flight i and refpc is the reference time for the corresponding arrival pattern p and aircraft category c of flight i.
Trajectory conformance
To evaluate the predictability of arrival trajectories, a new Trajectory Conformance (TC) indicator was developed. For this, a data resampling and scaling process was performed so that each actual trajectory was represented with a vector of 60 points that contained the horizontal profile within the terminal area. The same process was performed for each standard arrival procedure. Then, for each flight, the Euclidean distance between its actual trajectory vector and the standard procedure vectors was computed, identifying the one with the minimum distance as the arrival procedure used by the flight. The conformance is then calculated as the Euclidean distance between the arrival trajectory and the corresponding arrival procedure, normalized between 0 and 1 with min-max normalization, as defined in Eq. 2. The higher the TC indicator, the lower the conformance of the actual flight trajectory to the standard procedure.
Point merge use
A PM use indicator was defined as the percentage of flights that used the main PM structure of SBGR. To assess if a given flight trajectory passed through the PM sequencing legs, segments in the arrival trajectory with a constant distance to the merge point SANPA were identified, followed by a direct segment to this waypoint.
Point merge arc utilization
Finally, a PM arc utilization indicator was developed to evaluate the extent to which the sequencing arcs are used for delay absorption. For this, circles of 3 NM radius were added around the waypoints that define the arcs, and the presence of trajectory points within at least one of the circles was analyzed. The indicator is then calculated by the ratio of the length of the PM arc actually flown before descending and the total length of the PM arc. In other words, it divides the number of waypoints that the aircraft has flown in the PM arc by the total number of waypoints that define the sequencing leg.
RESULTS AND DISCUSSION
Analysis of terminal airspace utilization
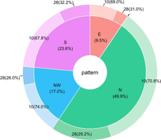
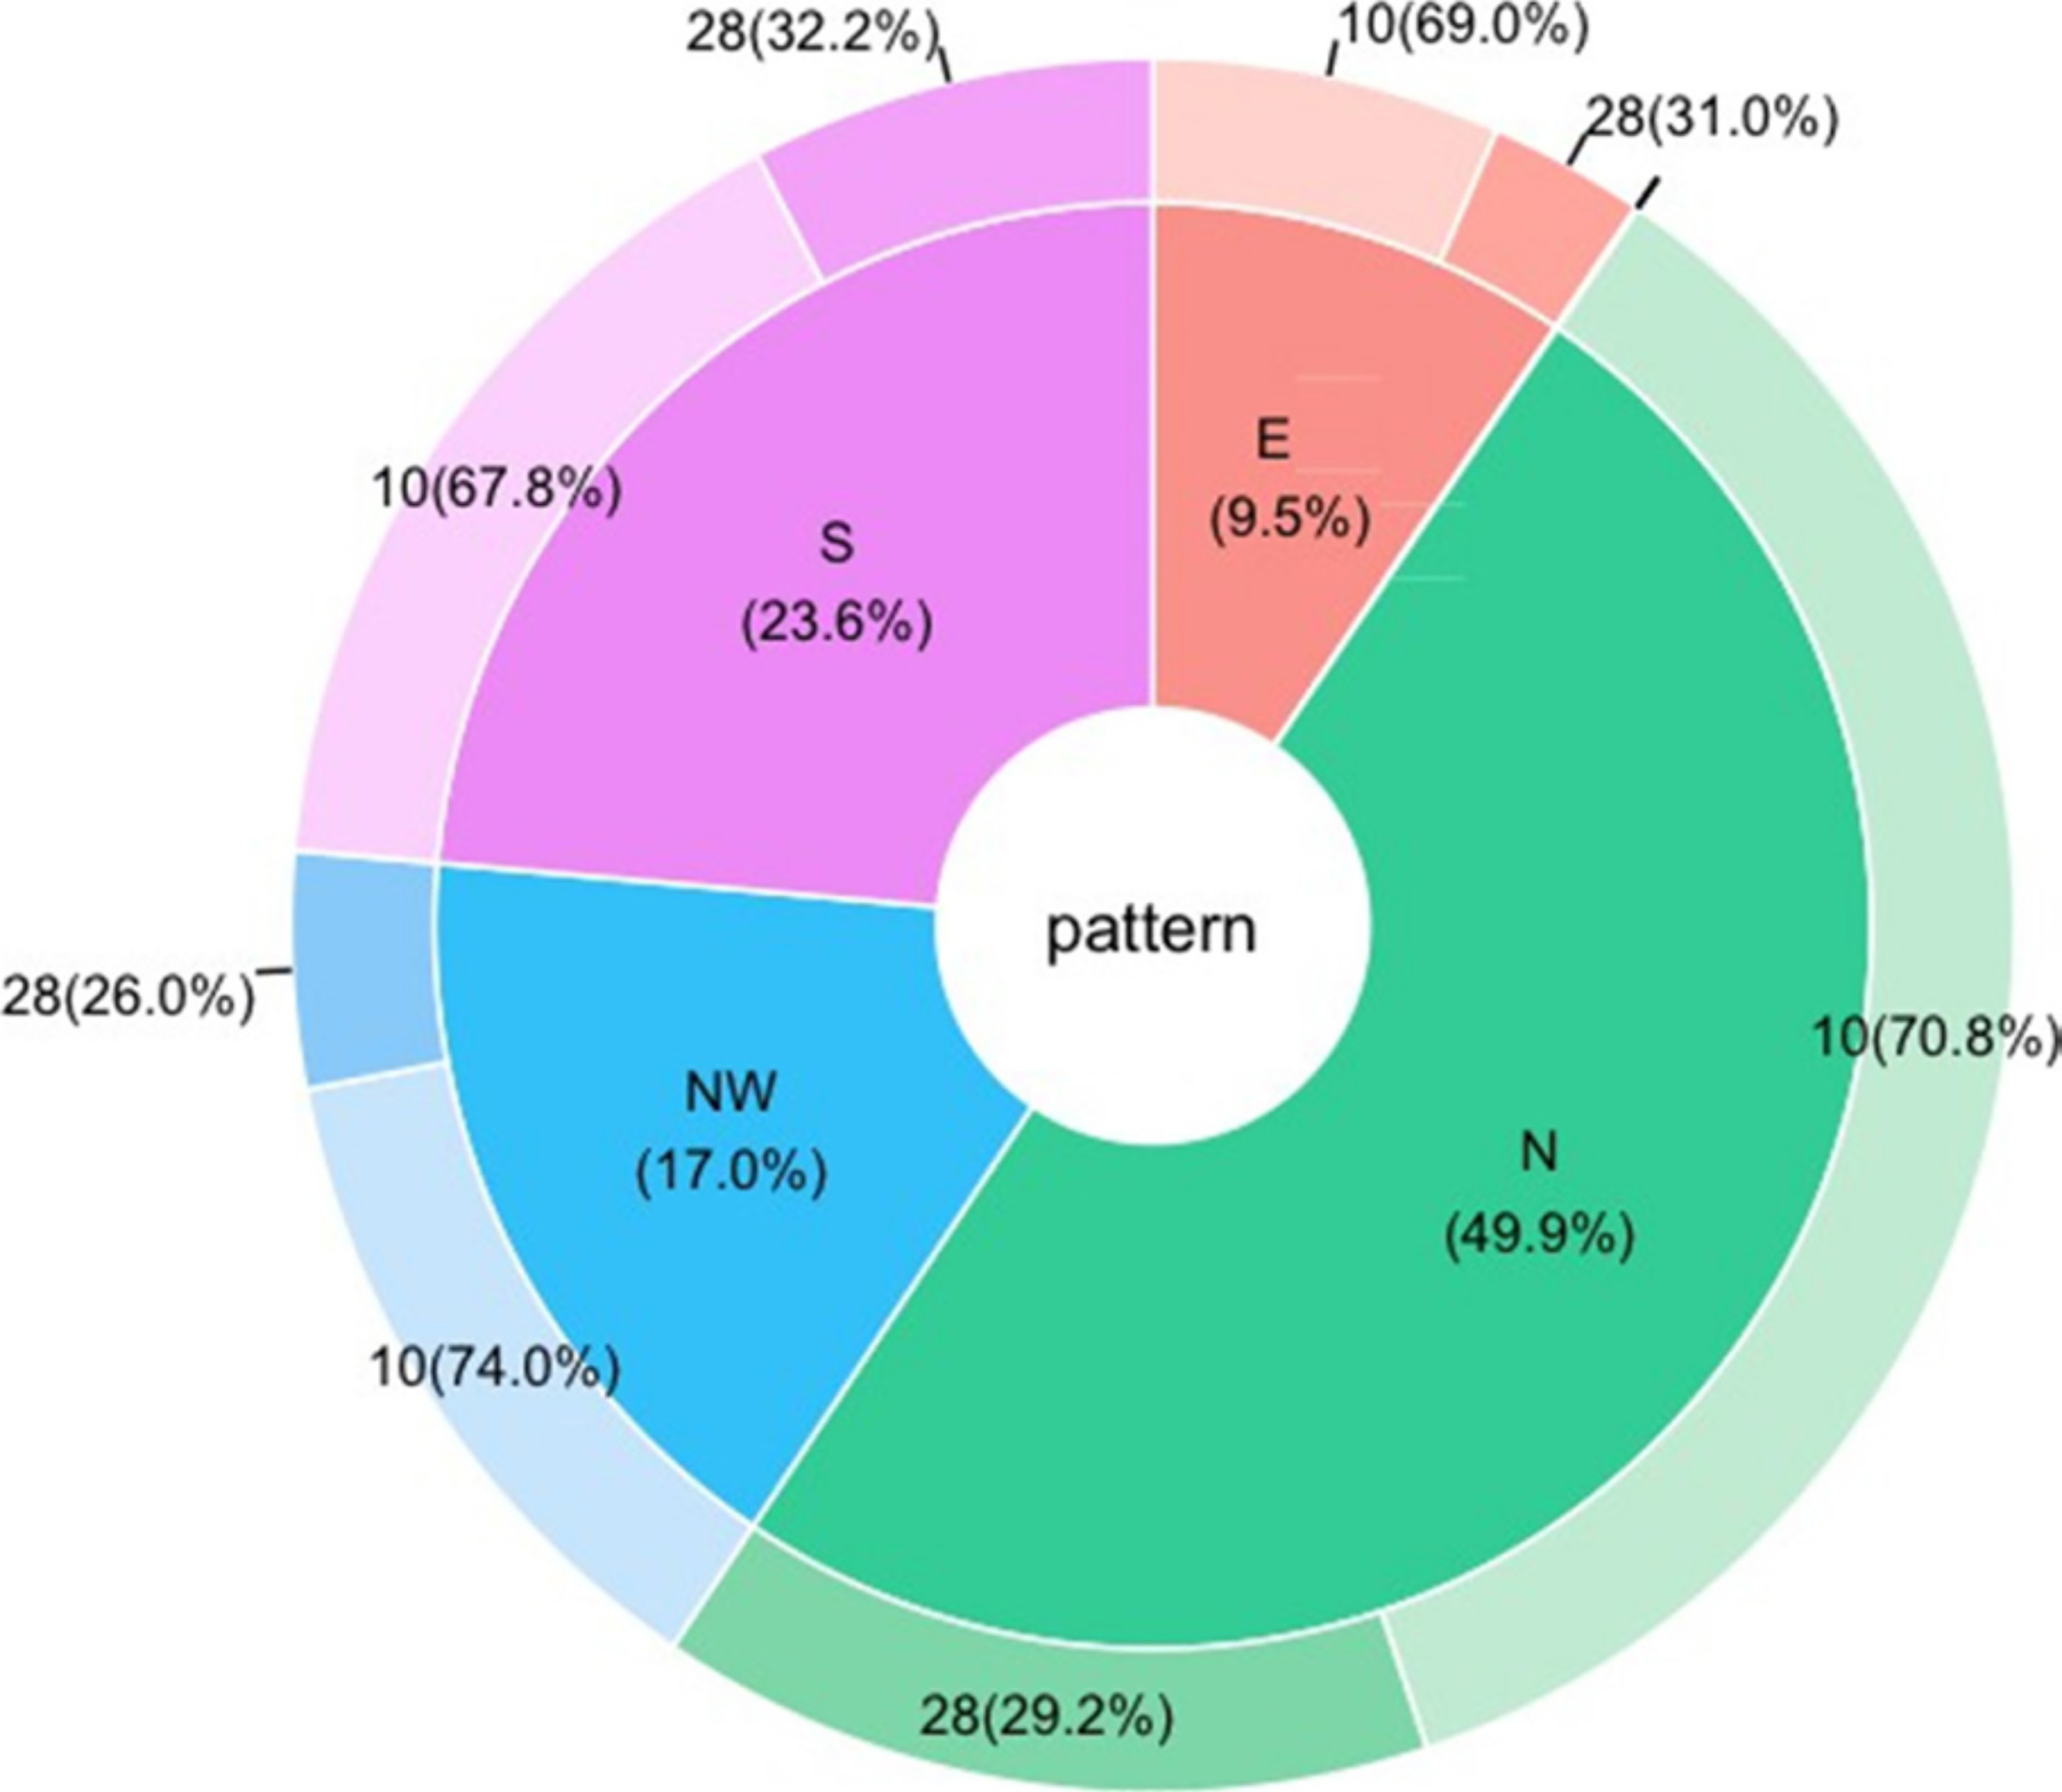
The application of the trajectory classification algorithm enabled the characterization of the actual utilization of the terminal airspace. Figure 4 shows the distribution of flight operations by arrival pattern. The results reveal an uneven distribution of air traffic across arrival procedures. The dominant traffic flow pattern for SBGR corresponds to arrivals from the North (N) gate to runway 10R. A high concentration of arrivals through the North (N) gate is observed, accounting for 49.9% of the operations. The South (S) gate represents the second major flow, accounting for 23.6% of the operations. Finally, 17% of the flights arrive through the Northwest (NW) gate and the remaining 9.5% use the East (E) gate.
Analysis of additional flight time
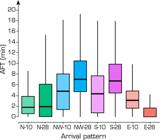
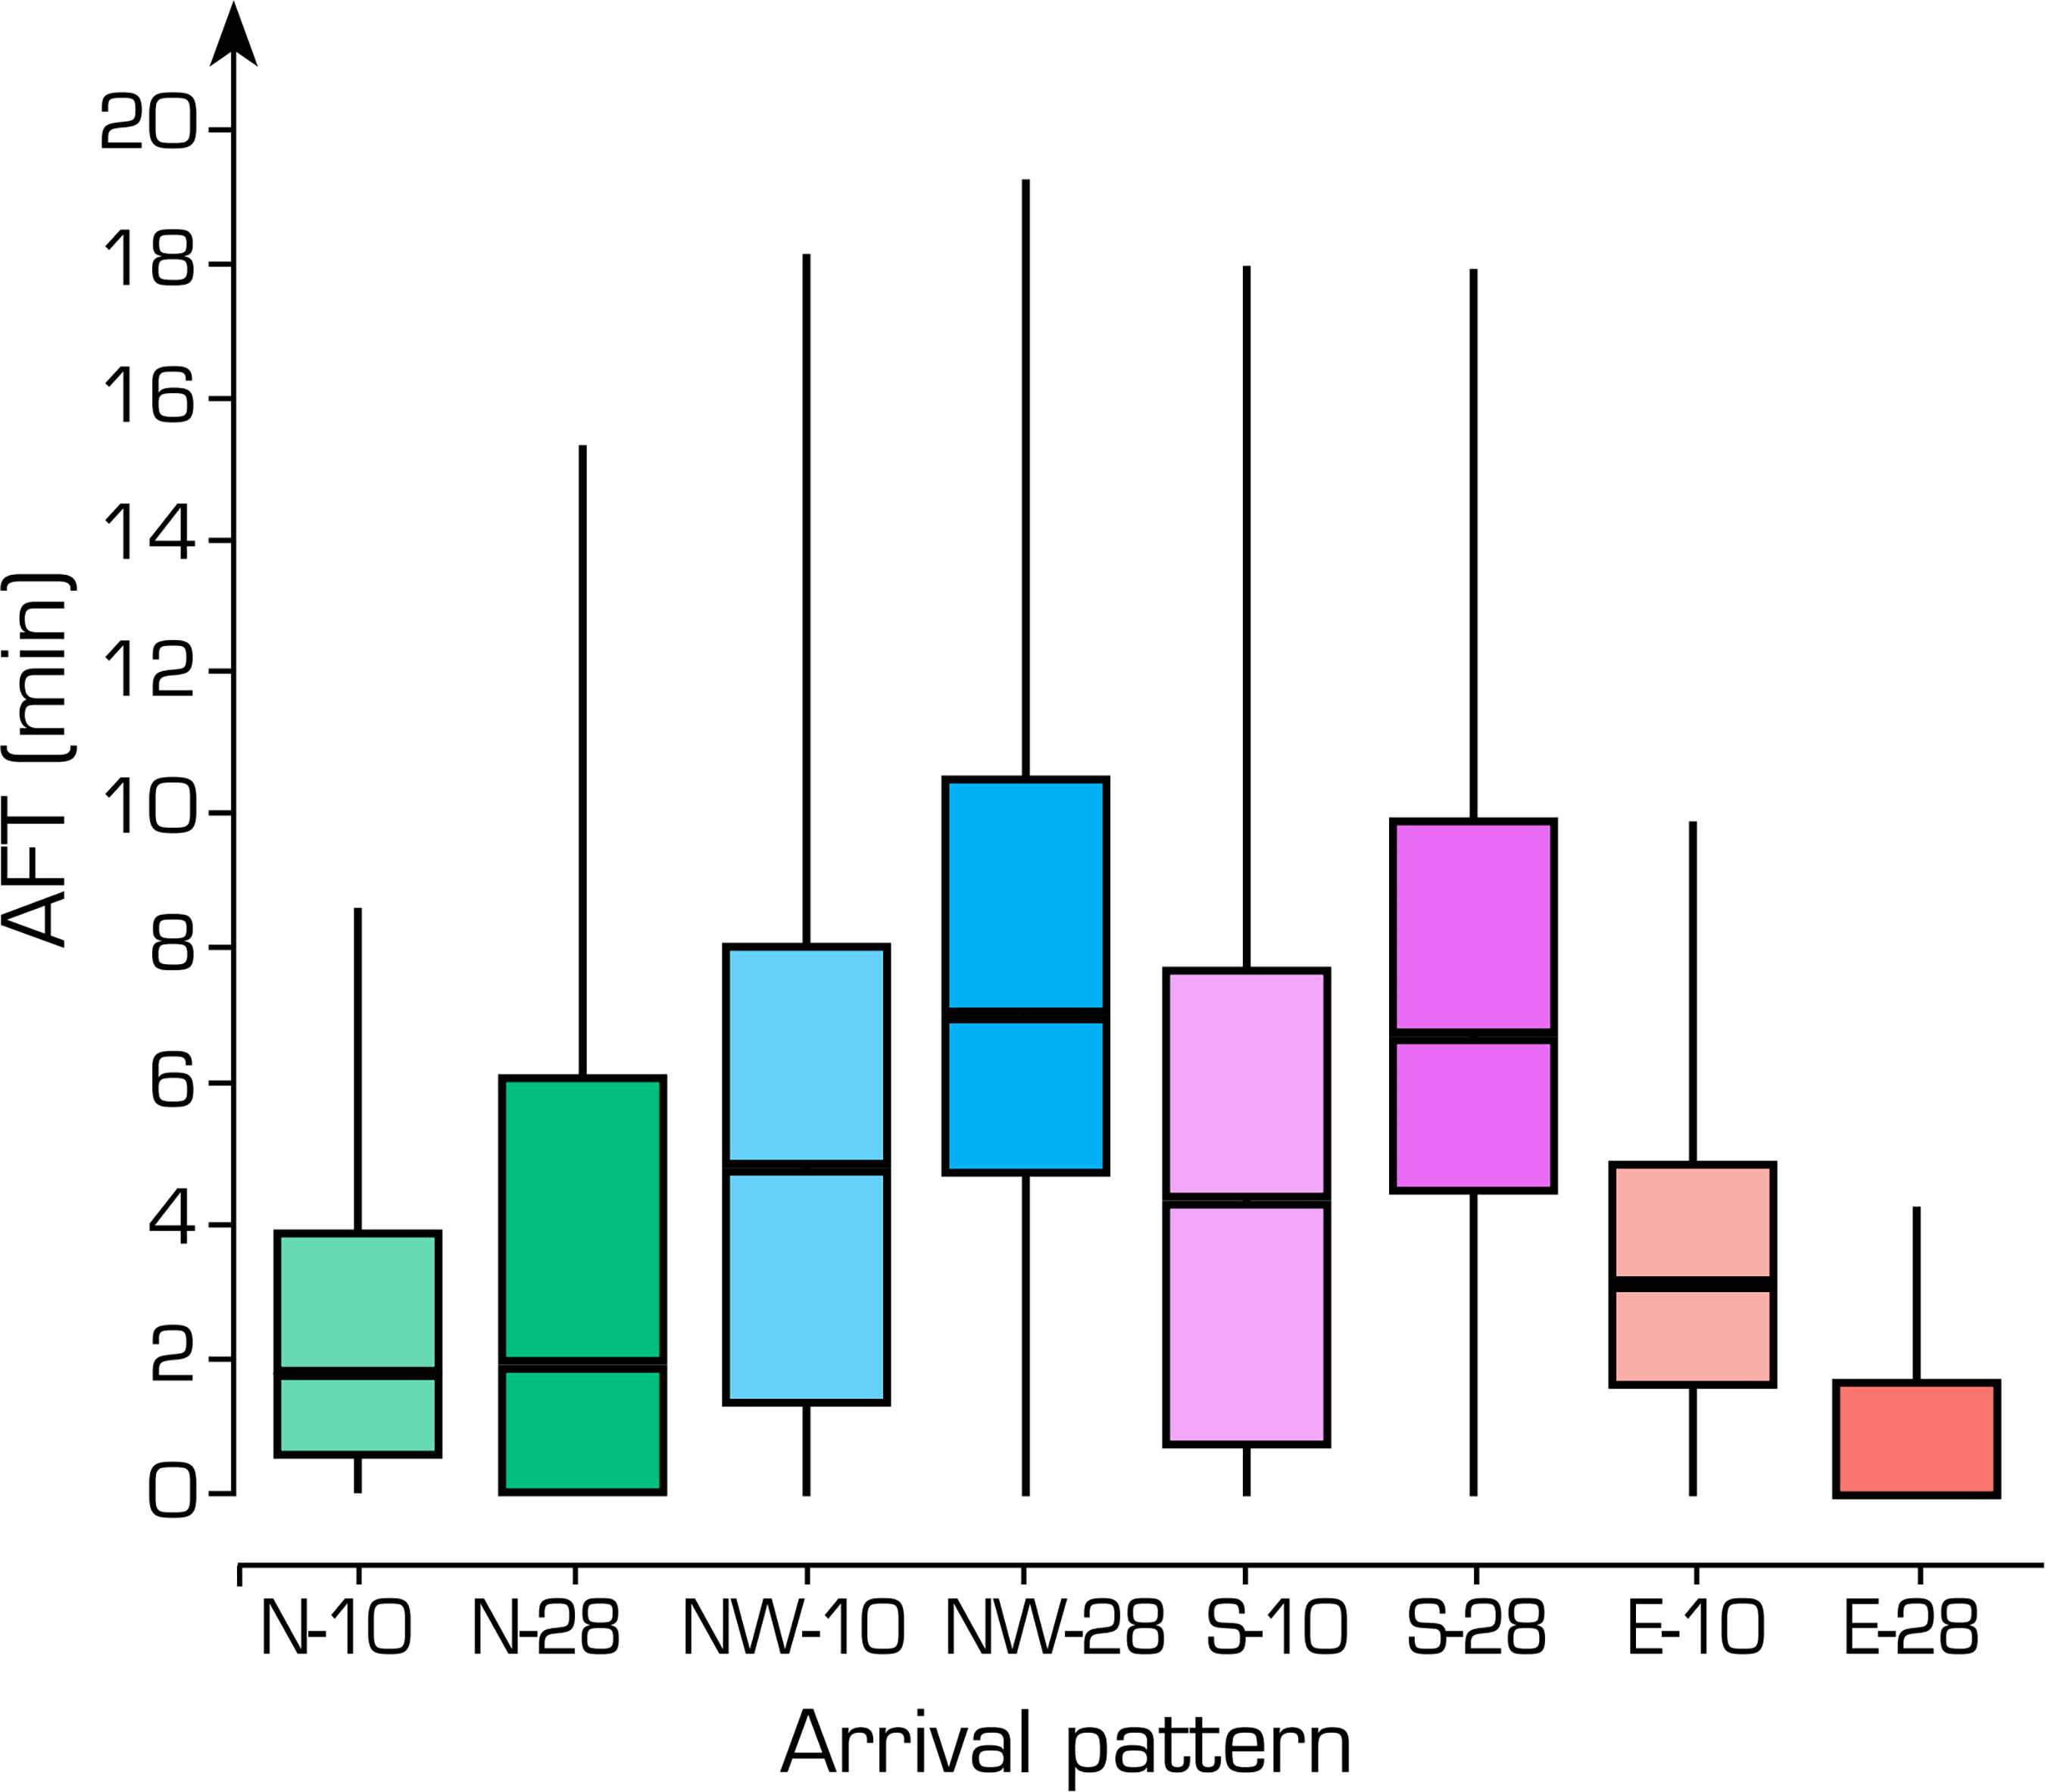
Figure 5 shows the distributions of the indicator AFT by arrival pattern. A high variability in temporal efficiency across arrival patterns and within the same pattern was observed. For instance, the median value of AFT was approximately 2 minutes for the dominant arrival pattern (N-10), but reached almost 7 minutes for other traffic patterns. The South and Northwest flows consistently showed higher values of additional time than the North and East flows, suggesting that they are more likely to absorb queuing delays in the terminal area.
Analysis of trajectory conformance
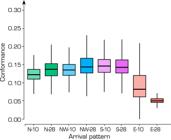
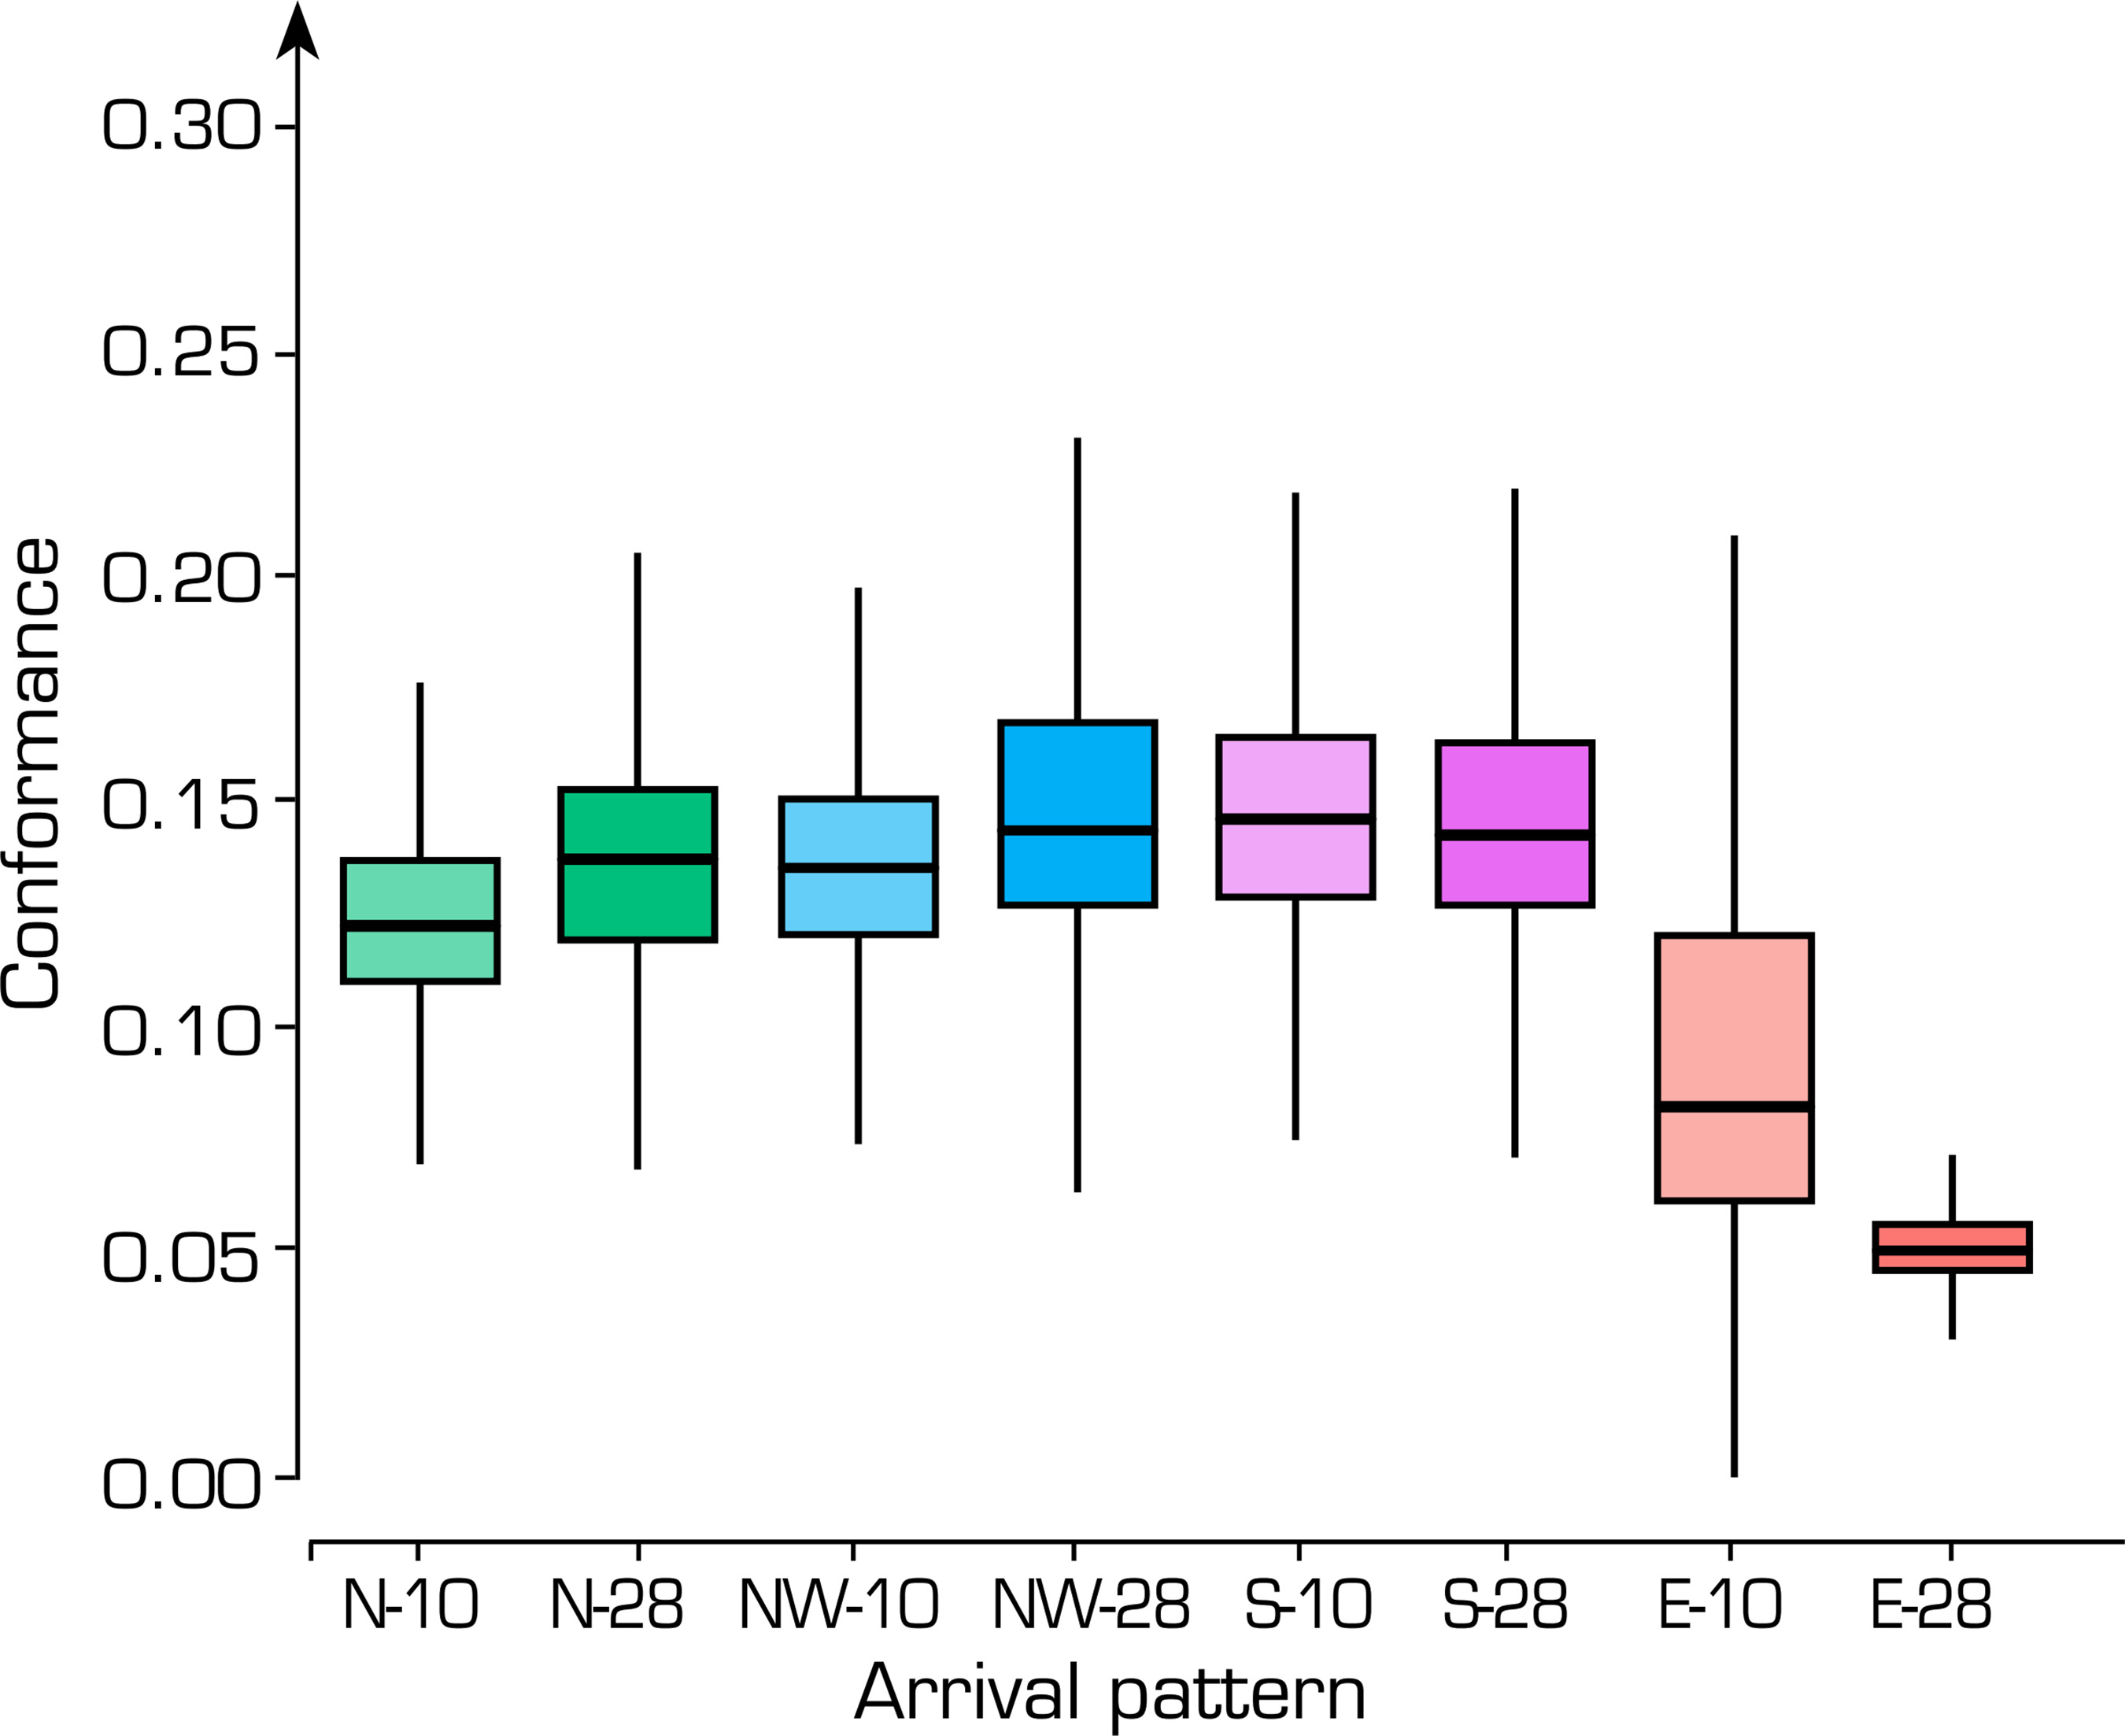
Figure 6 shows the distributions of the indicator TC by arrival pattern. Overall, lower variability for this indicator was observed, indicating a more dependable level of TC across arrival patterns. Nevertheless, the East (E) arrival patterns consistently showed slightly lower normalized conformance values than the other patterns, suggesting better adherence of actual trajectories to standard procedures for this traffic flow.
Analysis of point merge use
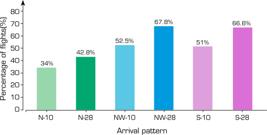
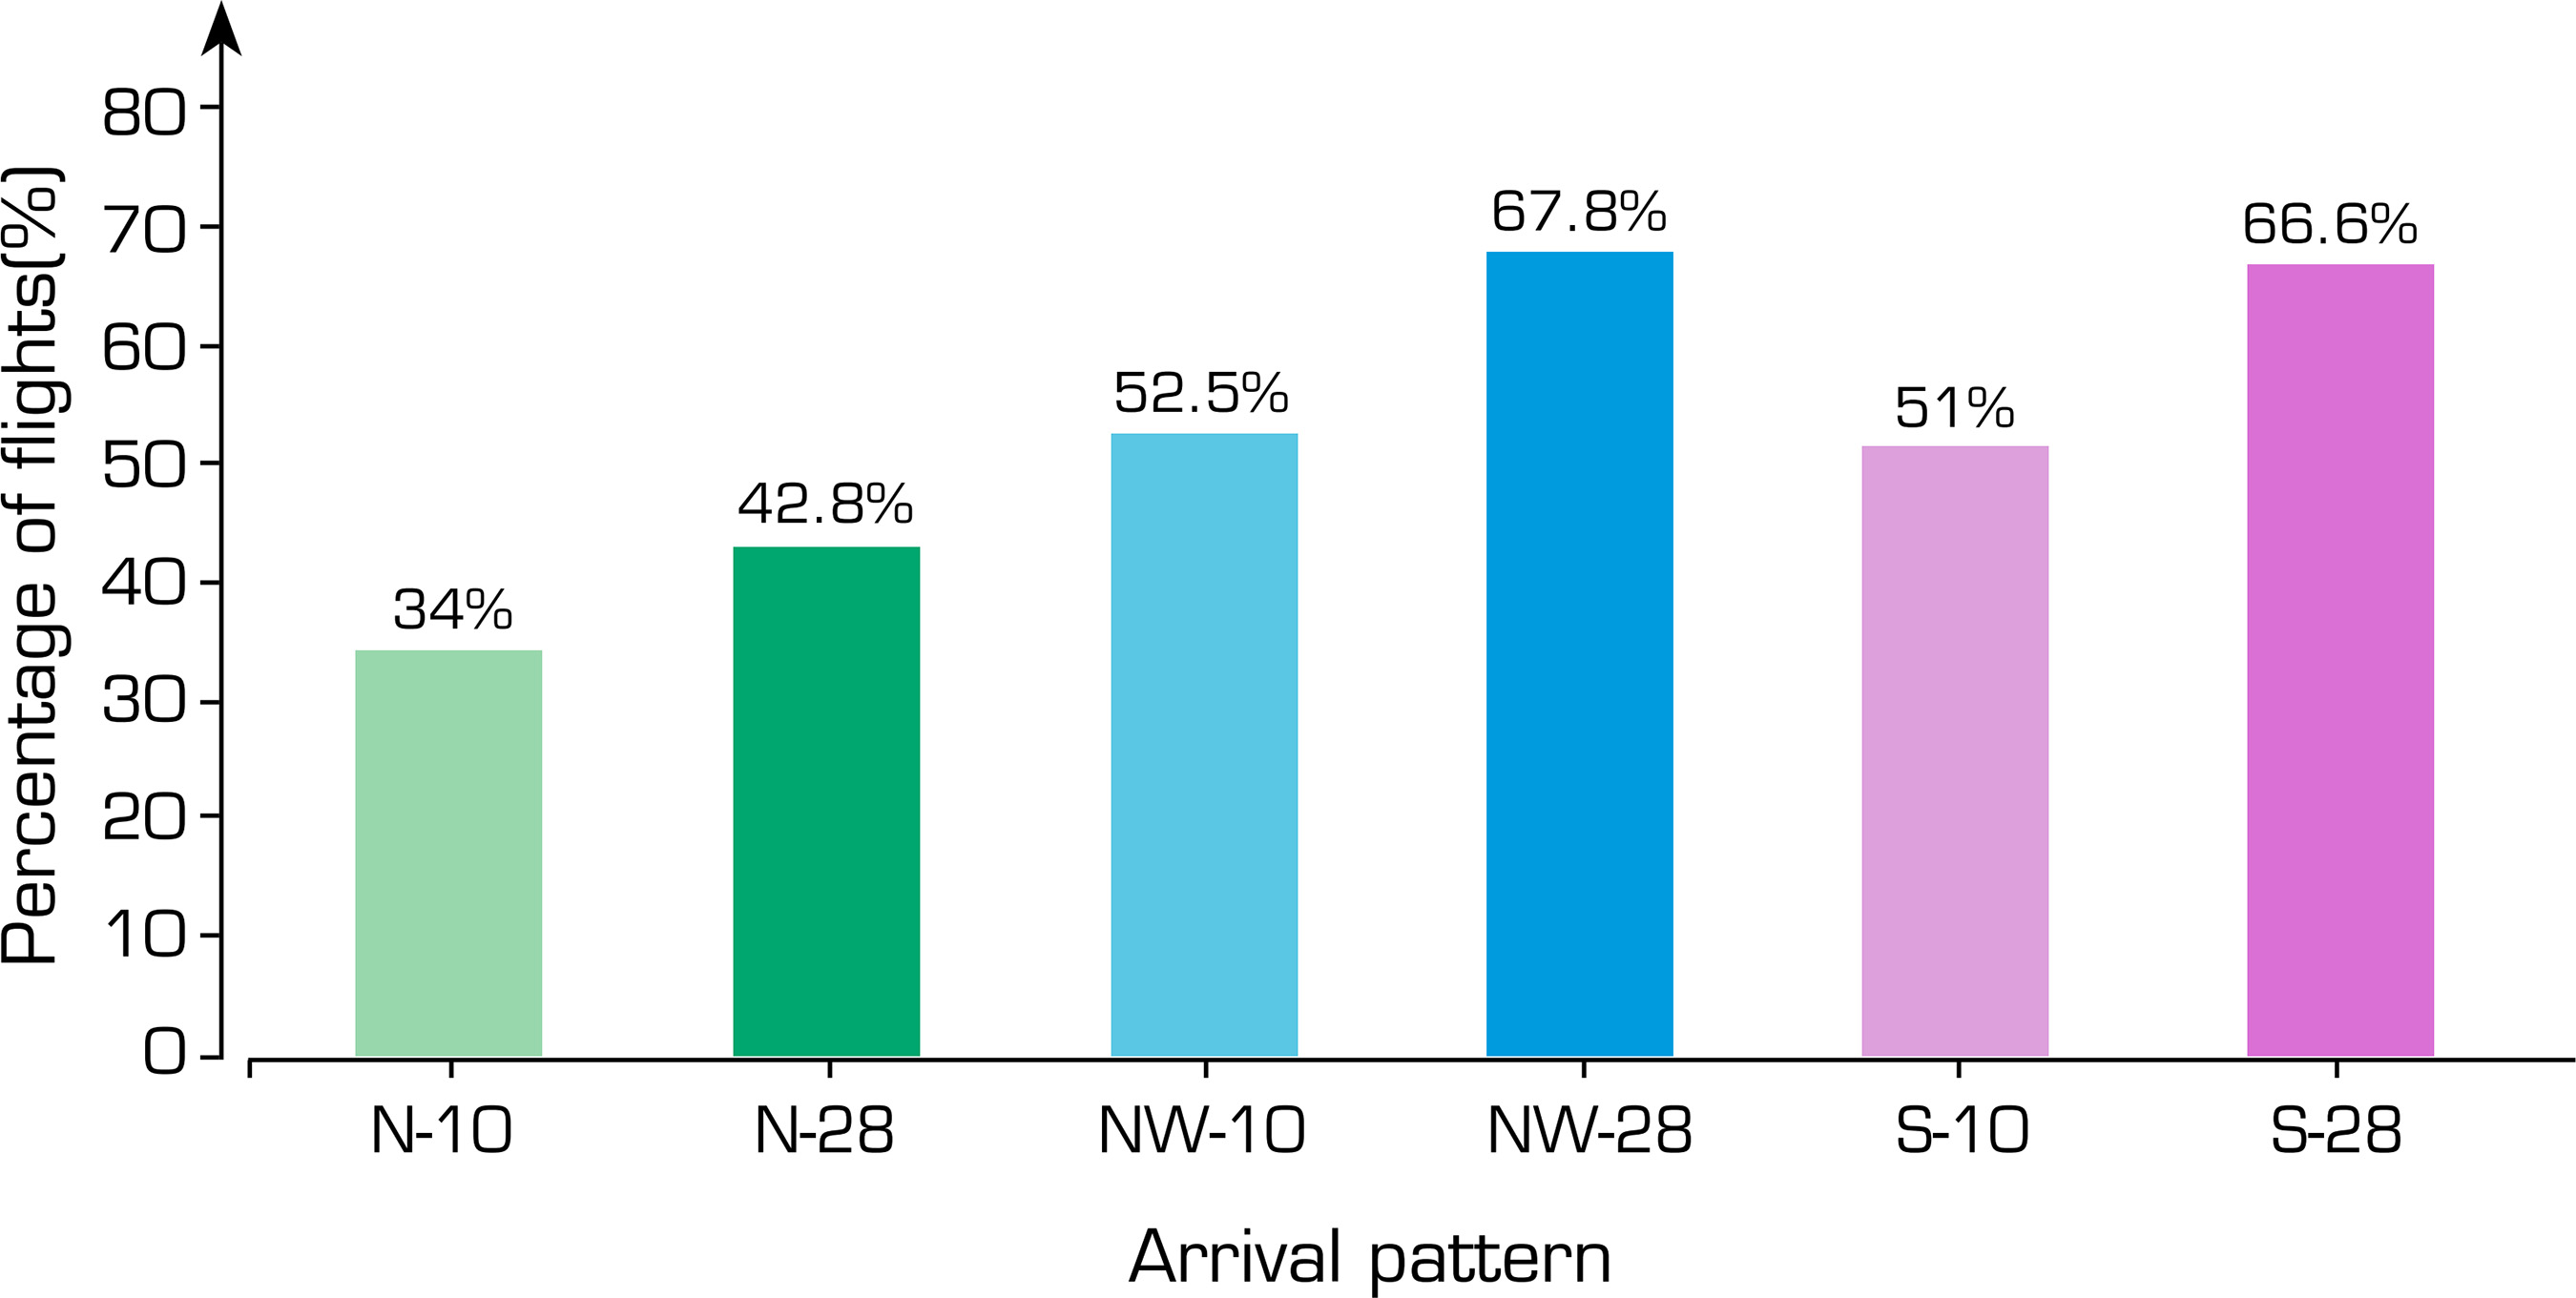
Figure 7 presents the frequency of use of the PM structure at SBGR. It indicates that more than 50% of the South (S) and Northwest (NW) arrival traffic follows the PM procedures. A lower usage rate of PM procedures was observed for the major North (N) arrival traffic. For instance, 34% of the traffic coming from the North and landing on runway 10R absorbed some delay in the PM structure. These results might suggest an air traffic control preference for using the outer sequencing leg to delay the South and Northwest flows during the sequencing process, highlighting a potential opportunity for improvement to achieve a more equitable distribution of delays across arrival patterns. Finally, the least frequent runway configuration (arrivals on runway 28L) was observed to be associated with increased use of the PM structure.
Analysis of point merge arc utilization
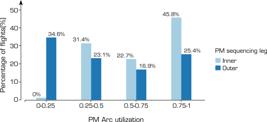
Figure 8 shows the utilization of the inner and outer sequencing arcs of the main PM structure at SBGR as the percentage of flights that traversed a given percentage of the arc length. The graph indicates that 34.6% of the flights that used the outer sequencing arc traversed at most 25% of the arc, while almost all the flights that used the inner sequencing arc traversed at least 25% of the total arc length. It is worth noting that the inner arc is part of the N-PM arrival procedures, while the outer arc is part of the S-PM and NW-PM procedures, as shown in Figs 2 and 3. Interestingly, the results show that despite the lower usage rate of the PM structure for the major North arrival flow (Fig. 7), when it is used, flights tend to spend more time in the sequencing leg. Figure 8 indicates that 45.8% of the North arrival traffic that used the PM structure traversed more than 75% of the inner arc length. By contrast, 25.4% of South and Northwest arrival traffic that used the PM structure flew more than 75% of the outer arc length. The combined results of PM structure use and PM arc utilization suggest that the inner arc is more likely utilized during peak traffic periods, indicating a high use of the delay absorption capacity provided by the PM during these periods.
CONCLUSIONS
In this paper, the operational performance in the terminal area for arrival flights at SBGR after the most recent terminal airspace redesign (TMA-SP Neo) that implemented a PM system was characterized. Based on actual aircraft tracking data and aeronautical information data, a trajectory classification approach was first developed to identify the use of arrival procedures and evaluate the actual utilization of the terminal airspace structure. Several performance indicators were then developed to characterize operational performance, including additional flight time, trajectory conformance, PM use, and PM arc utilization.
The findings revealed an unbalanced distribution of flights per arrival gate and type of procedure, with almost half of the flights arriving from the North direction, predominantly using non-PM direct procedures. The novel PM structure was observed to be utilized by a reasonable share of the flights. More than 50% of the flights arriving from the South and Northwest were found to use the outer sequencing leg of the main PM structure while 34% of the flights in the dominant North flow (N-10) used the inner sequencing leg. These results suggested air traffic control preferences regarding the arrival sequencing process with the PM, revealing a potential opportunity for improvement toward achieving a more equitable distribution of delays across arrival patterns. This is also backed by the observed high variability in additional flight time across arrival procedures. Finally, the PM arc utilization indicator revealed that a significant portion – 45.8% – of the flights in the inner sequencing arc traversed more than 75% of its length, indicating a high use of the delay absorption capacity provided by the PM system during high-traffic periods, which justifies its implementation at SBGR.
ACKNOWLEDGMENTS
Not applicable.
-
FUNDING
Not applicable.
-
Peer Review History: Single Blind Peer Review.
DATA AVAILABILITY STATEMENT
All data sets were generated or analyzed in the current study.
REFERENCES
-
[DECEA] Departamento de Controle do Espaço Aéreo (2021) São Paulo TMA Redesign – Project TMA-SP Neo [accessed Jun xx 2024). https:// publicacoes.decea.mil.br/publicacao/aic-n-1621
» https:// publicacoes.decea.mil.br/publicacao/aic-n-1621 -
[DECEA] Departamento de Controle do Espaço Aéreo (2024) Aeronautical information data [accessed Jun xx 2024). https://aisweb.decea.mil.br/
» https://aisweb.decea.mil.br/ -
[ICAO] International Civil Aviation Organization (2019) Global Air Navigation Plan (Doc 9750, 6th Edition) [accessed Jun xx 2024). https://www4.icao.int/ganpportal/
» https://www4.icao.int/ganpportal/ -
[ICAO] International Civil Aviation Organization (2024) Global Air Navigation Plan – Key performance indicators (KPI) [accessed Jun xx 2024). https: //www4.icao.int/ganpportal/ASBU/KPI
» https: //www4.icao.int/ganpportal/ASBU/KPI -
Babinski PBO, Guterres MX, Albano CS (2024) Proposal of a matrix to measure the perceived level of safety in a terminal control area. J Air Transp Manag 16:e2624. https://doi.org/10.1590/jatm.v16.1346
» https://doi.org/10.1590/jatm.v16.1346 -
EUROCONTROL (2021) Point Merge implementation: a quick guide [accessed Jun xx 2024). https://www.eurocontrol.int/publication/point-merge-implementation
» https://www.eurocontrol.int/publication/point-merge-implementation -
Flightradar24 (2024) Flight tracking service [Internet]. Stockholm: Flightradar24 AB; c2007-2024 [accessed Jun xx 2024). https://www.flightradar24.com/
» https://www.flightradar24.com/ -
Gulding J, Knorr D, Rose M, Chen X, Enaud P, Hegendoerfer H (2010) US/Europe comparison of ATM-related operational performance. Air Traffic Control Q 18(1):5-27. https://doi.org/10.2514/atcq.18.1.5
» https://doi.org/10.2514/atcq.18.1.5 -
Hardell H, Lemetti A, Polishchuk T, Smetanova L (2023a) Performance characterization of arrival operations with Point Merge at Oslo Gardermoen Airport. Paper presented 2023 15th USA/Europe Air Traffic Management Research and Development Seminar. Federal Aviation Administration; Savannah, USA. https://www.atrdsymposium.org/past-seminars/15th-seminar/papers-and-presentations/
» https://www.atrdsymposium.org/past-seminars/15th-seminar/papers-and-presentations/ -
Hardell H, Polishchuk T, Smetanova L (2023b) Investigation of Point Merge utilization worldwide using Opensky Network data. J Open Aviat Sci 1(2). https://doi.org/10.59490/joas.2025.7729
» https://doi.org/10.59490/joas.2025.7729 -
Lemetti A, Polishchuk T, Saez R, Prats X (2019) Evaluation of flight efficiency for Stockholm Arlanda Airport arrivals. Paper presented 2019 IEEE/AIAA 38th Digital Avionics Systems Conference. IEEE/AIAA; San Diego, USA. https://doi.org/10.1109/DASC43569.2019.9081751
» https://doi.org/10.1109/DASC43569.2019.9081751 -
Leones JL, Polaina Morales M, D’Alto L, Escalonilla PS, Ferrer Herrer D, Bravo MS, Camara FC, Martínez Mateo M, Namee BM, Wang S, et al (2018) Advanced flight efficiency key performance indicators to support air traffic analytics: assessment of European flight efficiency using ADS-B data. Paper presented 2018 IEEE/AIAA 37th Digital Avionics Systems Conference. IEEE/AIAA; London, UK. http://doi.org/10.1109/DASC.2018.8569584
» https://doi.org/10.1109/DASC.2018.8569584 -
Murça MCR, Hansman RJ, Li L, Ren P (2018) Flight trajectory data analytics for characterization of air traffic flows: a comparative analysis of terminal area operations between New York, Hong Kong and São Paulo. Transp Res Part C Emerg Technol 97:324-347. https://doi.org/10.1016/j.trc.2018.10.021
» https://doi.org/10.1016/j.trc.2018.10.021 -
Mutlu AA (2021) The evaluation of Istanbul airspace design from the perspective of complexity and safety. J Air Transp Manag 97:102137. https://doi.org/10.1016/j.jairtraman.2021.102137
» https://doi.org/10.1016/j.jairtraman.2021.102137 -
Pasutto P, Zeghal K, Hoffman EG (2020) Vertical efficiency in descent: assessing the potential for improvements at the top 30 European airports. Paper presented 2020 AIAA Aviation 2020 Forum. AIAA; virtual congress. https://arc.aiaa.org/doi/10.2514/6.2020-2893
» https://doi.org/10.2514/6.2020-2893 -
Polishchuk T, Smetanova L (2023) New insight towards characterization of the terminal areas. Paper presented 2023 AIAA Aviation 2023 Forum. AIAA; San Diego, USA. https://arc.aiaa.org/doi/10.2514/6.2023-3971
» https://doi.org/10.2514/6.2023-3971 -
Sampaio FCG, Costa Filho RN, Guterres MX (2022) Modeling resilience of air traffic management systems based on complex networks, J Air Transp Manag 14:e2222. https://doi.org/10.1590/jatm.v14.1273
» https://doi.org/10.1590/jatm.v14.1273 -
Zanin M (2020) Assessing airport landing efficiency through large-scale flight data analysis. IEEE Access 8-170519-170528. https://doi.org/10.1109/ACCESS.2020.3022160
» https://doi.org/10.1109/ACCESS.2020.3022160
Edited by
-
Section editor:
Alison Moraes https://orcid.org/0000-0002-6493-1694

 Source:
  Source: Elaborated by the authors.
 Source: Elaborated by the authors.
 Source: Elaborated by the authors.
 Source: Elaborated by the authors.
 Source: Elaborated by the authors.
 Source: Elaborated by the authors.
 Source: Elaborated by the authors.