
 Method of Assessing Network Traffic Characteristics of Heterogeneous Space-Air-Ground Communication Networks
ABSTRACT
One of the features of space-air-ground integrated networks and other heterogeneous networks is that most network applications operate in real-time, and network traffic is bursty and self-similar. An urgent task while designing heterogeneous networks is to predict the behavior of network traffic to take the necessary measures to preserve the information transmitted over the network. The article is devoted to the study of self-similarity properties of typical heterogeneous network traffic models, for the assessment of the degree of self-similarity of which the Hurst exponent and the total autocorrelation coefficient were used. A network traffic model in the form of an interval process is proposed, which allows modeling the moments of packet appearance, size, transmission rate, and time parameters of packet transmission over communication channels. Numerical results of the analysis of typical network traffic models in the form of point and interval processes are presented, which show that they have self-similarity properties. A simulation model of such a network with a monochannel and random-access protocols with collision detection has been developed. According the simulation results, with the Poisson model of subscriber traffic, network traffic has the property of self-similarity.
Keywords
Heterogeneous network; Bursty traffic; Self-similarity; Hurst exponent; Interval process
INTRODUCTION
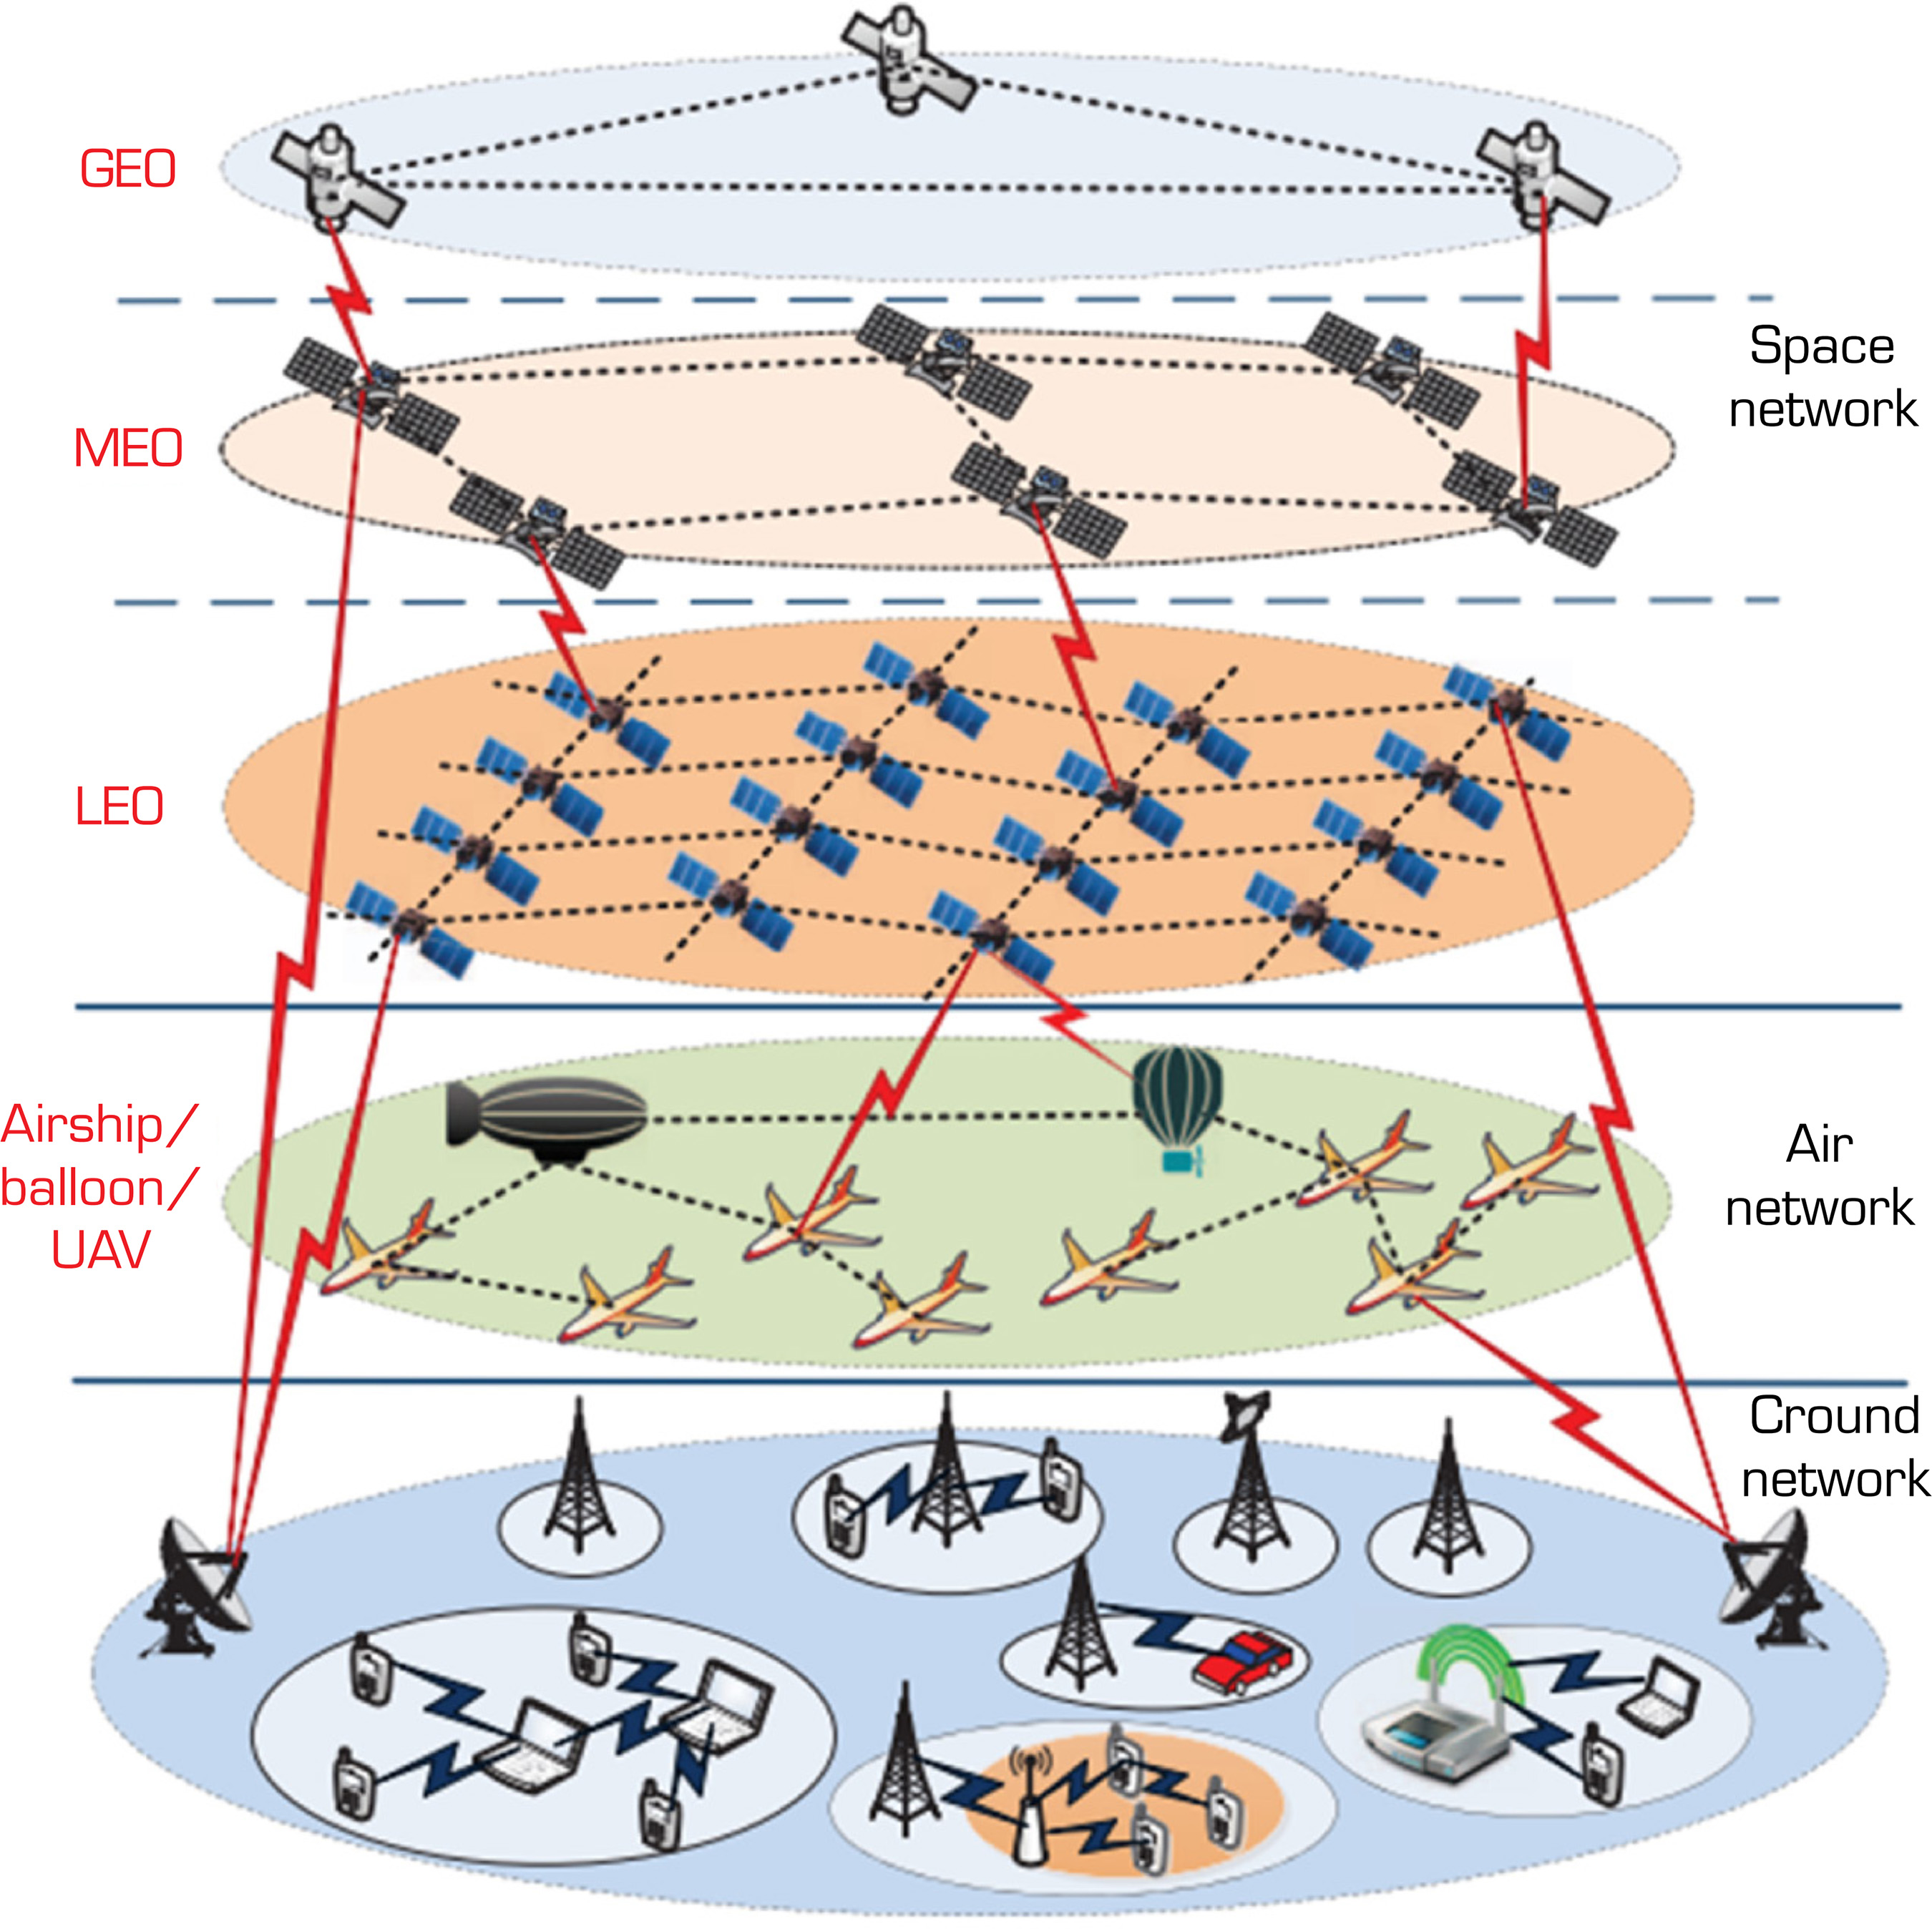
The development of telecommunication, space, and aviation technologies has led to the beginning of the practical implementation of the creation of heterogeneous communication networks space-air-ground integrated networks (SAGIN) (Albuquerque et al. 2007; Anjum et al 2023; Chen et al. 2023; Hubenko et al. 2006; Liu et al 2018; Sheng et al. 2022). The enlarged structure of SAGIN is shown in the Fig. 1 (Liu et al. 2018); it contains three main segments: satellite, air, and ground. By integrating these segments, which can operate jointly or independently of each other, global coverage of territories and the ability to provide a wide range of communication services for various subscribers are achieved. In addition, this approach allows for increased efficiency and reliability of communications due to the dynamic management of information flows depending on the current load of individual SAGIN elements (Chechin et al. 2023).
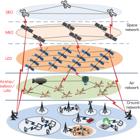
The space network consists of communication satellites at different orbits (altitudes): geostationary Earth orbit (GEO), medium Earth orbit (MEO), and low Earth orbit (LEO), which have the appropriate ground infrastructure: ground base stations, control centers, network operators, etc.
The air network (AN) represents mobile aviation systems such as aircraft, balloons, airships, and unmanned aerial vehicles (UAV). Unlike terrestrial network base stations, AN may provide regional wireless access and is less expensive than satellite networks. The air network (AN) is based on high-altitude platforms (HAP) and low-altitude platforms (LAP) (Arum et al. 2020; Chechin et al. 2022; Hua et al. 2022).
The ground segment of space-air-ground integrated networks (SAGIN) contains terrestrial communication systems, including cellular networks, mobile networks, and ad hoc networks. With the development of 5G/6G technologies, base stations of mobile networks on the ground can be directly included in the SAGIN system (Chen et al. 2023; Choi et al. 2022).
Each of SAGIN segments has its own advantages and disadvantages, which are reflected in the Table 1 (Chen et al. 2023).
The relevance of the implementation of SAGIN is explained by the growing demand for digital and online services, as well as the widespread use of such key Web 3.0 technologies as blockchain, machine learning, and artificial intelligence, and internet of things (IoT) (Hiremath and Kenchakkanavar 2016; Nath et al. 2014;). According to the Ericsson company, global data traffic via the internet is growing by 20-30% annually and will reach 563 exabytes by 2030 (Ericsson 2023). According to forecasts by Exactitude Consultancy (2023), the Web 3.0 market will grow annually by 44% per year and will reach almost 50 billion USD by 2030. Thus, the development of infocommunication, space, and aviation technologies leads to an increase in the number of users and the diversity of gadgets and media resources they use, as a result of which the traffic of SAGIN and other heterogeneous networks becomes heterogeneous. In addition to the heterogeneity of traffic, another feature of heterogeneous networks is that most network applications work in real-time and they are bursty. Such bursty applications (for example, compressed video) create traffic streams with variable bit rate (VBR), and permanent applications (for example, uncompressed video) create constant bit rate (CBR) traffic flows (Mohamed and Agamy 2011). The CBR traffic is easy to model, for example, using Poisson flows, and predict its impact on network performance. The use of the CBR model to analyze the characteristics of the internet is possible in a very limited number of cases, such as when comparing different options for building a network (Chechin and Kolesnichenko 2024). As for VBR traffic, the well-known methods of modeling and calculating network systems based on the use of queueing theory (Kleinrock 1975) do not provide a complete and accurate picture of the processes occurring in the network.
This circumstance determines the relevance of the task of studying the characteristics of network traffic in heterogeneous networks. At the end of the 20th century, such a feature as self-similarity was discovered, which affects the operation of network nodes (Leland et al. 1994). Further studies of various types of network traffic confirmed that it is self-similar in its structure, i.e., pulsating over wide time limits: it contains “bursts” of packets, observed in various time intervals (from milliseconds to minutes or even hours) (Park and Willinger 2000; Sheluhin et al. 2007). The pronounced bursty nature of network traffic, when packets at a high transmission speed arrive at a node not individually, but in a whole batch, leads to overloads of network nodes, which in turn lead to buffer overflows, cause packet losses and increase their delay time (Halgamuge and Wang 2005; Janevski 2003; Kassim et al. 2015). Therefore, a pressing task at the design stages of heterogeneous networks is to predict the behavior of network traffic in order to take the necessary measures to protect and preserve data (Joshi and Hadi 2015).
To study the characteristics of network traffic using analytical methods, various models are used, among which (in addition to the Poisson model) the most widely used are: Pareto model; Weibull model; power-law distribution; Markov models; ON/OFF model; Markov-modulated Poisson process; and autoregressive model (Becchi 2008; Chandrasekaran 2009; Faloutsos et al. 1999; Mohamed and Agamy 2011; Ntlangu and Baghai-Wadji 2017; Reva et al. 2022; Shikhaliyev 2017).
A large number of publications in scientific and technical literature are devoted to the study of these and a number of other models of network traffic (Bhati et al. 2023; Crovella and Bestavros 1996; Dobrescu et al. 2009; Gebali 2015; Nogueira et al. 2003; Odoevsky and Busygin 2020; Preda and Ciumara 2006; Ranadheer et al. 2014; Sadiku and Musa 2013; Yoshihara et al. 2001; Zukerman et al. 2003). However, as a rule, the specifics of packet radio networks, in particular the features of the adopted standards in this area were not taken into account when conducting research. For SAGIN and other wireless packet networks, there are standard traffic models, in particular for wireless metropolitan area networks (WMAN) (Xiao and Pan 2009). The main components of the WMAN model are three basic discontinuous processes: interrupted Poisson process (IPP); interrupted discrete process (IDP); and interrupted renewal process (IRP).
The length of the periods of switching on and off (ON/OFF), the sizes of the packets, and the intervals between them are specified by the parameters of these processes and determined separately in each model, while individual models (IPP, IDP, and IRP with different parameters) can be mixed together.
In the publications listed above and others ones, the network traffic analysis was performed for stationary (non-mobile) subscribers, which is true mainly for the ground network. However, in addition to the ground network, SAGIN has a space network and an, whose subscribers are mobile. The presence of subscribers who move at a fairly high speed (for example, UAVs) leads to a change in the topology of the communication network and, as a result, to a redistribution of information flows. The authors are not aware of any works that have studied the network traffic of ad hoc networks. Therefore, an urgent scientific task is to develop models (analytical and simulation) of the multilayered ad hoc network that adequately describe the functioning processes of SAGIN.
The objectives of this work are:
-
Development of a methodology for calculating the characteristics of network traffic in heterogeneous networks;
-
Development of a network traffic model in the form of an interval process that takes into account data exchange protocols and parameters of transmitted packets;
-
Assessment of the self-similarity of typical models of network traffic in the form of point and interval processes and the possibility of their use for modeling heterogeneous networks;
-
Development of a simulation model of a network with a random-access protocol to a single channel, which is a basic element of SAGIN, and analysis of the characteristics of its network traffic.
The results obtained in the article can be used to evaluate network traffic parameters at the stages of research and design of heterogeneous networks and to predict their behavior under peak loads.
THEORETICAL BASIS
Heterogeneous networks are usually multi-service and provide a wide range of services for subscribers (telephony, transmission of multimedia traffic, file exchange, etc.). In this regard, they are characterized by a significantly different traffic structure and a high share of service traffic. In particular, IoT and industrial IoT (IIoT) are often integrated with mobile networks to provide communication between IoT sensors and subscribers via a global network. At the same time, IoT traffic and mobile network traffic using 3GPP technology have different characteristics in terms of intensity, message volume, and transmission speed. In addition, since heterogeneous networks have a hierarchical structure, during the process of traffic transition from upper levels to lower ones, several streams are merged into one, and a single stream is divided into several parallel or sequential streams. With each transformation, the total number of bits in the blocks can either increase due to the addition of service information and control data specific to each level or decrease due to the use of redundancy elimination and data compression mechanisms. At the same time, the traffic structure remains virtually constant at different network levels: periods of data channel occupancy are replaced by periods of idle time, which indicates the possible presence of self-similarity in the traffic.
There are a large number of works that analyze real traffic in various telecommunication networks and show that real traffic in them meets the self-similarity property, i.e., looks qualitatively the same at any sufficiently large scale of the time axis (Dang et al. 2004; Mah 1997; Moltchanov 2007; Stallings 2002).
Formally, a self-similar process X(t) satisfies the following equation (Hurst et al. 1965):
The parameter H, called the Hurst exponent, is an indicator of the self-similarity of a random process (time series). It determines the degree of its self-similarity and characterizes the property of long-term dependence. The Table 2 shows various values of the Hurst exponent and the characteristics of time series.
In particular, the value H = 0.5 indicates that the process is not self-similar, value H = 1 indicates the maximum degree of self-similarity of the process, and when 0.5 <Н <1, the process is self-similar and has long-term memory (Hurst et al. 1965). In essence, the property of self-similarity is that typical implementations of a self-similar process are visually similar regardless of the time scale on which they are considered. Measurements of actual traffic in telecommunication networks show that the value of the Hurst exponent in many cases is in the range (0.7-0.85). In scientific and technical literature, a fairly large number of process models are used that, to one degree or another, meet the properties of self-similarity (Adas 1997; Alheraish et al. 2005; Baugh and Huang 2001; Dang et al. 2004; Janevski 2003; Leland et al. 1994; Murali et al. 2003). However, taking into account their properties, two large classes can be distinguished: point and interval processes.
The main distinguishing property of point processes is that the traffic is represented as a stream of events of zero duration, and the main parameter is the law of time distribution between occurrences of neighboring events. Point processes, in turn, are divided into continuous (Fig. 2a) and interrupted ones (Fig. 2b). As for interval processes, unlike point processes, they take into account the parameters of the transmitted data blocks (Fig. 2c).
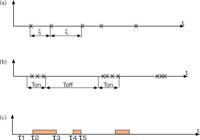
Point continuous flows are characterized by the fact that the time intervals between adjacent events are random and take into account only the occurrence of some event (for example, the arrival of a packet), without considering the parameters of the event itself (packet size or transmission speed, etc.). A similar traffic model, traditionally used to model the flow of calls in a telephone network, describes such phenomena as the transmission of short requests, including signaling information, short files, etc.
For modeling self-similar traffic, flows with distribution laws that differ significantly from the Poisson distribution have been proposed, in particular the Pareto distribution, power distribution, Weibull distribution, and a number of others. The Pareto distribution and power distribution, which allow the average value and the dispersion of time between events to be varied within wide limits, have found the greatest application in traffic modeling.
The Pareto distribution has the following form:
For the Pareto law, the average time between events is Т = αθ/(α – 1) and the dispersion D = θ2/( α – 2) ( α – 1)2. The Hurst parameter Н, which characterizes the degree of self-similarity of the flow, is related to the exponent α by the following expression α = 3 – 2*Н. For the Pareto distribution, depending on the value Н, the dispersion can be finite (in the range H < 0.5) or infinite value (in the range 0.5 < Н < 1).
The power distribution has the following form:
For a power-law distribution, the average time between events is Т = 1/(а(β - 1)), and, if β < 2, the variance is infinite. Asymptotically, as t→∞, the power distribution and the Pareto distribution behave in the same way, which allows relating the value of the Hurst parameter to the exponent in the form β = 3 – 2*Н.
In practice, so-called interrupted processes are widely used, in which two phases periodically alternate: the ON/OFF model. Each phase is characterized by a random duration with a known distribution law. In the first phase (ON phase), a flow of events with a given distribution law is formed; in the second phase (OFF phase) no events are formed (Fig. 2b). In the specification of the Institute of Electrical and Electronics Engineers (IEEE) 802.16.3c-01/30r1 (Baugh and Huang 2001), four basic models for four main types of traffic are described, for each of which a table of basic parameters is defined. This parameters are used to determine the actual traffic parameters depending on the transmission speed and the volume of information transmitted: IPP to generate traffic for an individual subscriber; four discontinuous Poisson processes (4IPP) for generating protocol traffic (TCP, HTTP, FTP); interrupted deterministic process (IDP) for generating voice traffic; and IRP to generate video traffic.
For each type of traffic, a table of basic parameters is defined, which is used to determine the actual traffic parameters depending on the transmission speed and the volume of information transmitted. As an illustration, Tables 3 and 4 respectively provide basic data for the 1IPP and 4IPP models, where λ determines the intensity of the event flow in the ON state, and the coefficients СON, СOFF represent the proportion of time the process spends in the corresponding state.
The point processes described above take into account only the fact of occurrence of some event (for example, the arrival of a packet) and do not take into account the parameters of the event itself (packet size or transmission speed, etc.). However, in heterogeneous networks, when providing certain services (multimedia, streaming video, IP telephony), messages may appear whose information size cannot be neglected. This necessitates the use of interval traffic models. This traffic model (Fig. 2c) in the simplest case contains a sequential change of two phases. The first phase is free from the appearance of packets and its duration coincides with the time interval between adjacent data blocks. In the second phase, continuous data transmission occurs, and its duration coincides with the duration of transmission of the entire data block. For an interval flow, the natural measure of traffic is the transmission speed or the volume of the transmitted information block.
METHODOLOGY
The following formal description of the interval process is introduced, which adequately reflects the features of network traffic in heterogeneous networks. The successive moments of time τ1, τ2, … are marked on the numerical time axis so that during the intervals Ti = (τ2i, τ2i+1], i = 1, 2, … information blocks are transmitted. Accordingly, the intervals T*i = (τ2i-1, τ2i], i = 1, 2, ... are free from data transfer.
The traffic can then be described by the following expression, in which the summation is performed over all intervals during the traffic generation time (here and below, * is the multiplication sign):
where , Ai is the traffic value at i-th interval. If there are several traffic sources, the flows are summed up, and the expression for the total traffic is the sum
To set the traffic in the form of an interval model, it is necessary to determine the distributions of the duration of each of the two phases for each source, as well as to determine the value of the traffic Ai. In the future, when performing calculations and using fixed laws of distribution for the duration of the phases, a dimensionless parameter (source loading) ρ = T1 /T2 will be used, where T1 is the average duration of the packet transmission phase, aT2 is the mean time between packet arrivals.
The following procedure is used to model traffic. Let F(t) be the distribution function of the flow phase duration. If the traffic contains several phases, then each phase uses its own distribution function. The inverse function of F(t) is denoted by F-1 (ξ).
Based on the definition of the distribution function, if ξ is the random variable with a uniform distribution over an interval [0,1], then the variable τ = F-1 (ξ) will have the distribution F(t). When modeling traffic, the random duration for each i-th phase τi is sequentially generated. The traffic models under consideration are cyclical, with each cycle containing M consecutive phases. The moments θij of the completion of the i-th phase in the j-th cycle represent a time series that models the traffic.
The theory of self-similar processes defines several parameters that characterize these processes. In the future, different traffic models will be compared using two of the most informative characteristics: the Hurst exponent and the total autocorrelation coefficient.
There are many methods for determining the Hurst exponent, a detailed review of which is provided in (Zhang et al. 2023). However, with respect to the analysis of internet traffic models, the most suitable method is the R/S analysis method proposed by Hurst, as it requires minimal initial assumptions about the nature of the processes being studied and is not sensitive to the nature of the distribution functions of the processes being studied. (Li and Chen 2001; Zhao et al. 2015).
According to this method, a sample is taken from the initial random process: a time series of N+1 elements, denoted by U(t), t = 1, 2…N). Next, the differences x(t) = U(t+1) – U(t) are found, divide the series is divided into K adjacent periods of length τ so K * τ = N, and for each period the average value is found:
where j =1,2, …, K.
Now, for each period, the accumulated deviations from the mean are determined:
For each period, the range of the cumulative series R (j, τ) and the sample standard deviation S (j, τ) are calculated:
The normalized average range of the cumulative series is then determined as follows:
Next, a regression line is constructed using the least squares method for the dependent variable log(R/S) and the independent variable log (τ), in this case, the slope of the regression line provides an estimate of the Hurst exponent. It should be noted that according to the R/S analysis method, several interrelated parameters are used to estimate the Hurst exponent. These parameters primarily include the sample size N, the period size τ and the number of periods K (K * τ = N). Since the magnitude and the number of cycles are divisors of the number of samples N, the choice of this number significant impacts the number of cycles and the size of each cycle. For this reason, when performing calculations, the sample size N was chosen so that its divisors were as large as possible.
Additionally, an important parameter in this case is Nmin: the minimum number of elements in the series included in one period. On the one hand, the value of this parameter determines some statistical stability of the obtained estimate and therefore should be large enough, while and on the other hand, it determines the time interval in which the self-similarity properties are manifested.
Another important parameter for the quantitative measurement of point traffic is the average packet arrival rate V(t): the average number of traffic packets over a certain time interval ∆t. Fixing ∆t, the number of packets received N(∆t) is defined on each interval (ti, ti+∆t) Due to the random nature of packet arrival, the speed V(t) = N(∆t)/ ∆t will depend on the statistical properties of the traffic, the interval ∆t and the current time ti.
The second important characteristic of self-similar processes is that the sample autocorrelation function R(k) traffic is not summable, and the series formed by successive values of the autocorrelation function (the total autocorrelation coefficient Rsum), diverges:
The divergence of the series can be considered as a definition of long-term dependence, and almost all self-similar processes have this property. The presence of long-term dependence is the cause of long pulsations that exceed average traffic levels, which leads to buffer overflows and causes packet losses and/or delays.
The sample autocorrelation function R(k) calculated using standard formulas for time series (Brockwell and Davis 2016; Ruppert 2004):
When calculating R(k) It should be remembered that with increasing k number (k – m) pairs of observations U(k) and U(m+k) decreases, so the lag value m must be such that the number (k – m) is sufficient to determine the autocorrelation function. Usually, they are guided by the ratioе m <k/4. Summation R(k) to receive Rsum is performed for all k satisfying this condition.
RESULTS
First, the main results of the calculations of the characteristics of single point flows will be presented. It will be shown that the actual traffic parameters for them differ from the theoretical values. In particular, the value of the Hurst exponent depends significantly on the average packet arrival rate. The results of calculations of the characteristics of total point flows and intermittent flows (ON/OFF model) will also be presented. Next, the results of the study of interval flows for different distributions of time between packets and packet sizes will be presented. It will be shown that such flows have the property of self-similarity for almost any laws of distribution of time between packets and packet sizes, including exponential ones.
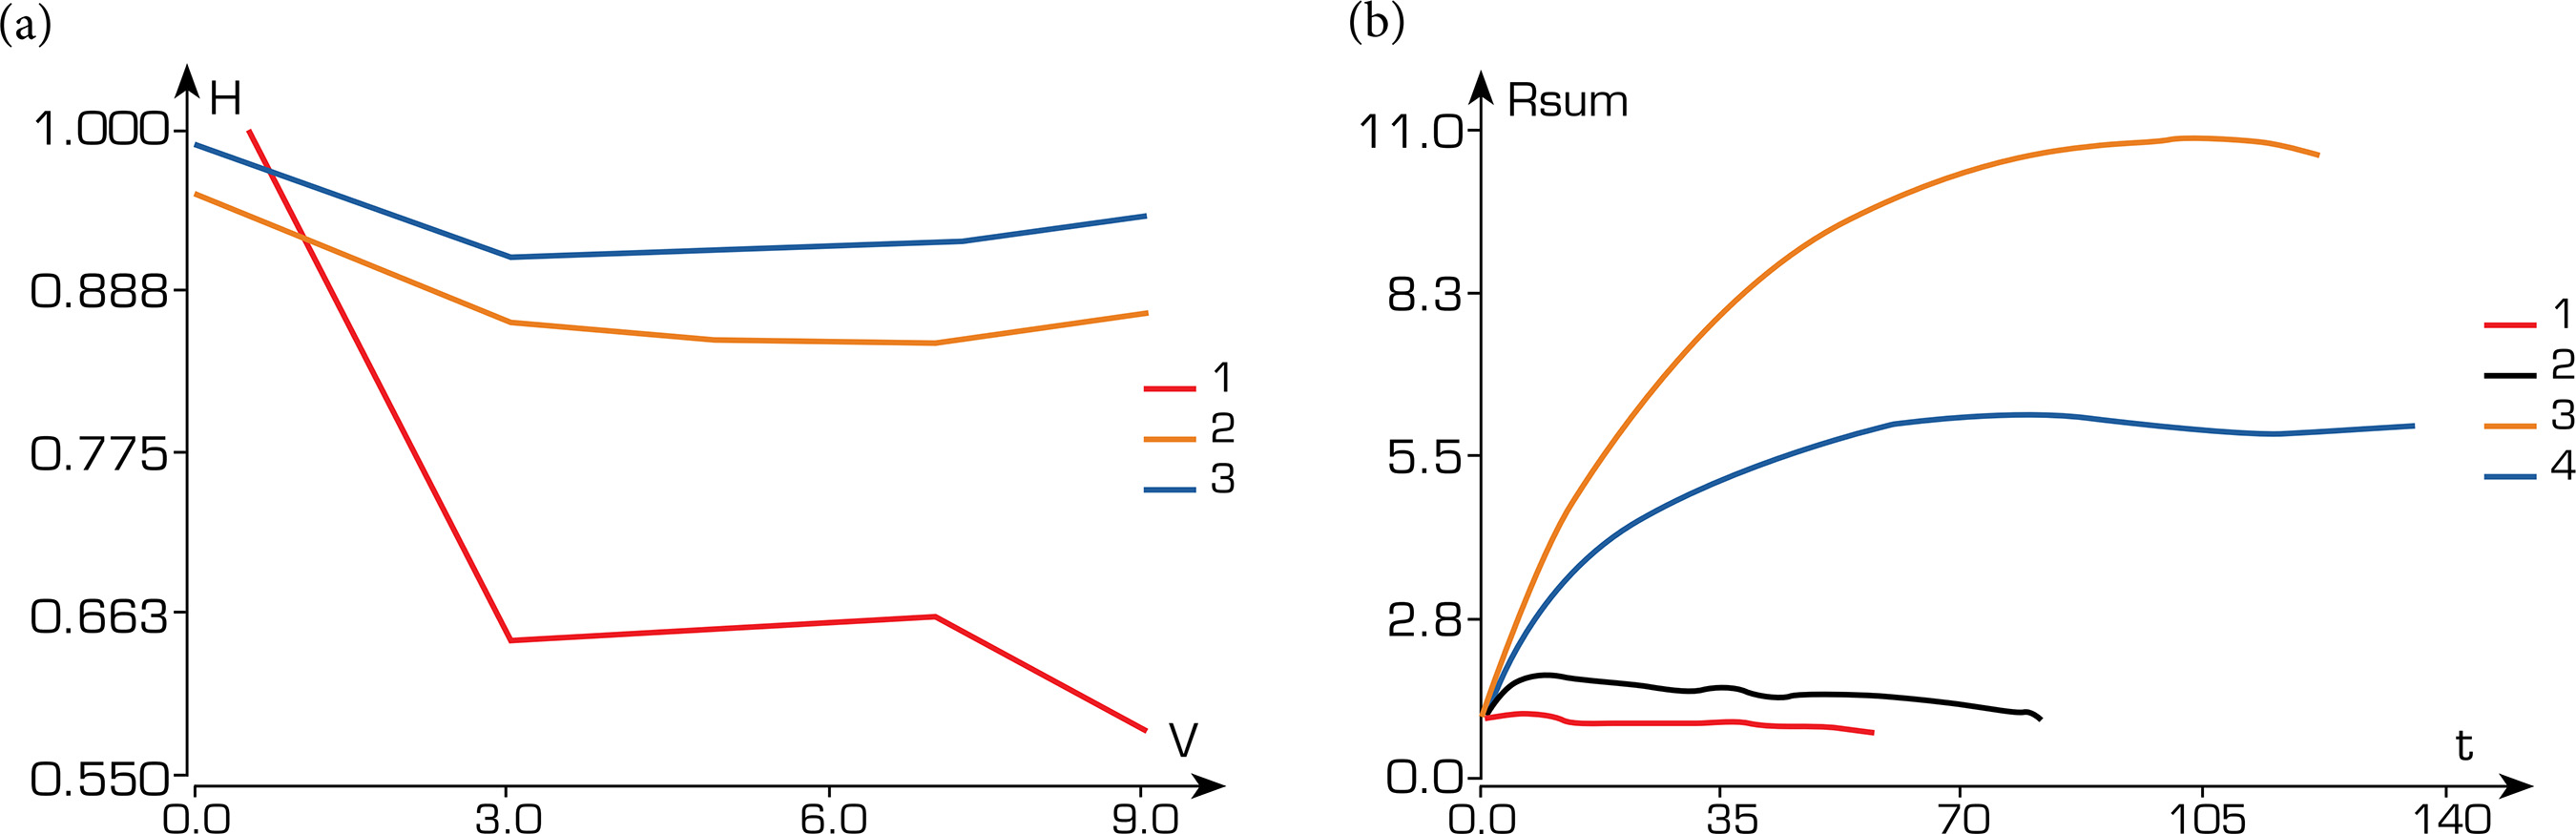
Figure 3 shows the dependences of the Hurst exponent and the total autocorrelation coefficient for three continuous point flows, where V is the average packet arrival rate (the average number of traffic packets over a certain time interval ∆t). The stepped nature of the graphs here and below is explained by the fact that the parameters along the X-axis in the calculations were discrete quantities, and the values of the corresponding functions along the Y-axis were subject to linear interpolation. In particular, here and below, the values of the quantity t are discrete and correspond to the number of the member of the corresponding numerical series.
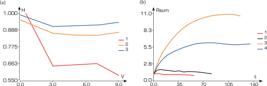
Dependences of the Hurst exponent and the total autocorrelation coefficient for continuous point flows.
Figure 3a characterizes the dependence of the Hurst exponent on the value of V for the Poisson flow (1), the Pareto flow (2) with НТ = 0.9, and power flow (3) with НТ = 0.9 (the subscript “T” denotes the theoretical value). From the obtained dependencies it follows that at V = 1 the Hurst exponent for the simplest flow is close to one, and the Poisson flow approaches its theoretical value H = 0.5 with increasing V. As for the other two flows, with increasing V the experimental values of the Hurst exponent sharply decrease from one to its stable value. As the results of the conducted modeling have shown, the self-similarity properties of these flows depend on the traffic processing technique used, as well as on the parameters of the tools used, such as the volume of traffic measurements, the minimum summation interval Nmin, the time interval ∆t, etc. The dependences of the total autocorrelation coefficient for different flows are shown in the Fig. 3b, where 1 is the Poisson flow, 2 and 3 are the Pareto flow with Н = 0.6 and Н = 0.9 respectively, and 4 is a power-law flow with Н = 0.9. The graphs provided clearly show the difference in the self-similarity properties of the point flows considered. It follows from the presented materials that the experimental values of Н are usually less than the theoretical value НТ. In this case, the values of the Hurst exponent are unstable and can vary widely from experiment to experiment, while the total autocorrelation coefficient behaves more stably in this regard.
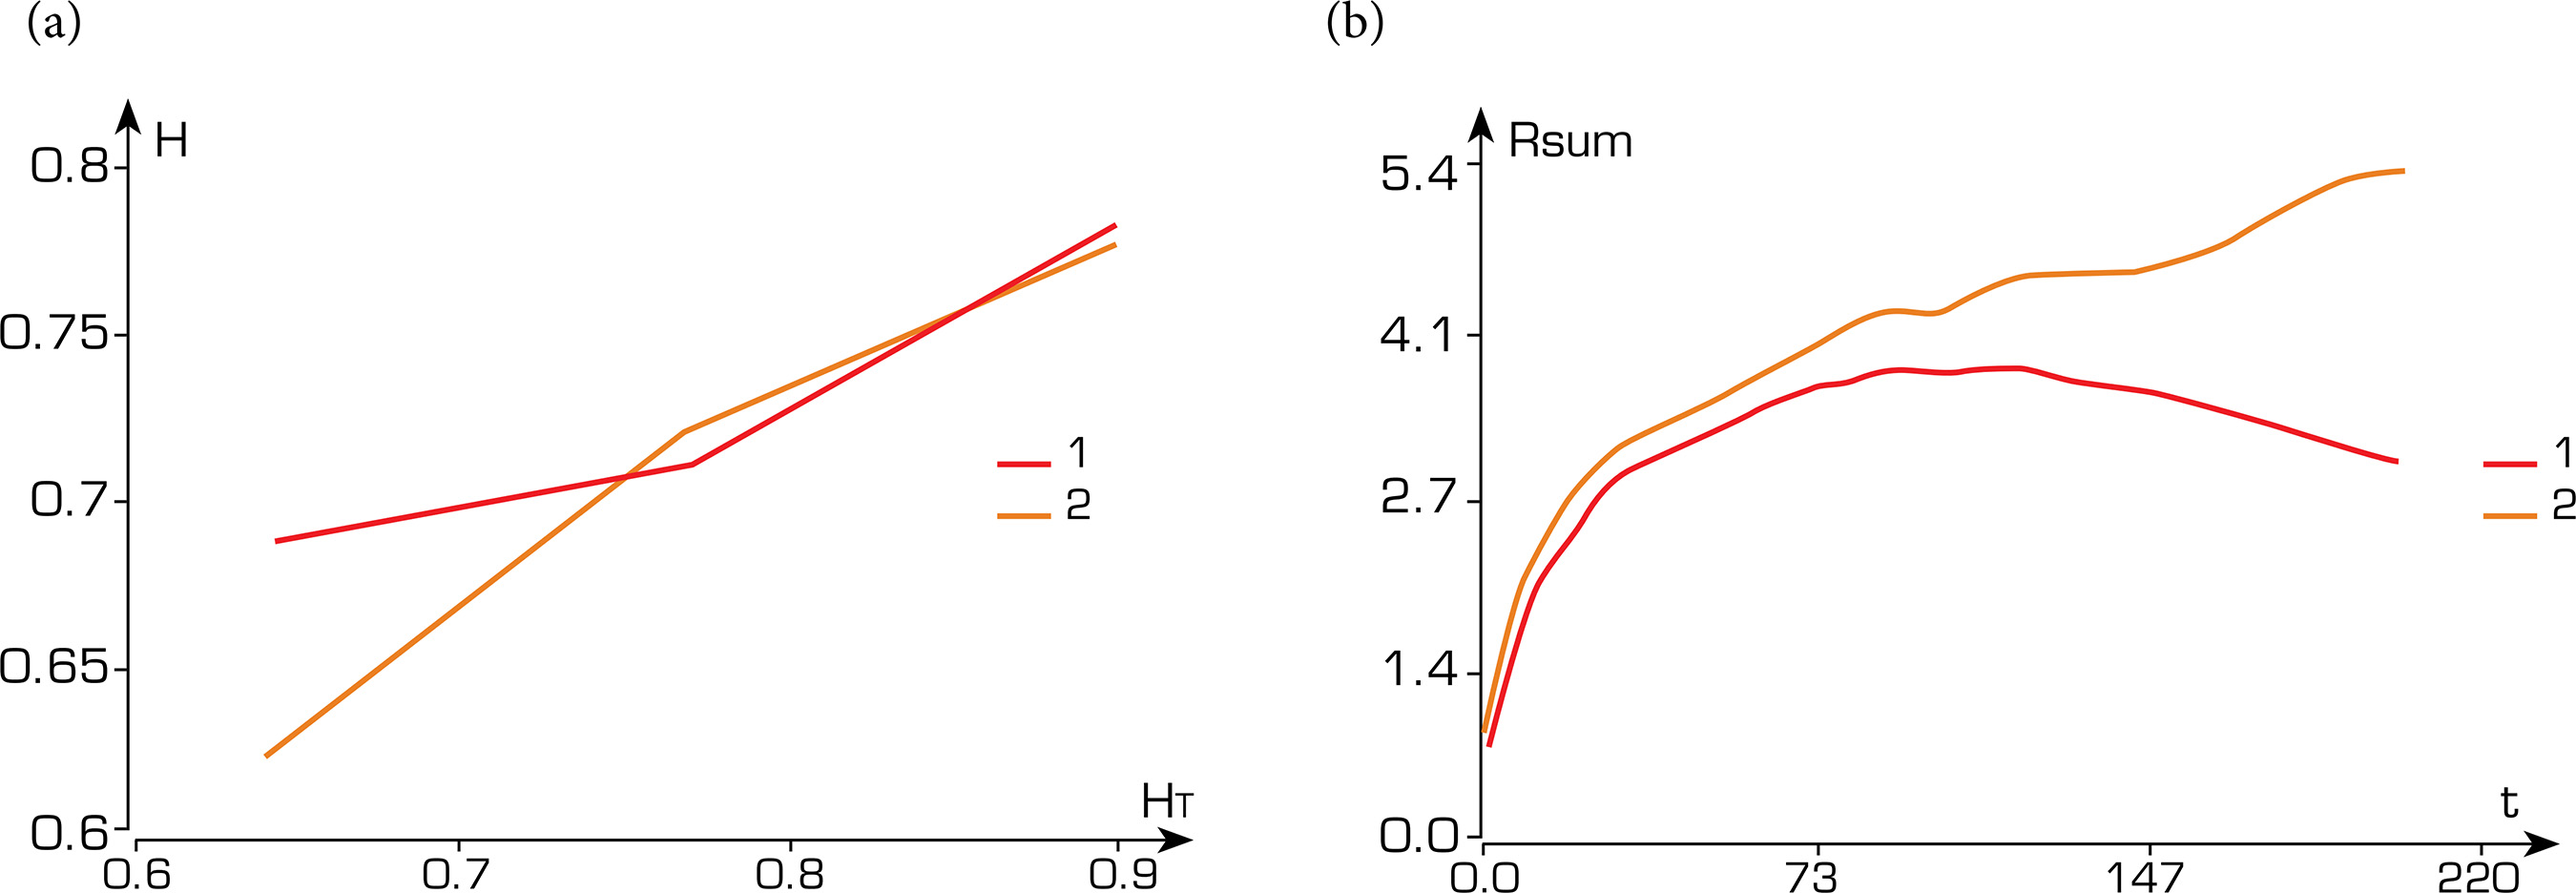
Also, the characteristics of the total flow formed by several self-similar processes are of interest. Such dependencies of Н (Fig. 4a) and Rsum (Fig. 4b) for the case of 20 independent sources are shown in the Fig. 4 for the Pareto flow (1) and the power flow (2) at НТ = 0.75. From the given dependencies, it follows that the total power flow is characterized by an increasing Rsum, which indicates that the total flow retains the properties of self-similarity. In contrast, the total Pareto flow has a decreasing autocorrelation coefficient with increasing time, indicating that the self-similarity property is less pronounced in it.
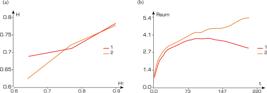
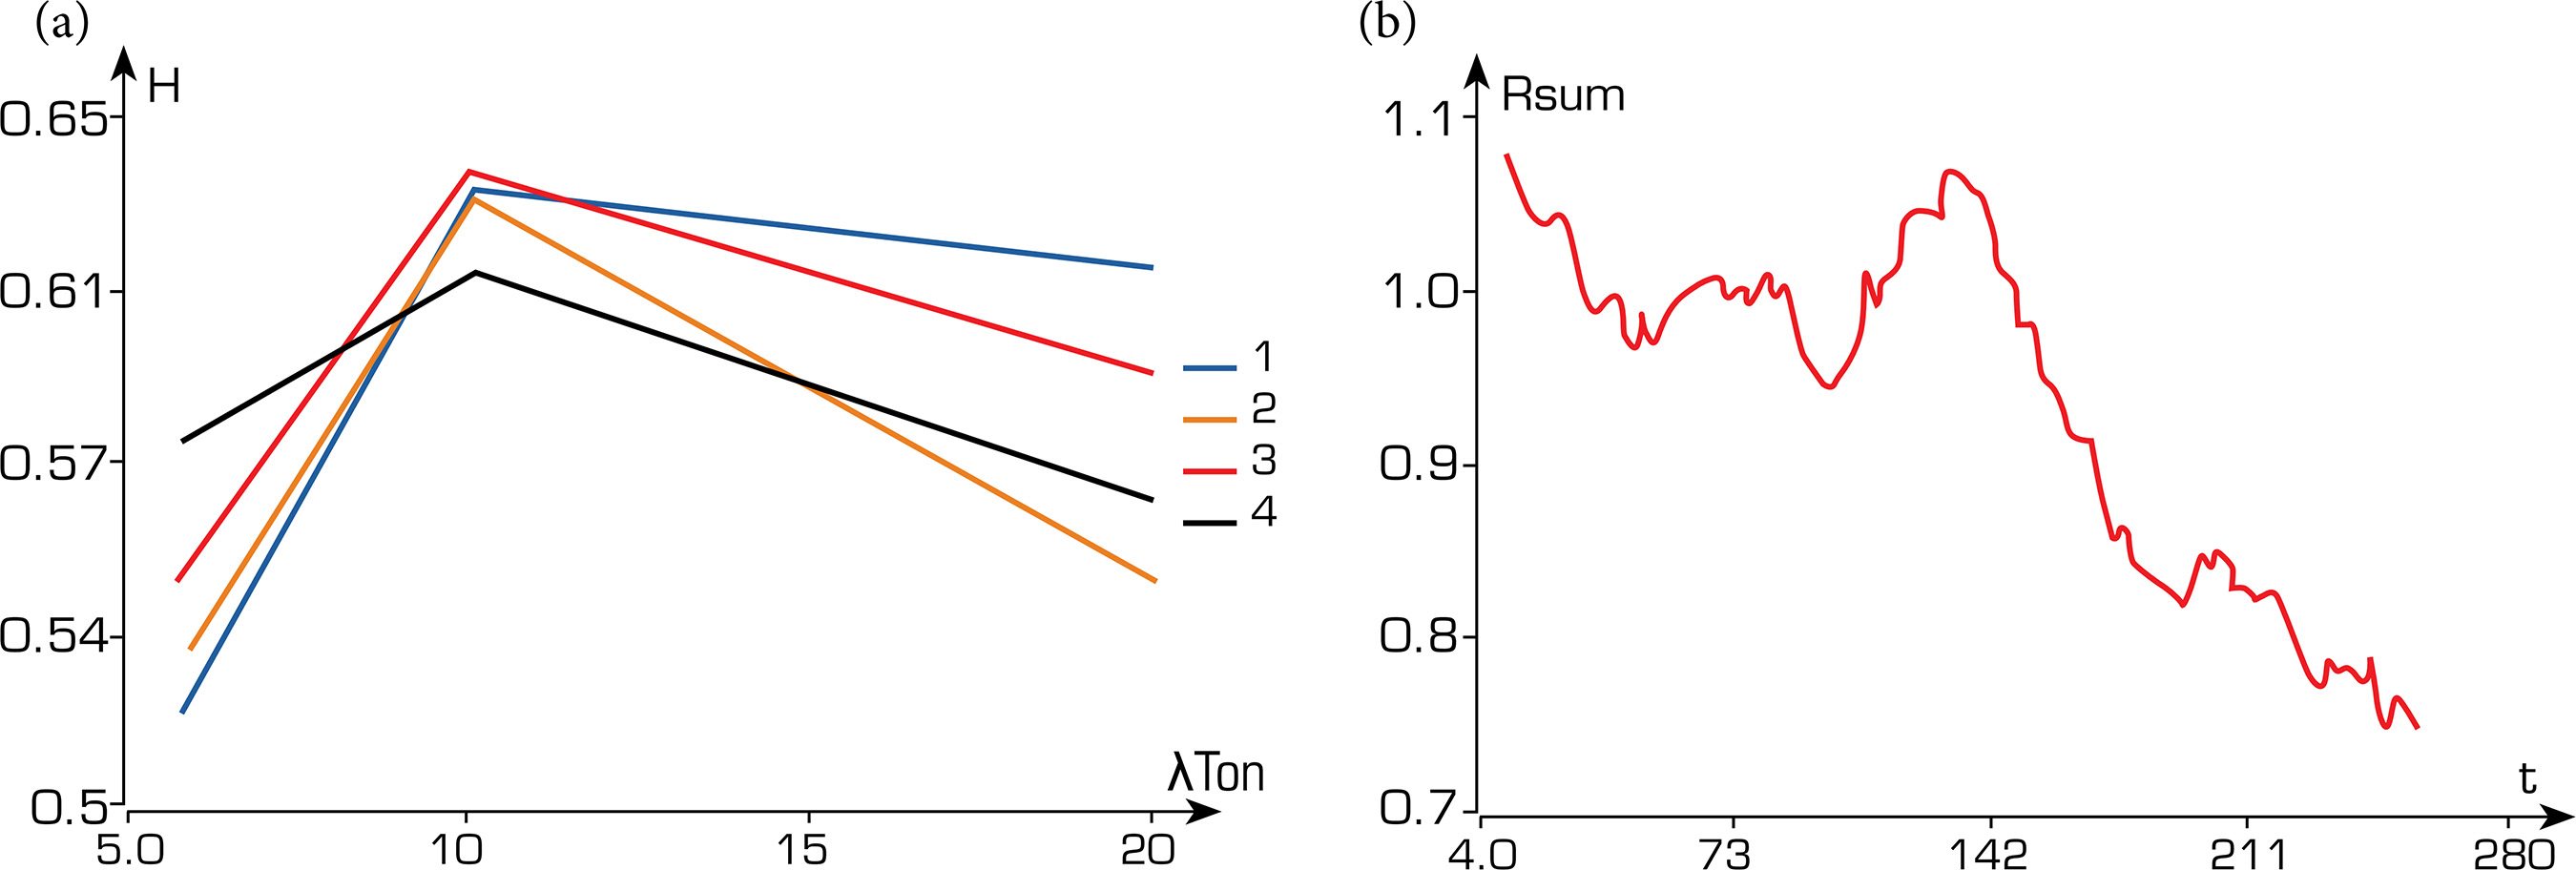
Intermittent flows are determined by the number of processes (in the basic model from 1 to 4), the laws of distribution of the time spent in ON/OFF states, and the intensity of packet arrival in the ON state. The average values of the specified quantities are specified by tables of basic values, and the time spent in ON/OFF states is distributed according to an exponential law. As an example, Figs. 5a and b show the dependences of the Hurst exponent and Rsum for the basic model 1IPP, where the following designations are adopted: λ is the base packet arrival rate, Ton is the average time spent in the ON state, and Кon/off is the proportion of time spent in the ON state relative to the total time of traffic generation (1 – Кon/off = 0.1, 2 – Кon/off = 0.429, 3 – Кon/off = 0.5, 4 – Кon/off = 0.8).
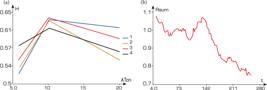
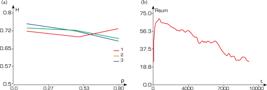
As is follows from Fig. 5, for the 1IPP model, the Hurst exponent weakly depends on the state parameters and generally varies in the range from 0.5 to 0.63, with an average value of 0.55-0.6. Thus, the use of only one interruptible process does not allow obtaining high values of the Hurst exponent, close to those values observed in real processes. The dependence of the total autocorrelation coefficient confirms the conclusion that the self-similarity properties are relatively weak for the 1IPP model. As the experimental results have shown, an increase in the number of processes in the intermittent flow model leads to an increase in the Hurst exponent: the use of models with two processes (2IPP) and higher allows obtaining values of the Hurst exponent corresponding to the properties of real processes. At the same time, high autocorrelation properties are manifested only for models with three or more processes. For the interval model, the main parameters are the distribution laws of each of the two phases, the ratio between the average durations of each phase (loading ρ = T1/T2, where T1 is the average duration of the packet transmission phase, T2 is the average time between packet arrivals), as well as the number of sources Ns. Figures 6a and b show the dependences of the Hurst exponent on the load for different numbers of sources (1, 2, 3 – Ns = 5, 10, 20, respectively) and Rsum with Ns = 5, obtained with exponential laws of distribution of the duration of each phase. As the calculation results showed, interval flows have a high value of the Hurst exponent even with exponential laws of distribution of phase durations. As for the number of sources, with a small number of them (about 5-10), the Hurst exponent is practically independent of the load, and with an increase in the number of sources, the value of the Hurst exponent decreases.
DISCUSSION
In the process of converting the original subscriber traffic into network traffic, not only does the volume of transmitted information change, but there are also qualitative changes in the traffic due to the addition of service information, receipts, etc. The combination of these factors leads to a violation of the homogeneity of traffic, which can presumably have self-similarity properties. In order to verify this, the authors simulated a network with a random-access protocol, Carrier Sense Multiple Access with Collision Detection (CSMA/CD) (IEEE 2000).
As a basis for the simulation model of a network with CSMA/CD, a previously tested simulation model of an IoT network with acknowledgement and the CSMA/CA algorithm (Borodin et al. 2023), which showed good results, was chosen. This simulation model was modified to account for the features of the CSMA/CD algorithm, which made it possible to consider information and service traffic, as well as the parameters of the traffic generated by network subscribers. It is important to note that such a simulation model of a network with a single channel allows accounting for the specific protocols of the physical and link layers in a generalized form. The presence of access procedures to a single channel leads to the emergence of heterogeneous traffic, in which the moments of the appearance of data blocks and their duration are important. That is why the presented model is fundamentally different from the simplest queuing system, which is traditionally used to evaluate the parameters of data transmission networks. The simulation model of the CSMA/CD network contains three main blocks:
-
• A block of initial data in accordance with the open system interconnection (OSI) model, which determines the network parameters at the physical layer (number of network subscribers, channel energy characteristics, channel multiplexing methods, etc.) and at the link layer (multiple access methods, acknowledgement methods, service channel parameters, etc.);
-
A block for network behavior modeling based on events over a given time interval, which determines the characteristics of the traffic generated by subscribers (intensity of transmission requests and volume of transmitted data), channel capacity, packet retransmission time in case of a collision in the channel, and communication channel noise characteristics;
-
A block for displaying modeling results display, which, as applied to the problem solved in this article, generates network traffic values as a time series over a given time interval.
The simulation was performed with the following initial data. The network consists of identical nodes, each of which forms a random Poisson flow of variable-length packets with a given distribution law. The CSMA/CD procedure is used to transmit packets over a common communication channel, according to which, after the channel is released, each of the active nodes begins to transmit packets after a random time. The fact of successful packet transmission is acknowledged, and the absence of an acknowledgement within a given time is interpreted as packet distortion and leads to its repeated transmission after a random time. When performing the simulation, it was assumed that the signal propagation time along the communication channel is short and information about the channel state is instantly communicated to each node. The given simplifications, in particular, the Poisson model of subscriber traffic, the sameness of all nodes, and the negligible signal propagation time, were made deliberately to allow determining the effect of self-similarity of network traffic in its “pure form.”
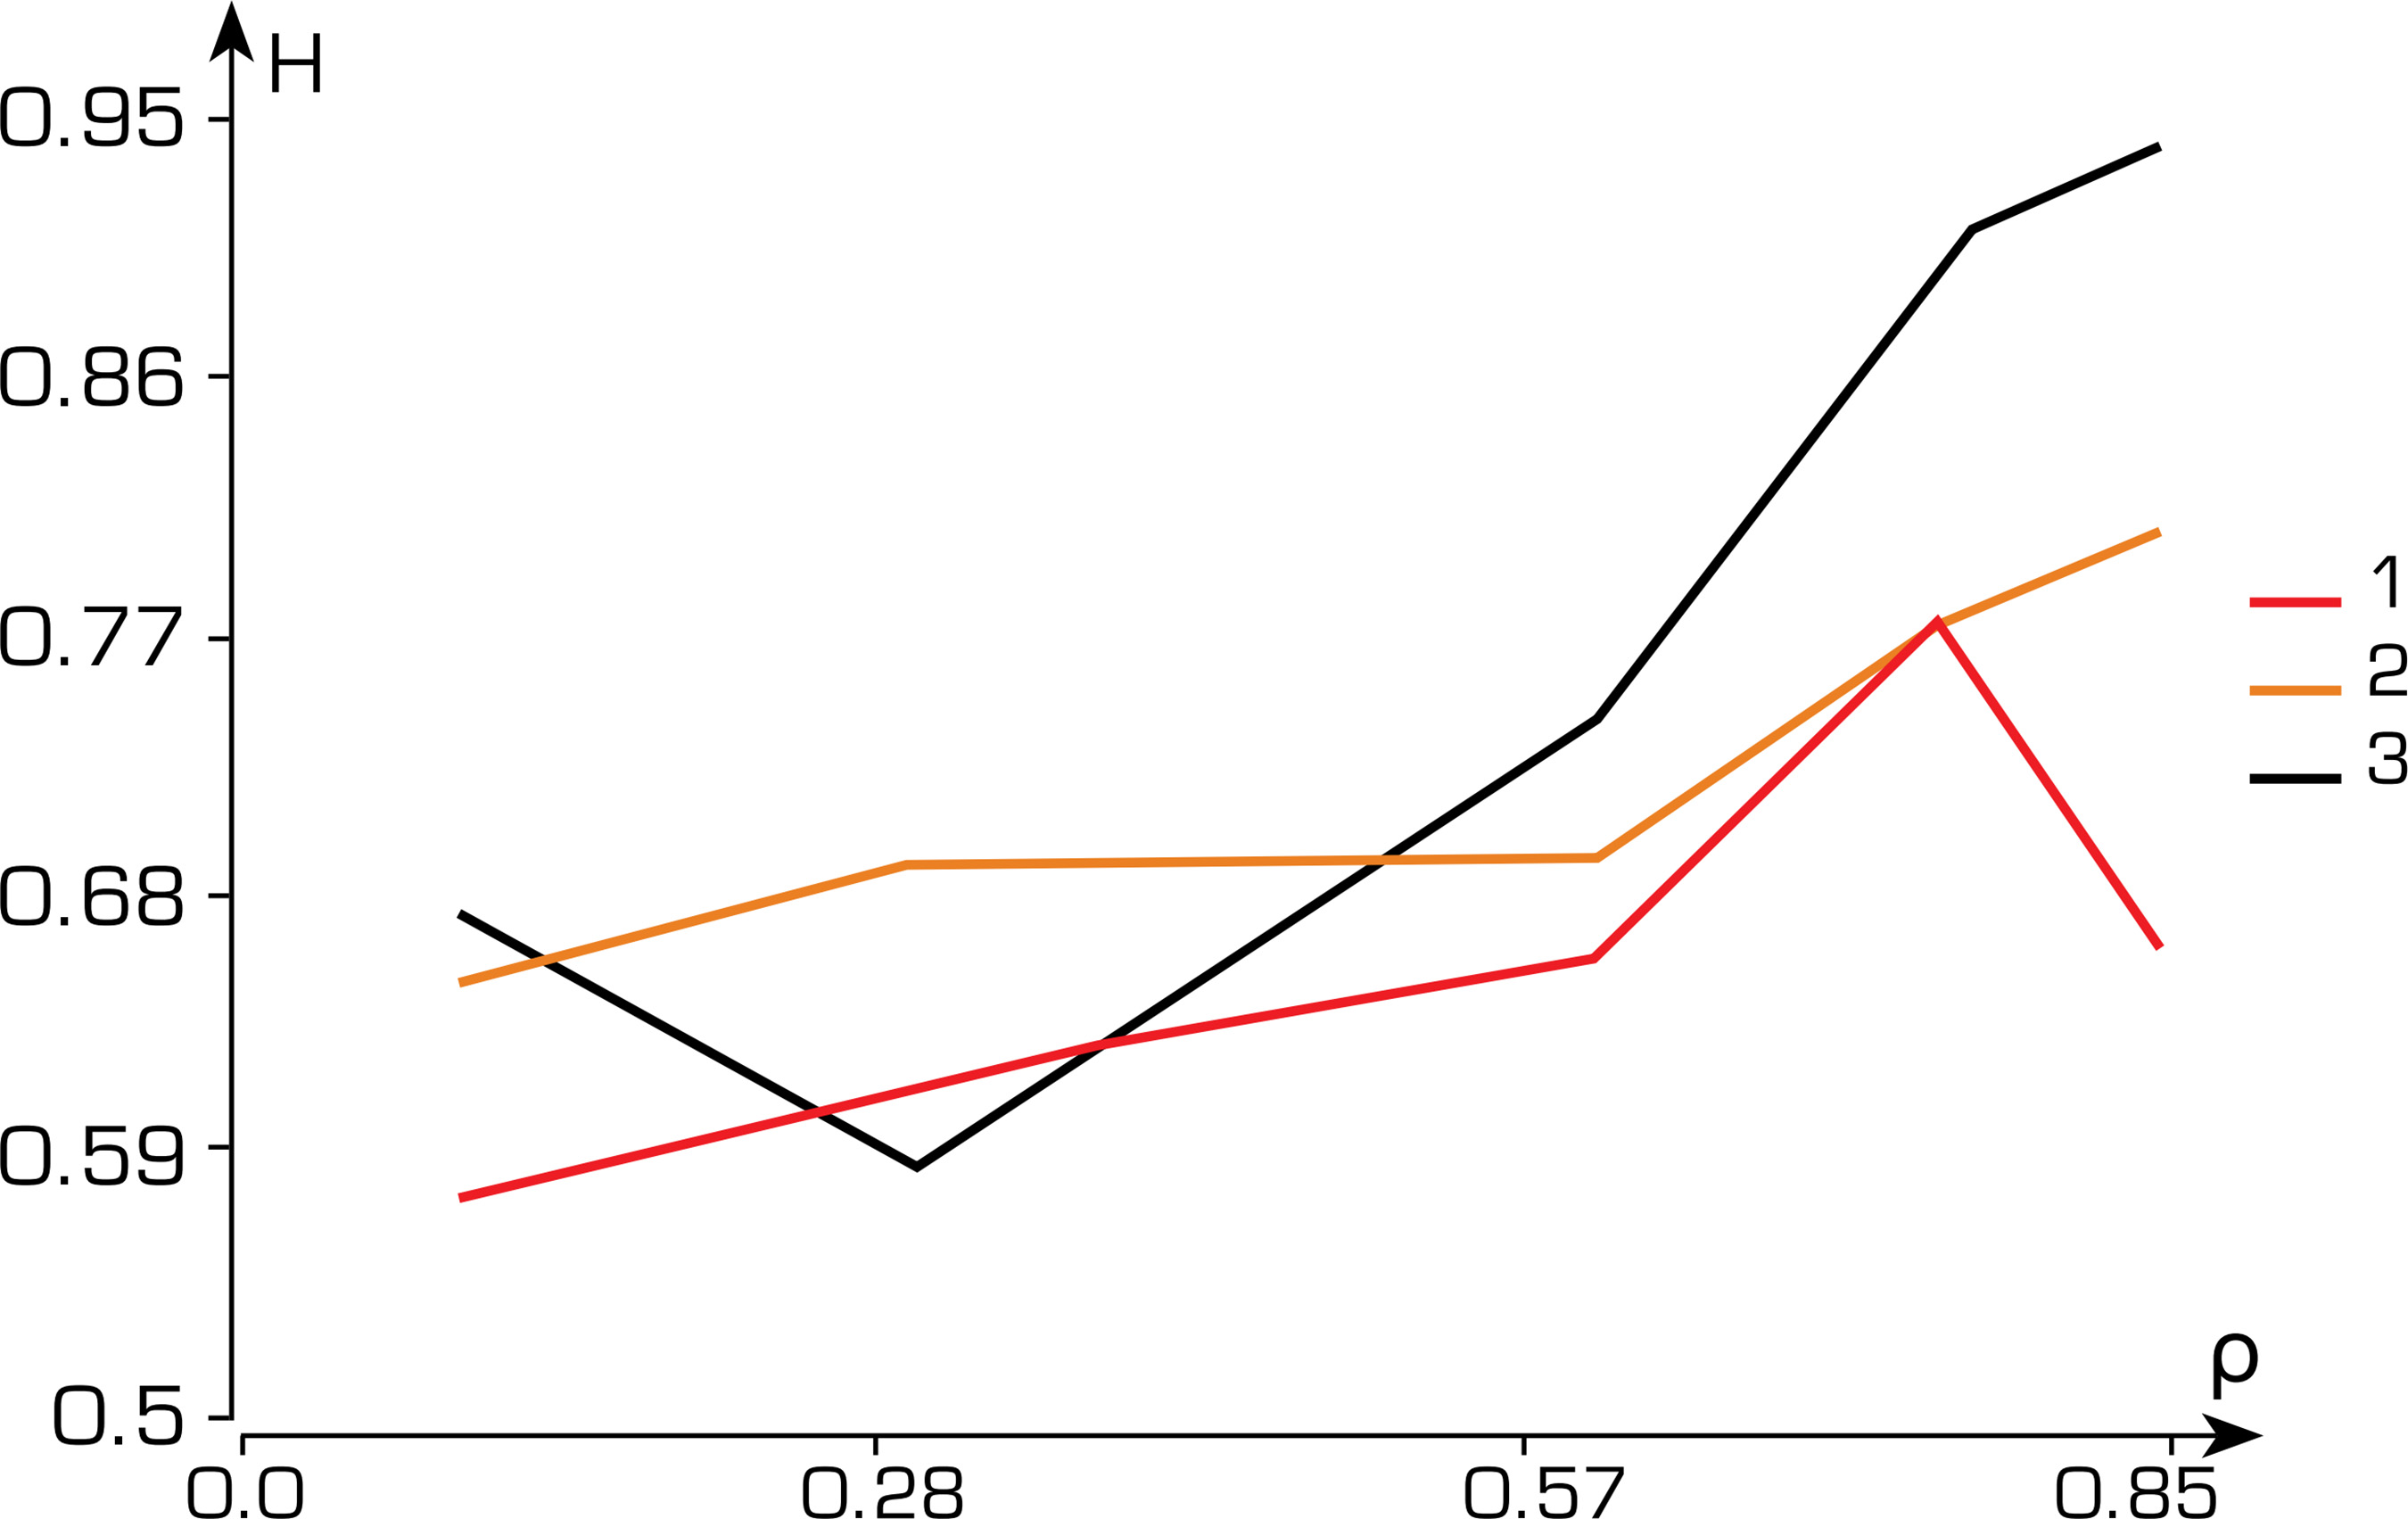
The divergence of the series is one of the indicators of long-term dependence, which is typical for most self-similar processes. The results of modeling the traffic of the CSMA/CD network presented below clearly demonstrate the presence of self-similarity properties of traffic in a communication channel even with a Poisson input packet flow. In particular, Fig. 7 shows the dependence of the Hurst exponent on the network load ρ for the case when each subscriber forms a Poisson flow of packets with a random size (the stepped nature of the graphs here and below is explained by the fact that the parameters along the X-axis in the calculations were discrete values, and the values of the corresponding functions along the Y-axis were subject to linear interpolation). The load is traditionally understood as the product of the total intensity of the packet flow and the average time of their transmission over the channel. The following were chosen as the packet size distribution functions: exponential distribution (curve 1), Pareto distribution with a theoretical value of the Hurst exponent equal to 0.6 (curve 2), and constant packet size (curve 3).
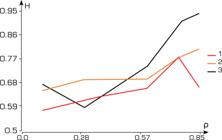
Dependence of Hurst exponent for different packet size distributions. Curve 1: exponential distribution; curve 2: Pareto distribution with a theoretical value of Hurst exponent equal to 0.6; curve 3: constant packet size.
The analysis of the presented dependencies allows making the following conclusions:
Even with an exponential distribution of the packet size, the Hurst parameter of the traffic in the communication channel is greater than 0.5, and with increasing load, the degree of self-similarity of the network traffic only increases;
The largest (of the considered options) value of the Hurst parameter is found in the network traffic in the case when transmission over the communication channel is carried out in packets of a fixed size.
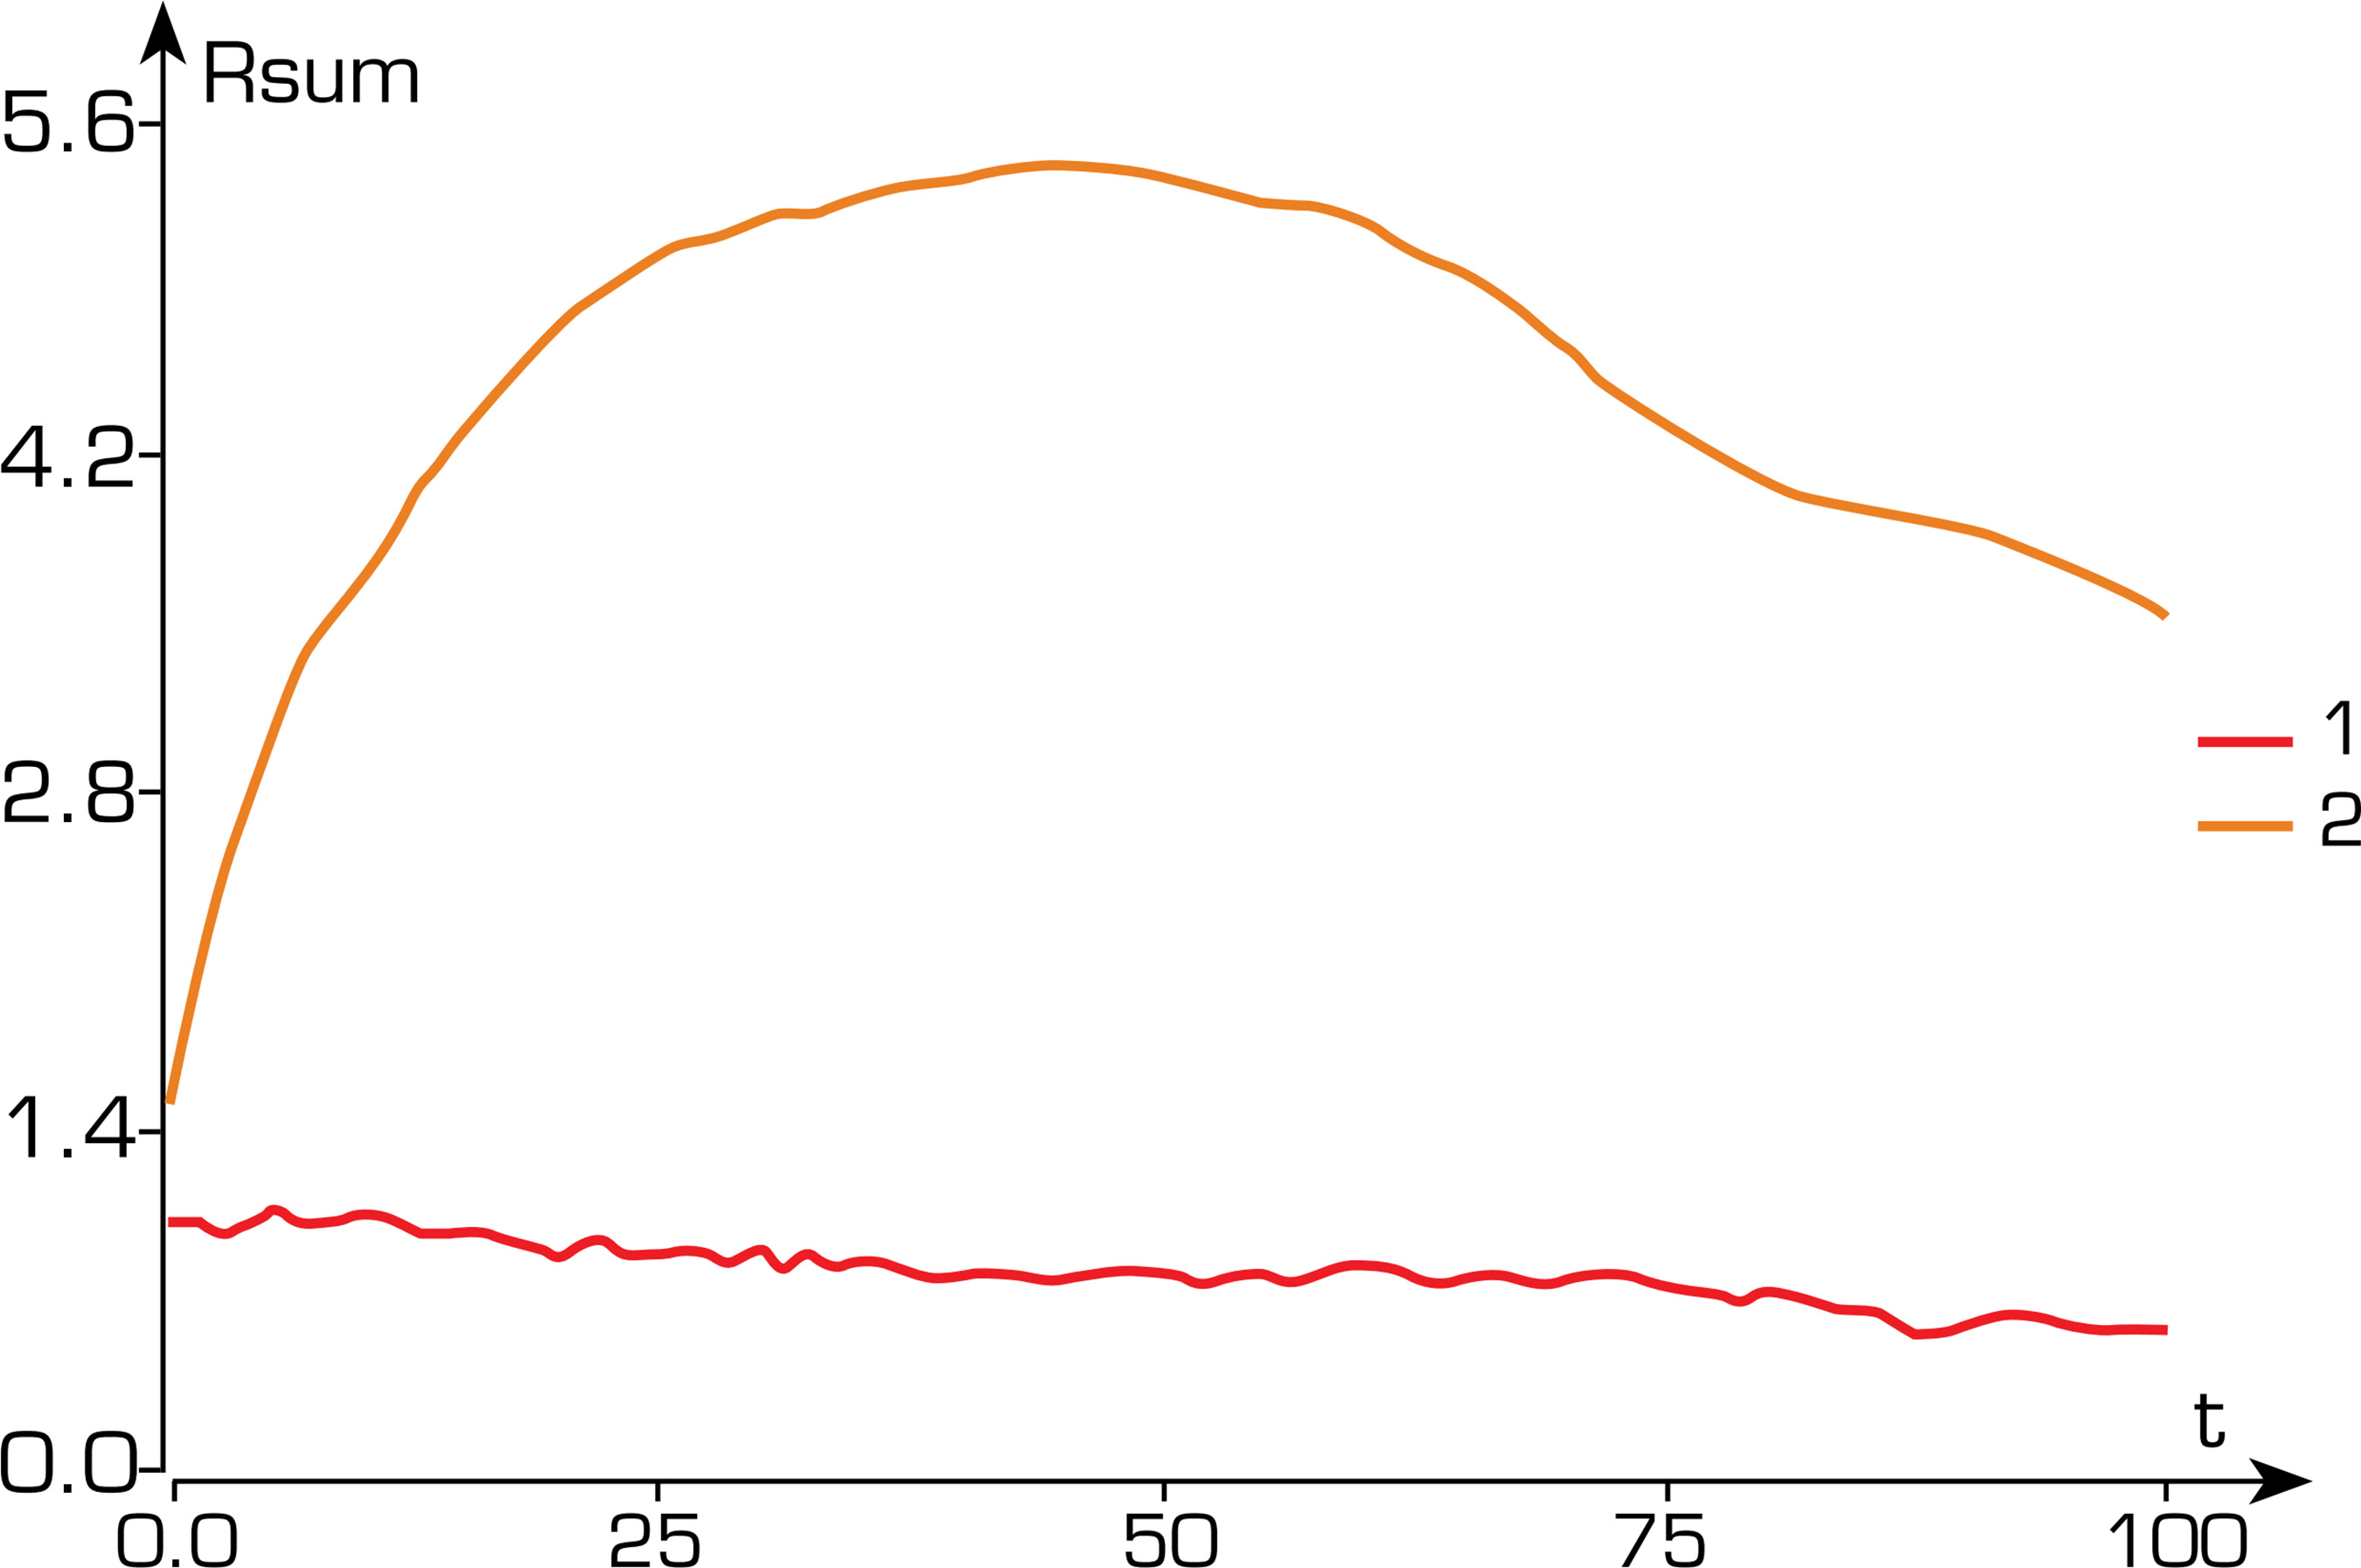
Figure 8 shows the dependence of the total autocorrelation coefficient of network traffic for a subscriber Poisson packet flow for different laws of packet size distribution. For clarity, the autocorrelation coefficient is determined for two boundary modes of network operation:
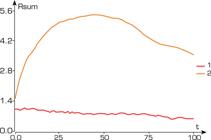
Dependence of the total autocorrelation coefficient on time for different laws of packet size distribution. Curve 1: exponential distribution of the packet size and low load; curve 2: deterministic packet size and high load.
-
Light mode (small value of Hurst parameter): exponential distribution of the packet size and low load (curve 1);
-
Heavy mode (large value of the Hurst parameter): deterministic packet size and high load (curve 2).
As it follows from the given dependencies, in the first case, the value of the total autocorrelation coefficient of network traffic continuously decreases over time, which corresponds to traffic that does not have self-similarity properties. In the second case, the value of the total autocorrelation coefficient of network traffic initially increases (which indicates that it has self-similarity properties), and then begins to gradually decrease. This is explained by the fact that over time the degree of self-similarity of the process weakens due to natural limitations on the size of packets. As the results of the experiments showed, the properties of network traffic also depend on the type of traffic generated by subscribers. In particular, replacing the Poisson subscriber flow with a Pareto flow also leads (all other things being equal) to an increase in the Hurst parameter and the total autocorrelation coefficient. In other words, the more uneven the subscriber flow, the higher the degree of self-similarity of network traffic.
CONCLUSION
One of the main problems in the design and operation of heterogeneous communication networks is the organization of measures to prevent overloads of network nodes due to the uneven nature of network traffic, which leads to data loss due to buffer overflow. As a part of solving this problem, the following actions were undertaken in this article:
A method for calculating the characteristics of network traffic models in the form of continuous and interrupted point processes, which represent a flow of zero-duration events with a random law of time distribution between events (packets), has been developed;
A model of network traffic in the form of an interval process, which, unlike known processes, allows modeling not only the moments of packet appearance, but also the size, transmission speed, and time parameters of packet transmission over communication channels, is proposed;
The results of the analysis of typical models of network traffic in the form of point and interval processes are presented, with the characteristics of which two main parameters were considered: the Hurst exponent and the total autocorrelation coefficient;
It is shown that for traffic models in the form of point continuous and intermittent flows, the actual self-similarity indicators differ from the theoretical ones;
It is shown that point and interval processes have the property of self-similarity, which confirms the possibility of using the considered typical traffic models for modeling heterogeneous networks;
Based on the conducted research, the possibility of using typical models for describing the traffic of single subscribers and group traffic is assessed;
A simulation model of a P2P network with the CSMA/CD random-access protocol has been developed to evaluate the characteristics of network traffic;
An analysis of network traffic characteristics has been performed for the Poisson model of subscriber traffic and various packet size distribution laws (exponential distribution, Pareto distribution, and fixed packet size);
The research results have shown that even with a Poisson input flow, network traffic exhibits self-similarity properties, so it is incorrect to use classical traffic models in the form of a simple flow when designing heterogeneous networks.
The following tasks are proposed as the main directions for further research:
-
Development of simulation models of a heterogeneous network that implement various protocols of the data link layer, network layer, and transport layer.
-
Study of the properties of self-similarity of traffic depending on the used protocols of the transport, network, and channel layers.
-
Research of traffic properties depending on the type of subscriber traffic, including the development of models of interdependent group subscriber access.
-
Study of the influence of network layer protocols (primarily routing methods) on the network traffic characteristics of an ad hoc network, in which subscribers are mobile and exchange information with each other via radio channels.
ACKNOWLEDGEMENTS
Not applicable.
-
FUNDING
Russian Science FoundationGrant No: 23-69-10084
-
Peer Review History
Single Blind Peer Review.
DATA AVAILABILITY STATEMENT
All data sets were generated or analyzed in the current study.
REFERENCES
-
Adas A (1997) Traffic models in broadband networks. IEEE Comm Mag 35(7):82-89. https://doi.org/10.1109/35.601746
» https://doi.org/10.1109/35.601746 -
Albuquerque M, Ayyagari A, Dorsett MA, Foster MS (2007) Paper presented 2007 Global Information Grid Edge Network Interface Architecture, MILCOM 2007. IEEE; Orlando, USA. https://doi.org/10.1109/MILCOM.2007.4455139
» https://doi.org/10.1109/MILCOM.2007.4455139 -
Alheraish A, Alshebeili S, Alamri T (2005) Regression video traffic models in broadband networks. J King Saud Univ - Eng Sci 18(1):19-55. https://doi.org/10.1016/S1018-3639(18)30820-1
» https://doi.org/10.1016/S1018-3639(18)30820-1 -
Anjum M, Anees T, Tariq F, Shaheen M, Amjad S, Iftikhar F, Ahmad F (2023) Space-air-ground integrated network for disaster management: systematic literature review. Appl Comp Intellig and Soft Comp 2023(1):6037882. https://doi.org/10.1155/2023/6037882
» https://doi.org/10.1155/2023/6037882 -
Arum S, Grace D, Mitchell P (2020) A review of wireless communication using high-altitude platforms for extended coverage and capacity. Comp Comm 157:232-256. https://doi.org/10.1016/j.comcom.2020.04.020
» https://doi.org/10.1016/j.comcom.2020.04.020 - Baugh C, Huang J (2001) Traffic model for 802.16 TG3 MAC/PHY simulations. IEEE Contribution 802.16.3c-01/30r1;27.
- Becchi M (2008) From Poisson processes to self-similarity: a survey of network traffic models. St. Louis: Washington University in St. Louis.
-
Bhati D, Pavan B, Aradhye G (2023) On a new mixed Pareto – Weibull distribution: its parametric regression model with an insurance applications. Annals of Data Sci 11:2077-2107. https://doi.org/10.1007/s40745-023-00502-3
» https://doi.org/10.1007/s40745-023-00502-3 -
Borodin V, Kolesnichenko V, Shevtsov V (2023) Analysis of the efficiency of various receipting multiple access methods with acknowledgement in IoT networks. Invent 8:105. https://doi.org/10.3390/inventions8040105
» https://doi.org/10.3390/inventions8040105 - Brockwell PJ, Davis RA (2016) Introduction to time series and forecasting. New York: Springer.
- Chandrasekaran B (2009) Survey of network traffic models. St. Louis: Washington University in St. Louis.
-
Chechin G, Kolesnichenko V (2024) Comparative analysis of options for organizing Internet traffic exchange in territorially distributed communication network. J Aerosp Technol and Manag 16:e2124. https://doi.org/10.1590/jatm.v16.1341
» https://doi.org/10.1590/jatm.v16.1341 -
Chechin GV, Kalyagin MY, Kolesnichenko VE, Zamkovoi AA (2023) Organization of communication with the unmanned aerial vehicle in a combined data transmission network. J Aerosp Technol Manag 15:e2923. https://doi.org/10.1590/jatm.v15.1311
» https://doi.org/10.1590/jatm.v15.1311 -
Chechin GV, Kolesnichenko VE, Selin AI (2022) Use of unmanned aerial systems for communication and air mobility in Arctic region. Adv Aircr Spacecr Sci 9(6):525-536. https://doi.org/10.12989/aas.2022.9.6.525
» https://doi.org/10.12989/aas.2022.9.6.525 -
Chen J, Zhang H, Xie Z (2023) Space-air-ground integrated network (SAGIN): a survey. arXiv:2307.14697. https://doi.org/10.48550/arXiv.2307.14697
» https://doi.org/10.48550/arXiv.2307.14697 -
Choi H-H, Zhang J, Geng Y, Xiao Z, Sun T, Zhang N, Liu J, Wu Q, Cao X (2022) Space-air-ground integrated network (SAGIN) for 6G: requirements, architecture and challenges. China Comm 19(2):90-108. https://doi.org/10.23919/JCC.2022.02.008
» https://doi.org/10.23919/JCC.2022.02.008 -
Crovella M, Bestavros A (1996) Self-similarity in world wide web traffic: evidence and possible causes. IEEE/ACM Transact on Network 5(6):835-846. https://doi.org/10.1109/90.650143
» https://doi.org/10.1109/90.650143 -
Dang TL, Sonkoly B, Molnár S (2004) Fractal analysis and modeling of VoIP traffic. Paper presented 2004 11th International Telecommunications Network Strategy and Planning Symposium Networks. IEEE; Vienna, Austria. https://doi.org/10.1109/NETWKS.2004.240805
» https://doi.org/10.1109/NETWKS.2004.240805 -
Dobrescu R, Hossu D, Ulrich R (2009) Self-similarity tests for internet traffic. Contr Engin and Appl Inform 11(4):11-17. https://www.researchgate.net/publication/267421021_Self-similarity_Tests_for_Internet_Traffic
» https://www.researchgate.net/publication/267421021_Self-similarity_Tests_for_Internet_Traffic -
Ericsson (2023) Ericsson mobility report. [accessed Nov 06 2024]. https://d110erj175o600.cloudfront.net/wp-content/uploads/2023/06/21123003/Ericsson-Mobility-Report-June-2023.pdf
» https://d110erj175o600.cloudfront.net/wp-content/uploads/2023/06/21123003/Ericsson-Mobility-Report-June-2023.pdf -
Exactitude Consultancy (2023) Exactitude consultancy report. [accessed June 21 2023]. https://exactitudeconsultancy.com/reports/20229/web-3-0-market/
» https://exactitudeconsultancy.com/reports/20229/web-3-0-market/ -
Faloutsos M, Faloutsos P, Faloutsos C (1999) On power-law relationships of the internet topology. Comp Commun Rev 29(4):251-262. https://doi.org/10.1145/316188.316229
» https://doi.org/10.1145/316188.316229 -
Gebali F (2015) Analysis of computer networks. Cham: Springer Cham. https://doi.org/10.1007/978-3-319-15657-6
» https://doi.org/10.1007/978-3-319-15657-6 - Halgamuge SK, Wang L (2005) Computational intelligence for modelling and prediction. New York: Springer Science & Business Media.
-
Hiremath B, Kenchakkanavar A (2016) An alteration of the Web 1.0, Web 2.0 and Web 3.0: a comparative study. Imper J of Interdisc Res 2:705-710. https://doi.org/10.1109/ICOIN53446.2022.9687180
» https://doi.org/10.1109/ICOIN53446.2022.9687180 -
Hua DT, Lakew DS, Cho S (2022) DRL-based energy efficient communication coverage control in hierarchical HAP-LAP network. Paper presented 2022 International Conference on Information Networking. IEEE; Jeju-si, South Korea. https://doi.org/10.1109/ICOIN53446.2022.9687180
» https://doi.org/10.1109/ICOIN53446.2022.9687180 -
Hubenko VP, Raines R, Mills R, Baldwin R, Mullins B, Grimaila M (2006) Improving the global information grid’s performance through satellite communications layer enhancements. IEEE Commun Mag 44:66-72. https://doi.org/10.1109/MCOM.2006.248167
» https://doi.org/10.1109/MCOM.2006.248167 - Hurst HE, Black RP, Simaika YM (1965) Long-term storage: an experimental study. London: Constable.
-
[IEEE] Institute of Electrical and Electronics Engineers (2000) IEEE Standard for Information Technology – LAN/MAN – Specific requirements – Part 3: Carrier Sense Multiple Access with Collision Detection (CSMA/CD) access method and physical layer specifications. IEEE Std 802.3:1-1554. https://doi.org/10.1109/IEEESTD.2000.91946
» https://doi.org/10.1109/IEEESTD.2000.91946 - Janevski T (2003) Traffic analysis and design of wireless IP networks. Norwood: Artech House Publishers.
-
Joshi M, Hadi TH (2015) A review of network traffic analysis and prediction techniques. ArXiv:1507.05722. https://doi.org/10.48550/arXiv.1507.05722
» https://doi.org/10.48550/arXiv.1507.05722 -
Kassim M, Ismail M, Yusof M (2015) Statistical analysis and modeling of internet traffic IP-based network for teletraffic engineering. ARPN J Eng and Appl Sci 10(3):1505-1512. https://www.researchgate.net/publication/274700383_Statistical_analysis_and_modeling_of_internet_traffic_IP-based_network_for_tele-traffic_engineering
» https://www.researchgate.net/publication/274700383_Statistical_analysis_and_modeling_of_internet_traffic_IP-based_network_for_tele-traffic_engineering - Kleinrock L (1975) Queuing system. New York: John Wiley & Sons. Volume 1, Theory.
-
Leland WE, Taqqu MS, Willinger W, Wilson DV (1994) On the self-similar nature of Ethernet traffic (extended version). IEEE/ACM Transact on Netw 2(1):1-15. https://doi.org/10.1109/90.282603
» https://doi.org/10.1109/90.282603 -
Li J, Chen Y (2001) Rescaled range (R/S) analysis on seismic activity parameters. Acta Seismol Sinica 14:148-155. https://doi.org/10.1007/s11589-001-0145-9
» https://doi.org/10.1007/s11589-001-0145-9 -
Liu J, Shi Y, Shi Y, Fadlullah ZM, Kato N (2018) Space-air-ground integrated network: a survey. IEEE Comm Surv & Tutor 20(4):2714-2741. https://doi.org/10.1109/comst.2018.2841996
» https://doi.org/10.1109/comst.2018.2841996 -
Mah B (1997) An empirical model of HTTP network traffic. Proc of INFOCOM’97 2:592-600. https://doi.org/10.1109/INFCOM.1997.644510
» https://doi.org/10.1109/INFCOM.1997.644510 -
Mohamed A, Agamy A (2011) A survey on the common network traffic sources models. Intern J of Comp Netw 3(2):103-115. https://www.researchgate.net/publication/228564379_A_Survey_on_the_Common_Network_Traffic_Sources_Models
» https://www.researchgate.net/publication/228564379_A_Survey_on_the_Common_Network_Traffic_Sources_Models -
Moltchanov D (2007) On-line state detection in time-varying traffic patterns. Paper presented 2007 Proceedings of the 7th International Conference on Next Generation Teletraffic and Wire/Wireless Advanced Networking. IEEE; St. Petersburg, Russia. https://www.researchgate.net/publication/220876648_On-Line_State_Detection_in_Time-Varying_Traffic_Patterns
» https://www.researchgate.net/publication/220876648_On-Line_State_Detection_in_Time-Varying_Traffic_Patterns -
Murali KP, Gadre VM, Desai UB (2003) Broadband network traffic modeling. Boston: Springer. Multifractal based network traffic modeling; p. 55-70. https://doi.org/10.1007/978-1-4615-0499-3_3
» https://doi.org/10.1007/978-1-4615-0499-3_3 -
Nath K, Dhar S, Basishtha S (2014) Web 1.0 to Web 3.0 – Evolution of the web and its various challenges. Paper presented 2014 Proceedings of the 2014 International Conference on Reliability, Optimization and Information Technology 86-89. IEEE; Faridabad, India. https://doi.org/10.1109/ICROIT.2014.6798297
» https://doi.org/10.1109/ICROIT.2014.6798297 -
Nogueira A, Salvador P, Valadas R, Pacheco A (2003) Modeling self-similar traffic through Markov modulated Poisson processes over multiple time scales. Paper presented 2003 6th IEEE International Conference HSNMC-2003 2720:550-560. IEE; Estoril, Portugal. https://doi.org/10.1007/978-3-540-45076-4_55
» https://doi.org/10.1007/978-3-540-45076-4_55 -
Ntlangu MB, Baghai-Wadji A (2017) Modelling network traffic using time series analysis: a review. Paper presented 2017 Proceedings of the International Conference on Big Data and Internet of Thing. ACM; London, United Kingdom. https://doi.org/10.1145/3175684.3175725
» https://doi.org/10.1145/3175684.3175725 -
Odoevsky SM, Busygin AV (2020) Approximation of statistical characteristics of the multimedia traffic service process based on the Pareto distribution. Syst of Contr, Comm and Secur 1:74-108. https://doi.org/10.24411/2410-9916-2020-10104
» https://doi.org/10.24411/2410-9916-2020-10104 - Park K, Willinger W (2000) Self-similar network traffic and performance evaluation. New York; John Wiley & Sons.
-
Preda V, Ciumara R (2006) On composite models: weibull-Pareto and lognormal-Pareto. – A comparative study. J Econ Forec 3:32-46. https://www.researchgate.net/publication/24049575_On_Composite_Models_Weibull-Pareto_and_Lognormal-Pareto_-_A_comparative_study_-
» https://www.researchgate.net/publication/24049575_On_Composite_Models_Weibull-Pareto_and_Lognormal-Pareto_-_A_comparative_study_- -
Ranadheer D, Renikunta R, Dasari R, Perati M (2014) Study of delay and loss behavior of internet switch-markovian modelling using circulant Markov modulated Poisson process (CMMPP). Appl Math 5:512-519. https://doi.org/10.4236/am.2014.53050
» https://doi.org/10.4236/am.2014.53050 -
Reva IL, Ivanov AV, Medvedev MA, Ognev IA (2022) Comparative analysis of modern trends in the field of traffic models of data transmission networks. Analys and Data Proc Syst 2(86):55-68. https://doi.org/10.17212/2782-2001-2022-2-55-68
» https://doi.org/10.17212/2782-2001-2022-2-55-68 - Ruppert D (2004) Statistics and finance: an introduction. New York: Springer Science & Business Media.
- Sadiku MN, Musa SM (2013) Performance analysis of computer networks. New York: Springer.
- Sheluhin OI, Smolskiy S, Osin AB (2007) Self-similar processes in telecommunications. New York: John Wiley & Sons.
-
Sheng J, Cai X, Li Q, Wu C, Ai B, Wang Y, Kadoch M, Peng Y (2022) Space-air-ground integrated network. Development and applications in high-speed railways: a survey. IEEE Transact on Intell Transp Syst 23:10066-10085. https://doi.org/10.1109/TITS.2021.3118557
» https://doi.org/10.1109/TITS.2021.3118557 -
Shikhaliyev R (2017) About network traffic models. Probl of Inform Technol 2:88-93. https://doi.org/10.25045/jpit.v08.i2.10
» https://doi.org/10.25045/jpit.v08.i2.10 - Stallings W (2002) High-speed networks and internets: performance and quality of service. Noida: Prentice Hall.
-
Xiao Y, Pan Y (2009) Emerging wireless LANs, wireless PANs, and wireless MANs: IEEE 802.11, IEEE 802.15, 802.16 wireless standard family. New York: John Wiley & Sons. https://doi.org/10.1002/9780470403686
» https://doi.org/10.1002/9780470403686 -
Yoshihara T, Kasahara S, Takahashi Y (2001) Practical time-scale fitting of self-similar traffic with Markov-modulated Poisson process. Telecomm Syst 17:185-211. https://doi.org/10.1023/A:1016616406118
» https://doi.org/10.1023/A:1016616406118 -
Zhang H-Y, Feng Z-Q, Feng S-Y, Zhou Y (2023) A survey of methods for estimating hurst exponent of time sequence. arXiv:2310.19051. https://doi.org/10.48550/arXiv.2310.19051
» https://doi.org/10.48550/arXiv.2310.19051 -
Zhao G, Zhou G, Wang J (2015) Application of R/S method for dynamic analysis of additional strain and fracture warning in shaft lining. J Sens 2015(1):376498. https://doi.org/10.1155/2015/376498
» https://doi.org/10.1155/2015/376498 -
Zukerman M, Neame T, Addie R (2003) Internet traffic modeling and future technology implications. IEEE INFOCOM 2003. Twenty-second Annual Joint Conference of the IEEE Computer and Communications Societies 1:587-596. https://doi.org/10.1109/INFCOM.2003.1208709
» https://doi.org/10.1109/INFCOM.2003.1208709
Edited by
-
Section editor
Paulo Renato Silva https://orcid.org/0000-0003-0106-2230

 Source: Retrieved from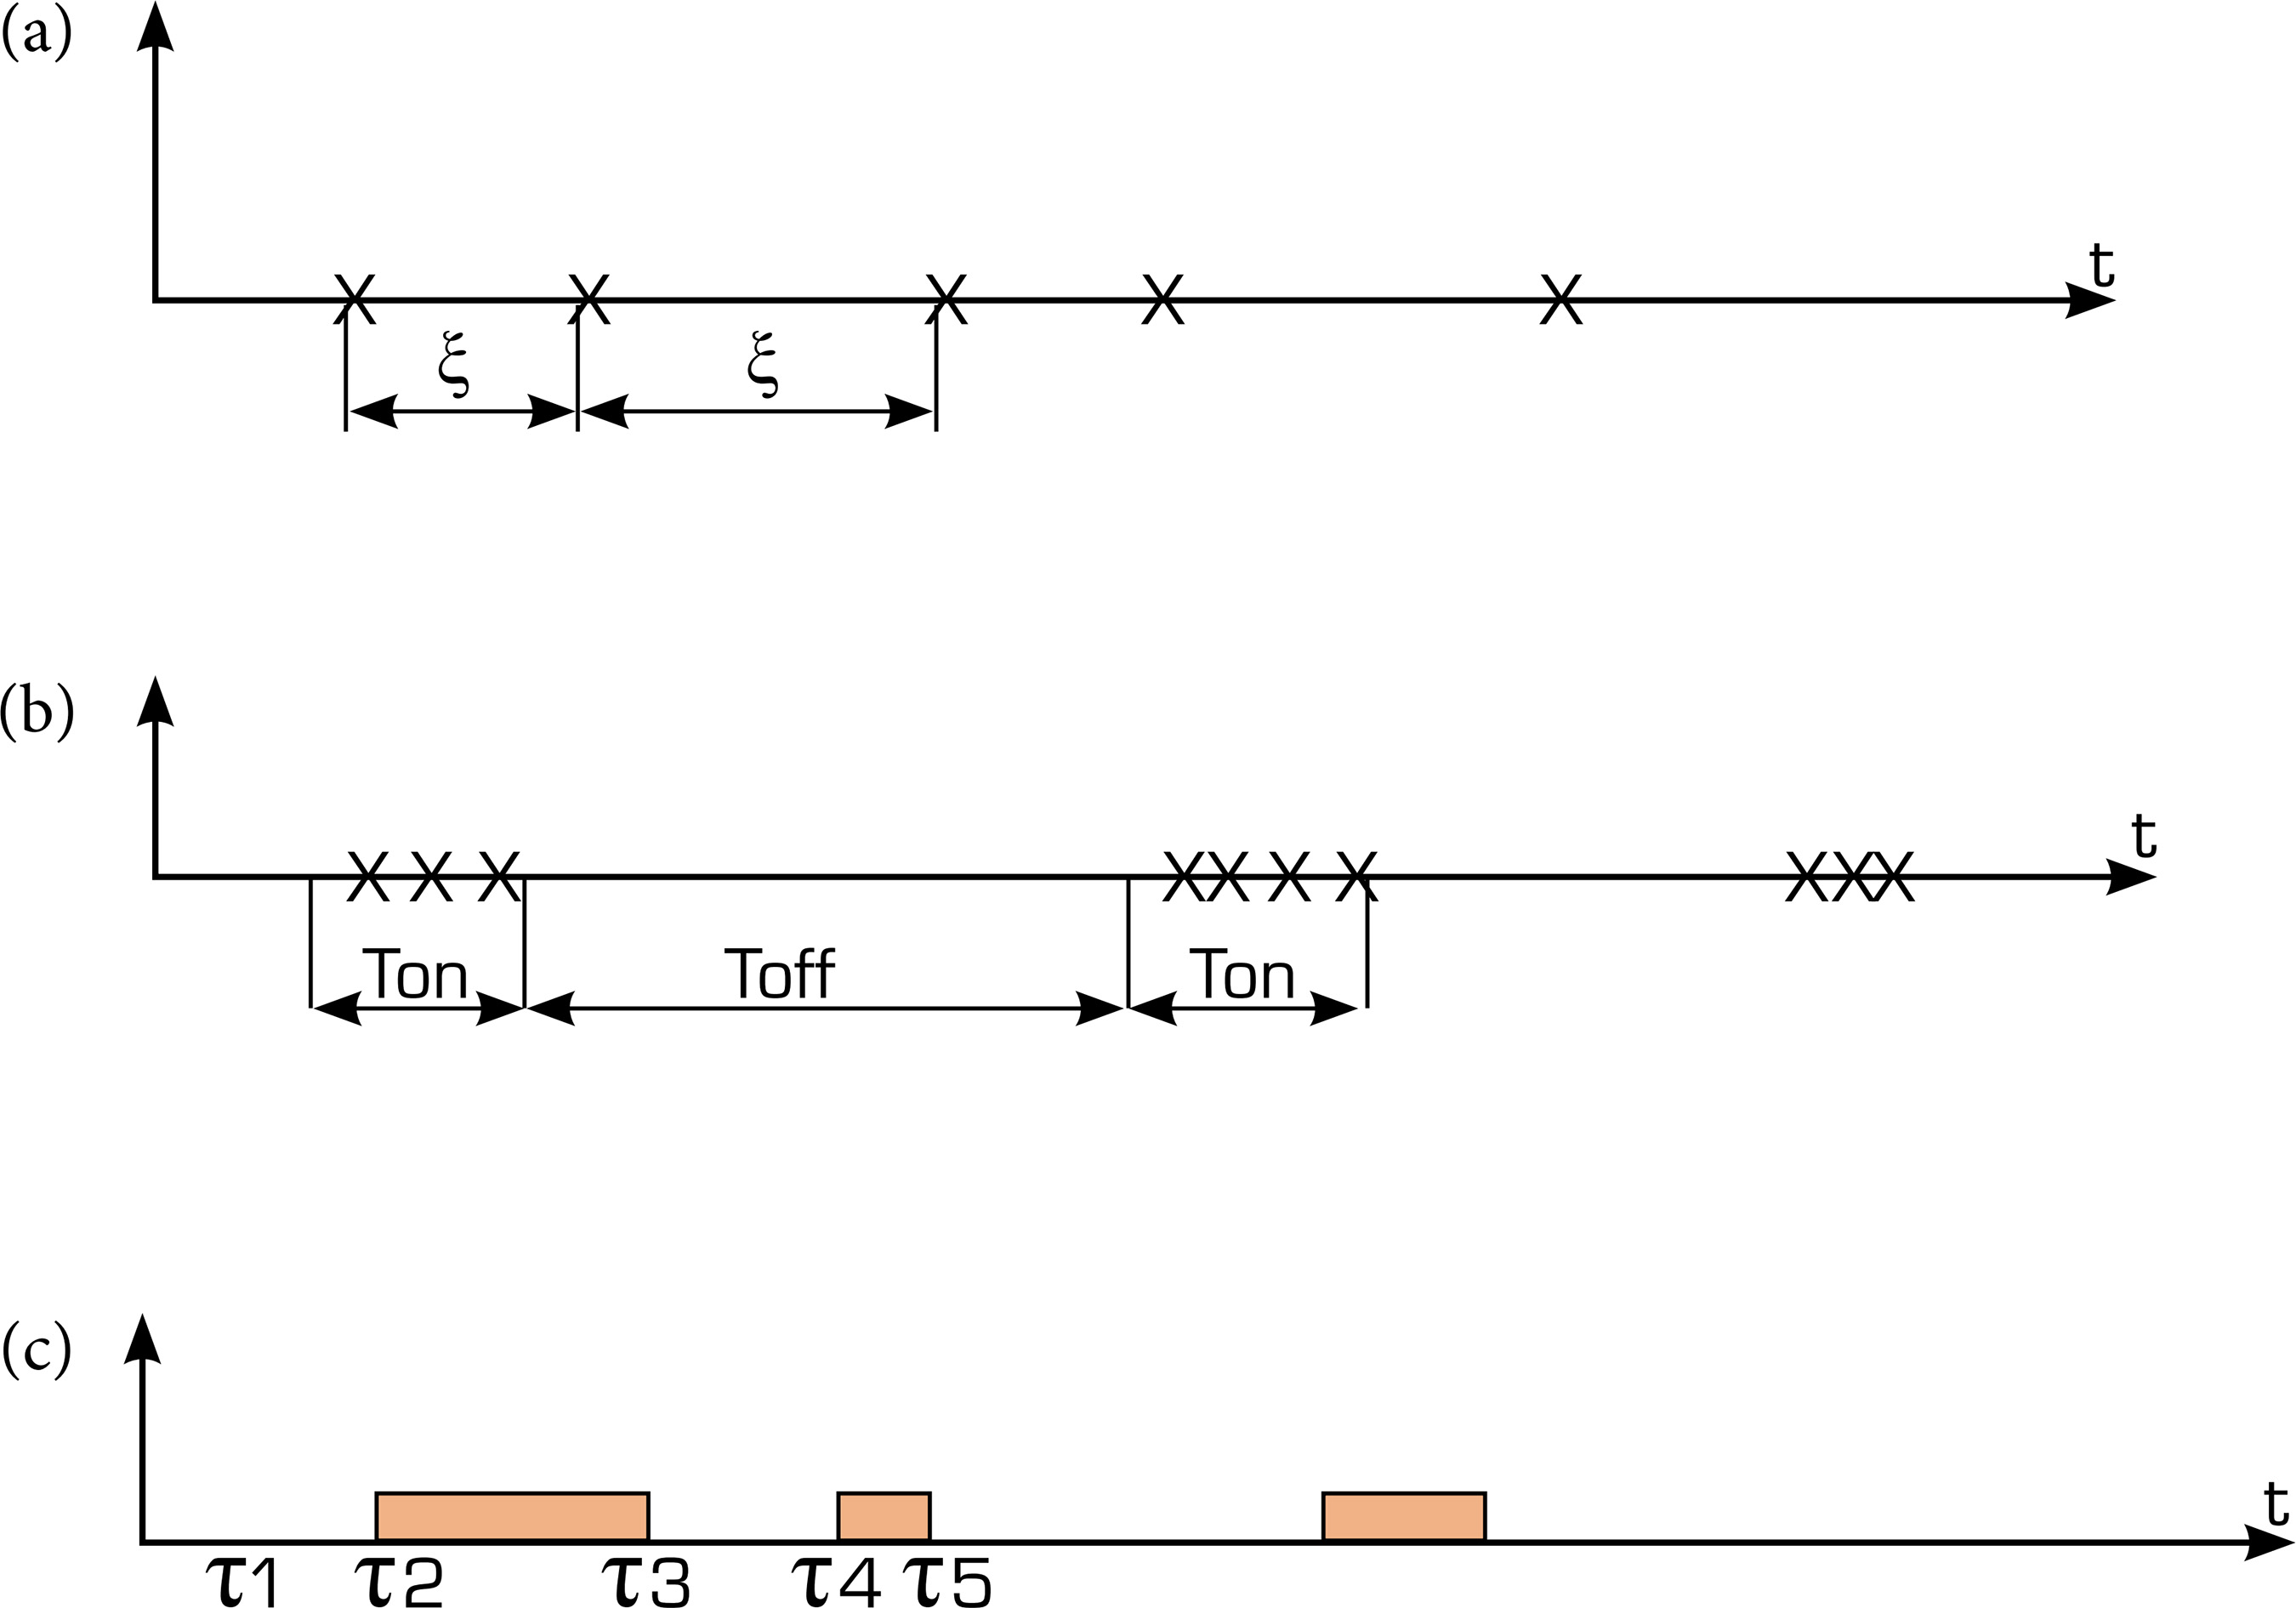
 Source: Elaborated by the authors.
 Source: Elaborated by the authors.
 Source: Elaborated by the authors.
 Source: Elaborated by the authors
 Source: Elaborated by the authors.