A case study on hydrogen generation from solar energy with MPPT control strategy
ABSTRACT
The current mainstream method of global hydrogen production relies on steam reforming of natural gases, which leads to CO2 emissions. On the contrary, renewablepowered water electrolysis offers a sustainable alternative for hydrogen production. The growing adoption of hydrogen as an energy storage solution holds potential for new applications, including ancillary electric grid and transportation services. Those high-power applications require a high output current (900 A) and relatively low output voltages (160-220 V). To address these requirements, a system is designed from a photovoltaic array, two step-down interleaved converters, and an intermediary DC bus to power a 10-kW electrolyzer. The first stage allows the implementation of the maximum power point tracking of the photovoltaic array, ensuring optimal energy conversion, while the second stage supplies the electrolyzer with constant current. A droop-based strategy is proposed to regulate a floating bus voltage within a specified range. Controller Hardware-in-the-Loop results show the feasibility of the proposed control strategy.
KEYWORDS
Electrolyzer; Green Hydrogen; Interleaved Step-Down Converter; Maximum Power Point Tracking; Power Electronics
I. INTRODUCTION
This paper presents an complete study case of off-grid hydrogen generation from a photovoltaic system. The hydrogen gas is currently used in refineries for ammonia synthesis, or converted into energy carriers, such as methanol, methane and liquid hydrocarbons [1]. Hydrogen can also be used directly by burning it in the same way as oil and gas [2], such as in rocket fuels or converted to electricity. However, the mainstream method of global hydrogen production is based on steam reforming of natural gas, which results in CO2 emissions. A promising sustainable alternative to produce hydrogen is from renewable-power water electrolysis [3].
To be considered green hydrogen, the gas has to be produced from green energy sources and green processes: for example, water electrolysis from renewable energy [4]. To date, the presence of renewable energy in the grid is increasing fast. In Brazil, in 2023, more than 20% of the electric energy comes from photovoltaic (PV) and wind [5]. It has been shown that the high penetration of this renewable energy sources in the energy mix is expected to be a greater challenge due to their intermittency and uncontrollability [6].
Among the future applications of hydrogen, a hydrogen-based storage system could be used as an energy vector to convert water (2H2O) to hydrogen (2H2) and oxygen (O2) during a surplus, therefore the gas may be used directly in a given application or used to generate electricity during an energy deficit [1]. The adoption of hydrogen as an energy vector has been said to facilitate new applications, including ancillary services for the electric grid, transportation, and more [7], [8]. In this scenario, a large quantity of green hydrogen must be produced.
Due to the need for high direct currents, traditional industrial water electrolyzers are usually connected to the grid, relying on thyristors and diodes for rectification [9], [10]. The switching at line frequency with thyristor-based rectifiers creates high amplitude harmonics in the supply current and voltage, which results in a challenge to comply with grid code [10].
To overcome this drawback, some papers have been proposing the direct connection of renewable sources and electrolizers, resulting in off-grid hydrogen production systems [3], [11]. Due to the intermittent nature of renewable energy production, it is essential to evaluate the compatibility between the energy source and the electrolyzer. Studies have shown that small Proton Exchange Membrane (PEM) electrolyzer systems (up to 60 kW) are capable of responding to 100% ramp-up and ramp-down events within sub-second intervals during variable renewable energy load-following tests [12]. To ensure reliable performance, a well-designed and fully integrated system is required, with particular attention to the power electronics stage [11].
Considering the case in which the input source is a photovoltaic array, the factors that influence hydrogen production are diverse and can be analyzed from different perspectives [10].In the context of flexibility, hydrogen generation technology can be characterized by the following aspects [13]:
-
The rate of change in energy consumption;
-
The lower operating limit or minimum opening level;
-
The time for startup and shutdown.
The safe rate of change for hydrogen production by PEM technology ranges from 10%/s up to 50% [13]. This makes it well-suited to accommodate the intra-daily variations in incident irradiance typically observed in PV systems, which occur at a much slower rate of approximately ±0.1%/s [13]. However, sudden changes in atmospheric clarity can induce significantly faster irradiance fluctuations. The combined system of the power electronics driver and the electrolyzer stack must respond rapidly to track these variations in solar energy. Together, they ensure that the hydrogen production process remains stable and efficient under dynamic operating conditions.
The minimum operating rate of energy consumption characterizes the minimum power that must be supplied by the source to the electrolyzer. This is relevant for sizing the converter’s active and passive components as well as defining control strategies [12].
The startup time of an electrolyzer, also called cold start, includes the initialization time of the control unit and the removal of air from the piping. For the shutdown of the electrolyzers, similar procedures are applied. In summary, the above-mentioned times and rates mainly depend on the electrolyzer technology and constructive factors of the stack. Lower-power systems have smaller thermal dynamics, leading to shorter times and consequently greater flexibility [14]. These limitations influence the control and operation strategy of the electrolyzer [12], [15], [16]. For off-grid generation systems, the following strategies are mainly found:
-
Strategy 01: the electrolyzer operates at a variable setpoint throughout the day according to production [13], [17]–[20].
-
Strategy 02: the electrolyzer is operated at a fixed power level, which is below its nameplate capacity. A battery energy storage system (BESS) provides or stores energy as necessary to maintain a constant operating point for the electrolyzer [13], [17].
-
Strategy 03: a BESS supports the electrolyzer only during periods in which the photovoltaic power is insufficient to meet the electrolyzer’s minimum operating limits [13], [17], [20].
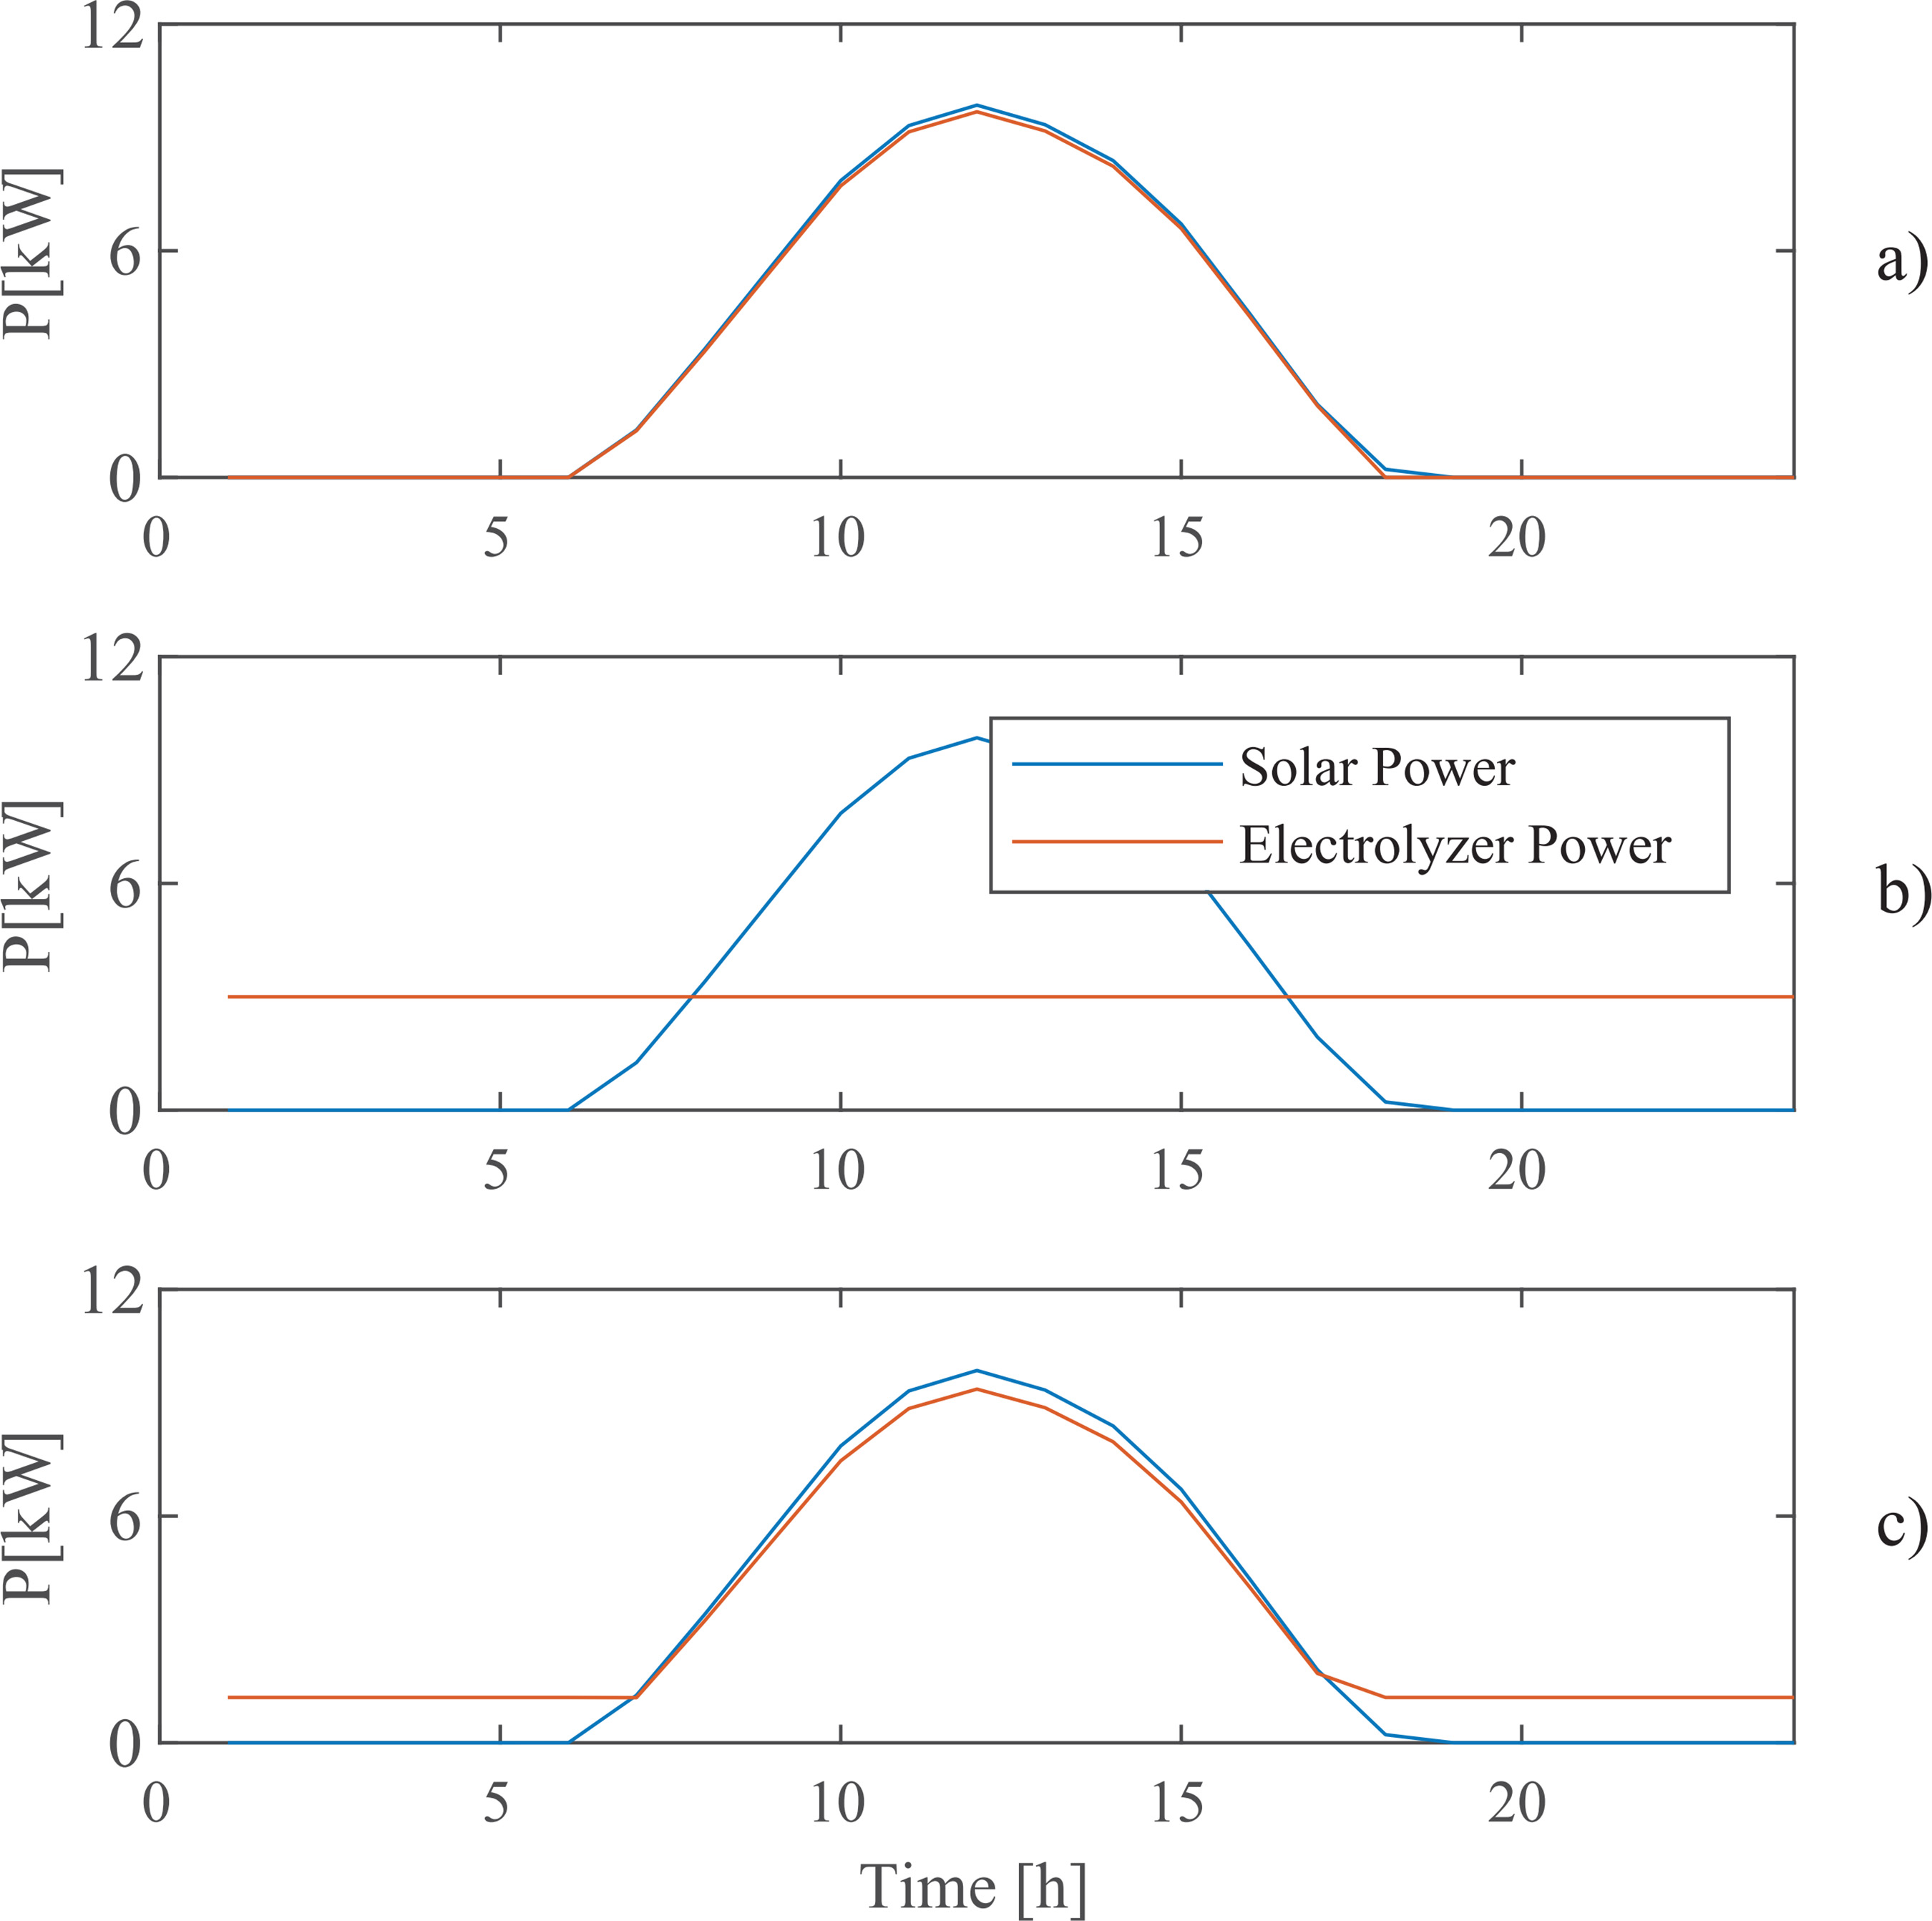
The strategies are more clearly displayed by Fig. 1, where the irradiance changes throughout the day. Fig. 1 a) where the electrolyzer is turned on at the start of the day and off at the lower operating limit. In Fig. 1 b), the extra photo-generated power is stored in a short-term battery, and utilized during the night. In Fig. 1 c), a small battery is only used to support the minimal operational point of the electrolyzer.

Solar powered hydrogen production strategies: a) Strategy 01; b) Strategy 02; and c) Strategy 03.
Most economic and power electronics studies disregard the effects of sudden changes in atmospheric clarity and temperature, which is not ideal when aiming to integrate a complete solution for H2 production. Therefore, analyzing a more realistic scenario is important. To illustrate this difference, irradiance and ambient temperature data from INPE [21], measured at the Florianópolis substation on a minute-by-minute basis, were used. Fig. 2 a) shows the measured irradiance for the 1st, 2nd, and 3rd day of April 2019. Fig. 2 b) presents the estimated junction temperature, calculated based on the irradiance and ambient temperature data. The output power of a system (12 kW peak), shown in Fig. 2 c), is derived from the solar irradiance and the estimated junction temperatures.

More realistic generation scenario, a) irradiancy, b) estimated junction temperature and c) estimated available output power for April 1st, 2nd and 3rd of 2019 in Florianópolis.
As can be seen in the realistic curves, the derivative of output power is much higher due to shadowing and changes in the atmospheric clarity. A solar-powered hydrogen production system must be able to withstand the intermittency of the power source.
In this scenario, the introduction of newer power electronics components could offer advantages, which would require modular or interleaved converters to distribute the supplied currents across appropriate levels for semiconductors, such as insulated-gate bipolar transistors (IGBTs) and Metal-Oxide-Semiconductor Field-Effect Transistor (MOSFETs).
In principle, many DC/DC converters can be used as an interface between the PV array and the electrolyzer. The main requirements of these converters are:
-
Ability to transmit low current ripple to the electrolyzer: primary studies have shown that a high current ripple reduces the efficiency of alkaline and PEM electrolyzers [7], [22], [23] and has the potential to reduce the life span of PEM electrolyzers. [24], [25]. This phenomenon is still a key research question for water electrolyzers.
-
High Electrical efficiency in the entire operational range of the electrolyzer: the converters must maintain high efficiency under varying load conditions, as the operating point of the electrolyzer can fluctuate throughout the day. High efficiency minimizes energy losses, reduces heat generation, and contributes to the overall economic viability of the hydrogen production system.
-
High conversion ratio: depending on the difference between output and input voltages, the conversion ratio can reach high values, which, in a single non-isolated conversion scenario, could lead to prohibitive duty cycles.
-
Reliability in case of component failure: since costs associated with system failure are high, therefore, functionalities as redundant switching devices, fault-tolerant designs, and protection mechanisms are mandatory.
Other relevant factors that should be accounted during the converter design for an electrolyzer include: output voltage range and reduced cost. Existing transformer-less DC/DC converters have been reviewed in [3] presenting multiple topologies. Among the possible transform-less topologies, various versions of the buck converter have also been proposed, such as the stacked buck converter [26]. High efficiency is a main requirement and with this aim, it has been proposed soft-switching converters, as for example the solution based on coupled inductors presented in [27]. Also, high-efficient converters based on the partial power processing concept [28], were quite largely proposed for PV applications, such as in [29].
One trend identified in [3] are the use of interleaved converters. They are a well-known approach to handle higher currents to offer better dynamic response and smaller overall filters. It involves connecting a few converters in parallel and controlling them with a phase-shift carrier. Combining the input and output currents of these phases and applying this technique effectively reduces both ripple and harmonics [24]. There are still multiple topological options, operational voltages, and the ideal compromise between the number of interleaved phases and ripple mitigation to study [3].
For this application, the Interleaved Buck Converter (IBC) was selected [27]. The number of phases and the design of each component were described in [30]. For a proper evaluation of the proposed system, Hardware-in-the-Loop (HIL) is employed, and the feasibility of the proposed power stage and control strategy is shown. In contrast to conventional grid-connected topologies, the proposed architecture targets an off-grid configuration. The inclusion of a droop-based voltage regulation strategy enables autonomous operation under variable irradiance without communication between stages.
This paper is organized as follows. Section I presents the introduction, including the motivation and the main challenges associated with green hydrogen production from solar energy. Section II describes the overall system architecture, including the photovoltaic array, electrolyzer, and the interleaved converters. Section III outlines the proposed control strategy, encompassing the MPPT and droop-based control approaches, and provides a linearized state-space model to support the controller design. Section IV presents Hardware-in-the-Loop (HIL) simulation results, validating the effectiveness of the proposed system and control methods under realistic conditions. Finally, Section V offers a discussion of the results, highlighting the main findings, contributions, and potential directions for future research.
II. SYSTEM DESCRIPTION
The present work is part of a larger modular strategy to feed an electrolyzer with high-frequency power semiconductors (IGBT, MOSFETs) by paralleling multiple interleaved converters and distributing supplied power [31]–[33].
The final system will be used to study PEM electrolyzer operation, and a current reference will be provided from the central controller to each module. This work focuses solely on a single interleaved module’s control strategy and design, which includes a two-stage power converter to drive a 10-kW equivalent PEM electrolyzer. The designed system is formed by a photovoltaic array, two step-down interleaved power converters, and an intermediary DC-bus to properly feed the electrolyzer, as shown in Fig.3.

The main electrical specifications of the system are shown in Fig. 3 and are displayed in Table 1. This data is considered for the proper converter design of both power stages.
A. Photovoltaic Array
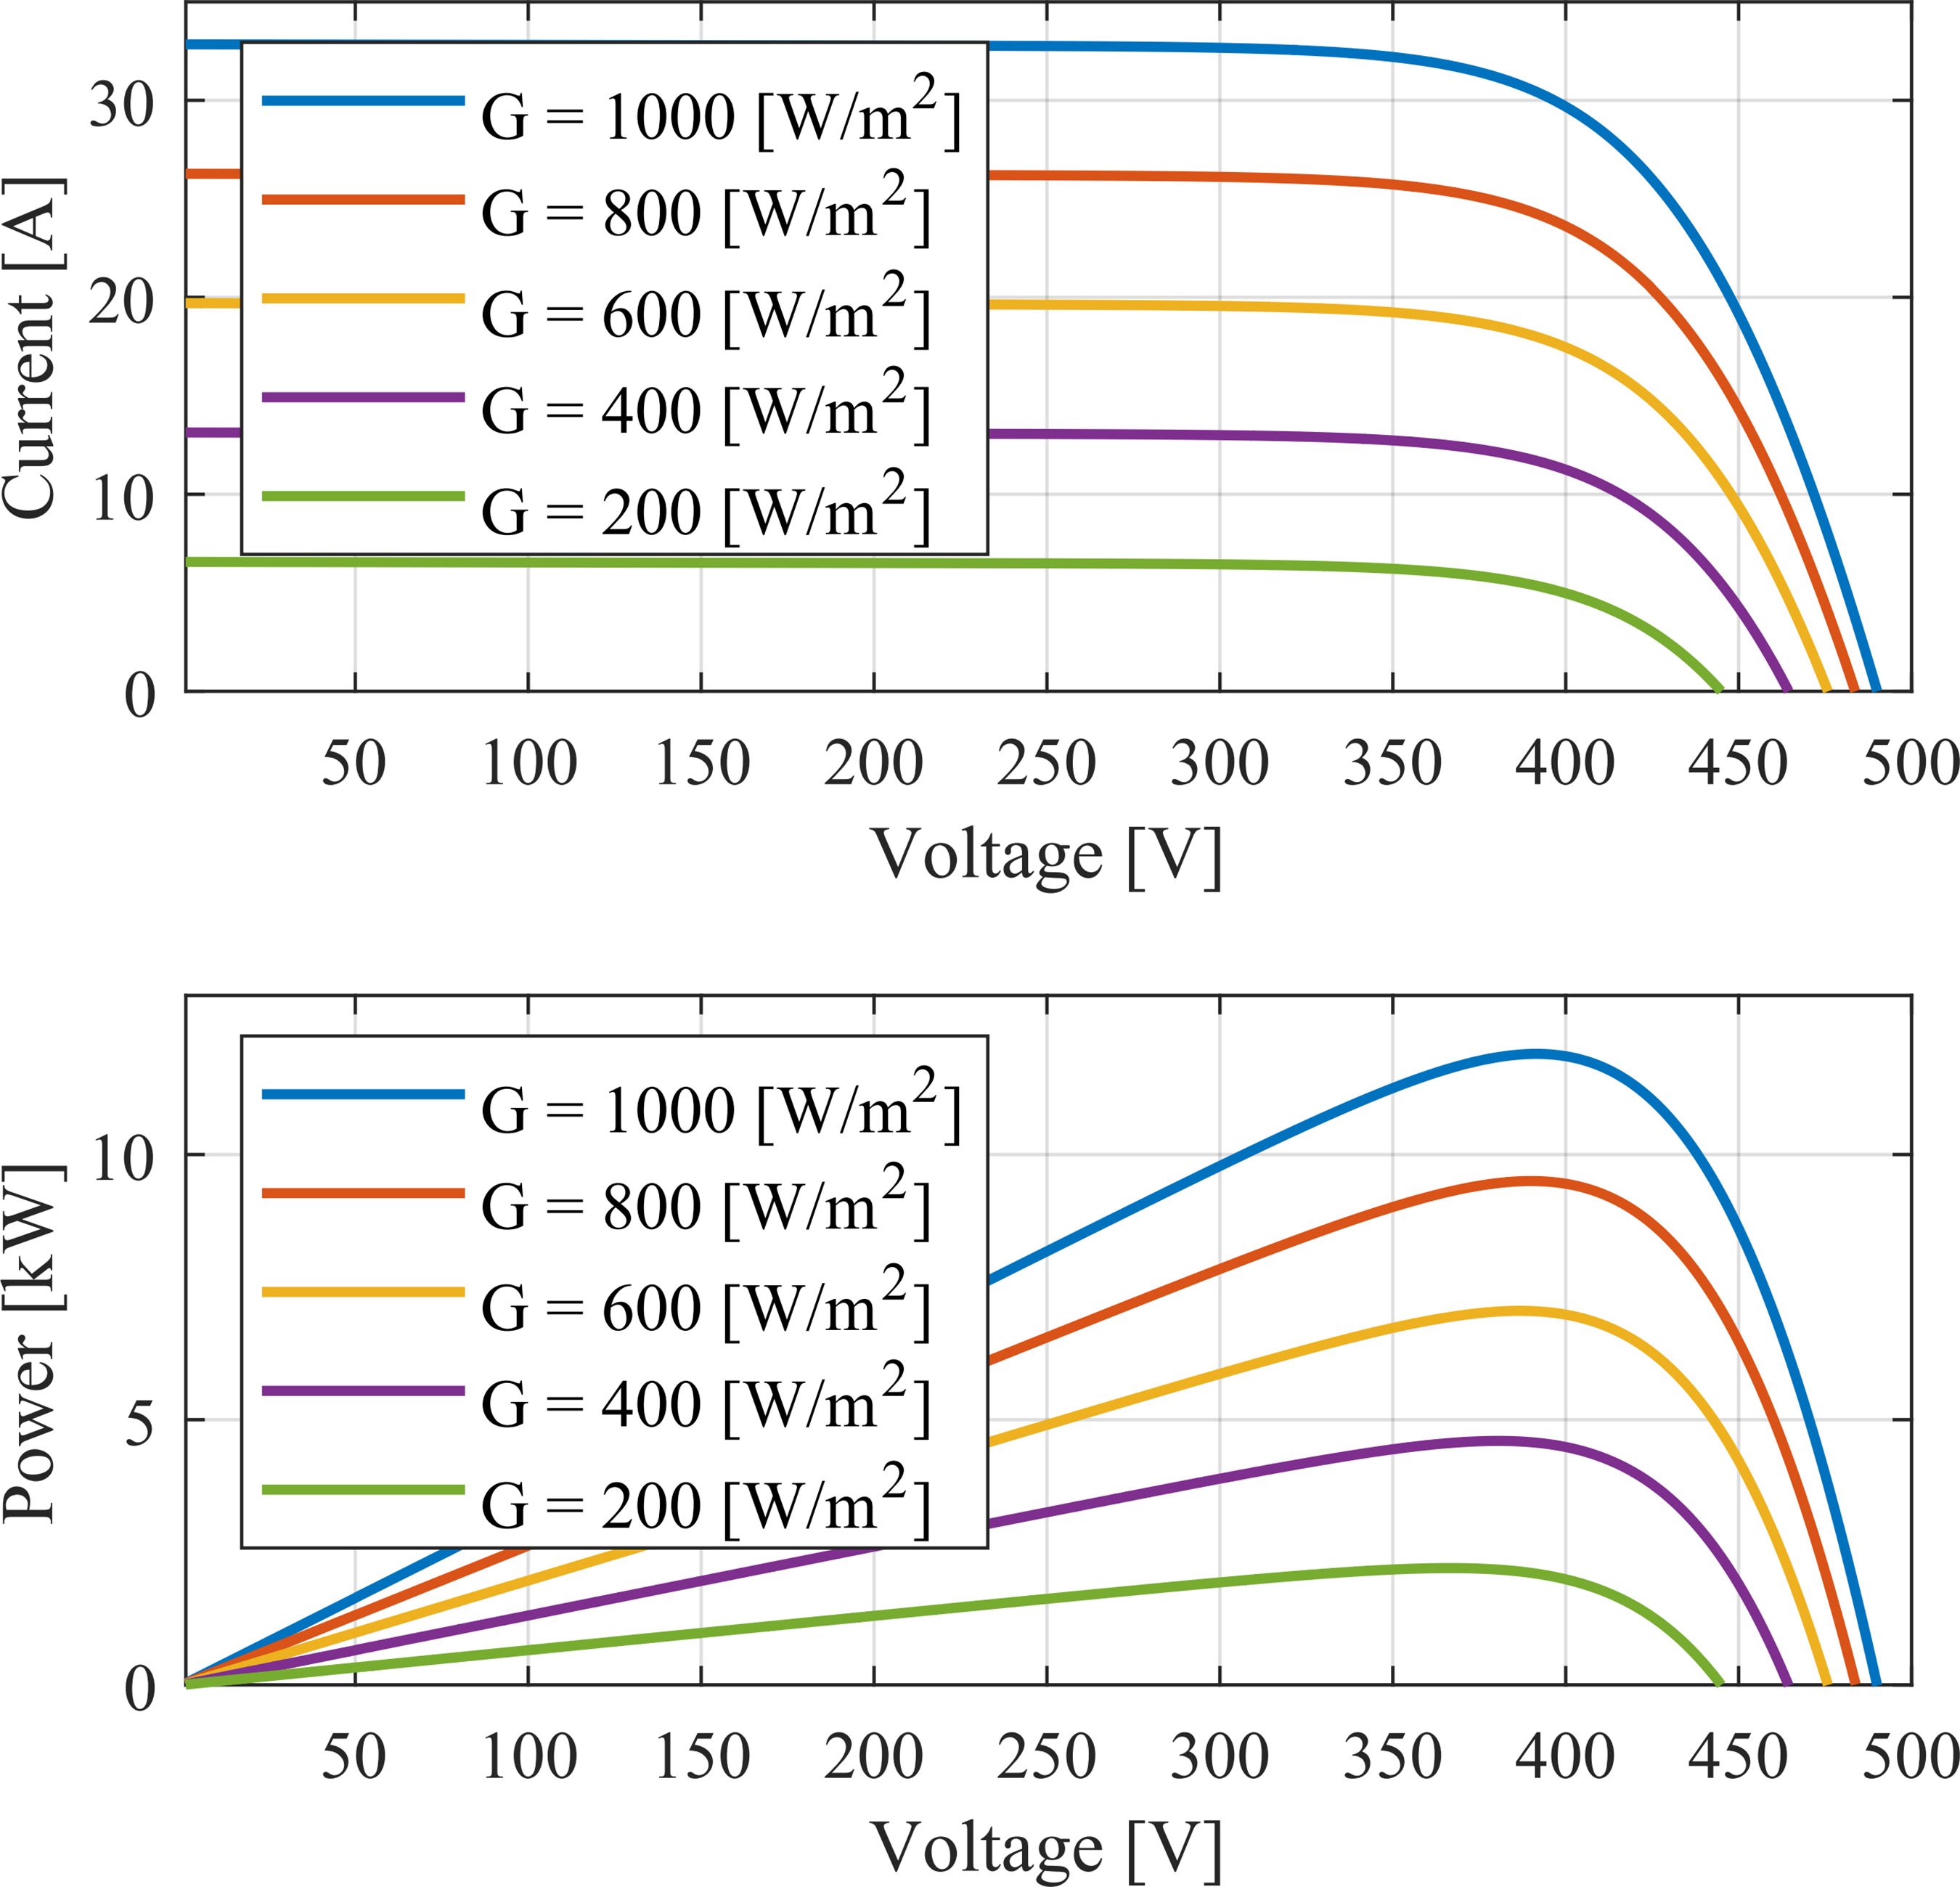
The one-diode model is a widely used electrical representation of a photovoltaic (PV) description, represented by the circuit in Fig. 4. In this circuit, iph represents the photo-generated current, Rs is the series resistance accounting for electrical contact losses, and Rp is the parallel resistance modeling leakage current losses. The diode D models the semiconductor properties of the PV cells. The variables vpv and ipv are the output voltage and current, respectively. By evaluating the one-diode model, it is possible to obtain a system of non-linear equations, which the solution result in the five unknown parameters of the model [34]. From this procedure, it was possible to obtain the five parameters, of a single module Kyocera KC200GT photovoltaic module are obtained from the datasheet and the solution for the model parameters from [34]. The photovoltaic array consists of 4 strings connected in parallel, each string consists of 15 PV modules connected in series. According to [34], the one-diode model of a module can be extended to represent the behavior of the complete array. Therefore, adjustments must be made to the one-diode model parameters according to the number of modules connected in series and in parallel.The adjusted parameters then represent the one-diode model of the complete array. The final electrical especification of the PV module and of the PV array under the Standard Test Conditions (STC) are detailed in Table I, while the respective I-V and P-V curves are shown in Fig. 5. It is evident that for lower voltages, the PV array behaves much similarly to a current source.


B. Input Filter
A LC filter was added between the PV array and the first stage to mitigate the circulation of high-frequency current through the PV array. The long cable required for the application carry an inductance, which is estimated and incorporated in the design. Finally, the filter cut-off frequency was tuned to be one decade below the switching frequency.
C. PEM Electrolyzer
The water electrolysis operation is an electrolytic process that decomposes water H2O molecule into oxygen O2 and hydrogen H2. Many different PEM electrolyzer models have been proposed in the literature, such as chemical models, static and dynamic electric models [13], [35].
Modeling hydrogen production is a complex task due to its dependency on a multitude of factors such as temperature, water flow, pressure and demand. Since the internal dynamics of the electrolyzer are significantly slower than those of the converter, the systems are modeled separately. From the driver’s perspective, fewer chemical and physics concepts are relevant. For instance, it is relevant to know the required current on the electrolyzer for a given production rate [36]. In alkaline and PEM electrolyzers, the molar flow () depends on the number of cells (nc) on the current applied (Ie), the Faraday efficiency (nf), and on the Faraday constant (F), in accordance with:
For PEM-type electrolyzers, the Faraday efficiency is typically greater than 99% [36]. This means that the generated flow depends mostly on the current level.Current state-of-the-art PEM electrolyzers experience a degradation rate of 2-4% per year, resulting in an increase in operational voltage during their life cycle. As the electrolyzer ages, its internal resistance increases, resulting in a higher operational voltage, as presented in Fig. 6.
Therefore, the steady-state voltage-current characteristic of an electrolyzer [37] can be modeled as a temperature-dependent voltage source with an additional non-linear resistor in series. This resistor represents the internal losses of the electrolyzer. A simple V × I model for a given electrolyzer is given by:
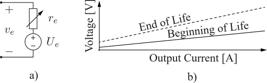
Effect of aging in PEM electrolyzer stack: a) simplified steady-state PEM electrolyzer model and b) V-I curve for old and new electrolyzers.
where Ue is the activation voltage, re is the internal resistance, which accounts for ohmic and electrochemical losses and ve is the stack voltage.
D. Interleaved Buck Converter
Due to the high currents demanded by electrolyzers, several authors [18], [30], [38] have proposed parallelism and interleaving of multiple buck converters as a proper solution to drive them. The number of interleaving cells and/or parallel converters depends on multiple. In this work, 3 cells (N = 3) were found to be a good compromise between complexity and total losses. For a non-coupled Input Parallel Output Parallel (IPOP) Multicell (MC) converter formed by N interleaved cells, the relative ripple on the output is given by:
The inductance of a single cell (Lf) depends on the desired output current ripple (∆I), the number of cells (N), instantaneous duty-cycle (D), and the switching frequency.
. The function floor rounds down the product between the instantaneous duty cycle and the number of cells (DN). Fig. 7 presents the current ripple behavior across different numbers of switching cells. Since the first stage is not directly connected to the electrolyzer, a higher current ripple is acceptable. This work considers the inductance of both stages to be equal for simplicity, and that the output differential-mode-filter design is based on the current ripple established on the electrolyzer. Hence, to minimize the output current ripple, a duty cycle of 0.5 is optimal when N = 2; 0.333 and 0.666 when N = 3.

Normalized output current ripple of an interleaved converter as a function of the number N of phases.
E. Bus Capacitor Dimensioning
The selection of the bus capacitor directly influences the system’s dynamic response to power fluctuations and reference changes. A well-dimensioned capacitor mitigates transient effects, preventing excessive voltage oscillations that could affect the electrolyzer’s performance. Moreover, the capacitance value must be chosen to balance the trade-off between system stability, cost and volume.
By considering the proposed droop control order presented in Section III, and electrolyzer constraints, the proposed capacitance formulation ensures that the system operates within safe limits. The electrolyzer is still susceptible to reference changes above its maximum rate limit. The derived expressions provide a quantitative approach for selecting a feasible bus capacitor, ensuring that the power reference changes remain within the electrolyzer’s operational constraints. The ramping rate of the electrolyzer indicates how fast it can react upon a change in power (from 10%/s of the current operating set point to +50%/s, depending on the manufacturer) [13]. In general, the slowest variables such as pressure, gas venting, and temperature, along with the control system, impose limits on the ramp rate, rather than the electrical capability of the stack:
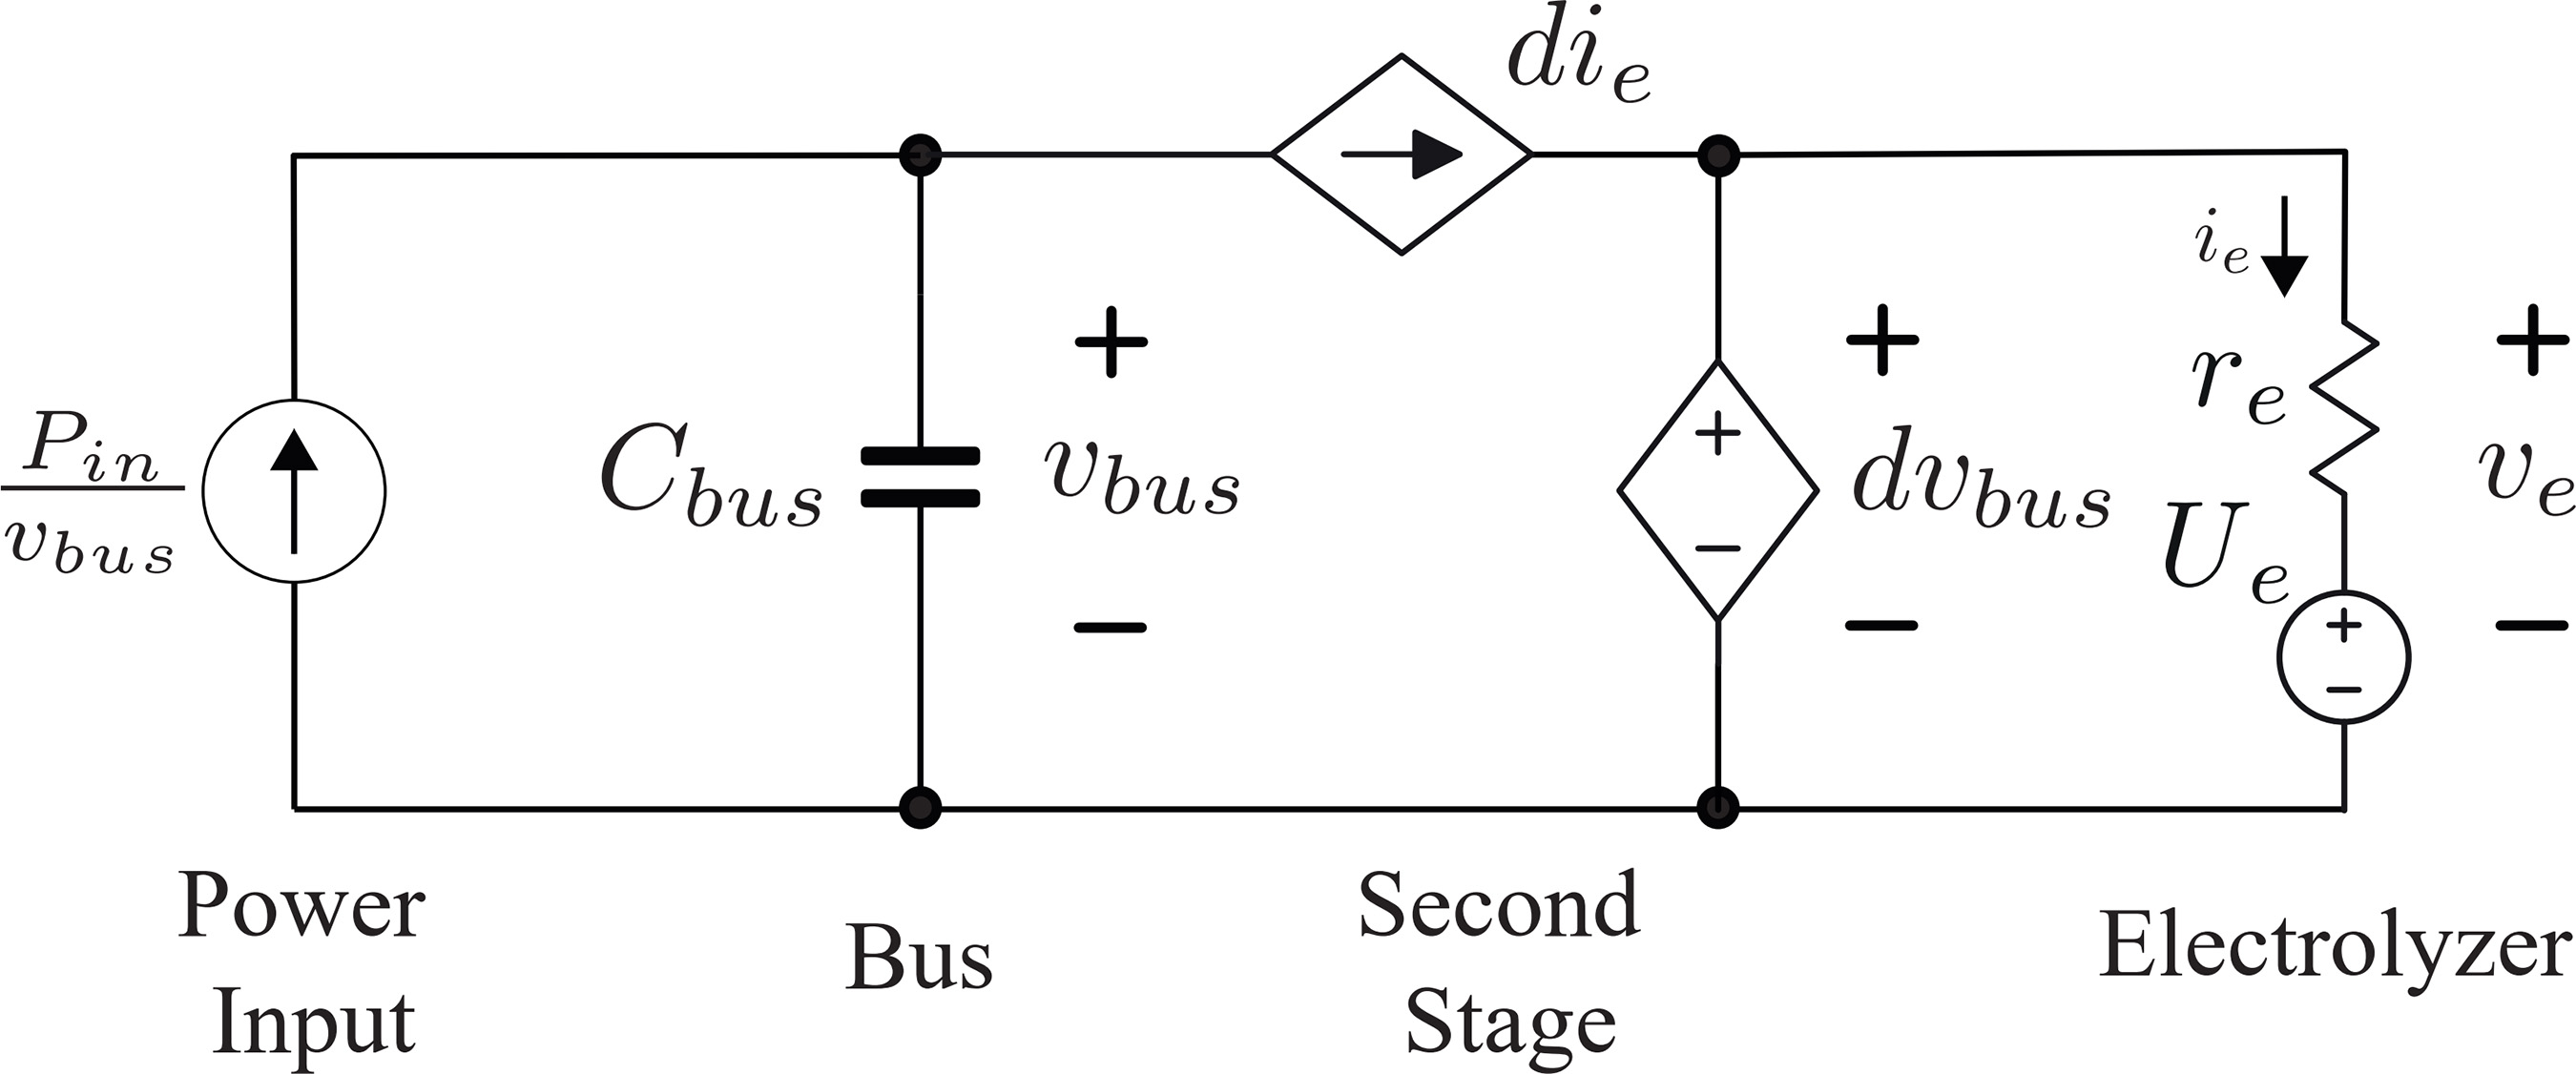
where Pe is the output power delivered and Pn is the nominal power rating of the electrolyzer. A few reasonable assumptions are made: (i) ideal reference tracking, such that the current reference equals the electrolyzer current, i.e., iref = ie; and (ii) the energy stored in the inductors is negligible compared to that stored in the DC bus capacitor, i.e., . Under these assumptions, the system can be represented as shown in Fig. 8.

Block diagram of a power system with a DC bus and electrolyzer. The diagram illustrates the power input (Pin) and voltage (vbus) to the bus, followed by the second stage and the electrolyzer, with respective voltage and current variables labeled as vbus, ie, and Ue.
Considering a suden change in the input power, The capacitor voltage depends on the initial voltage vbus(0−) and on the current drained by the second stage. The following system of equations is found for the second stage:
By inserting (5) and (6) into (7), the following equation is found:
The same equation is extended to be represented in the canonical form of a polynomial and is rewritten in terms of three constants A0, A1, A2:
where the constants A0, A1, A2, are defined as:
This is a first-order nonlinear ordinary differential equation (ODE) [39], where all coefficients A0, A1, and A2 are nonzero. The roots of the quadratic polynomial A2v2 + A1v + A0 = 0 determine the equilibrium points of the system:
However, a complete closed-form solution for this expression is not available [40], and the solution must be obtained numerically. To enable analytical treatment, and determine the smallest feasible capacitance, the equation has to be linearized around a specific operating point V , resulting in a first-order linear separable differential equation:
where V0 is the equilibrium point for vbus. This is an exponential decay equation, of which the symbolic solution is:
The electrolyzer current (ie) and electrolyzer voltage (ve) are found by substituting (5) in (6). The output power and its derivative are found. Since the highest rate of change the output power Po occurs at the moment which vbus is higher, i.e. (t = 0), to respect the rate change of the electrolyzer:
Therefore, to mitigate abrupt variations in output power, the bus capacitance must be sized above a thresh-old:
To evaluate the effect of the adopted approximations, a comparative analysis was carried out between the numerical solution and the algebraic approximation of (9), as well as the numerical solution derived from the original differential formulation presented in (14). Fig. 9 illustrates the outcome of this comparison. In this example, a 2% constraint on the rate of power variation was imposed, corresponding to a power ramp limit of 200 W/s. This constraint would lead to the selection of a relatively high capacitance value to support a 1 kW step reduction.

Comparison between the numerical solution of 9. In a), the output power, b) rate of change, c) bus voltage d) the electrolyzer current.
A practical capacitor sizing can be achieved by considering the specific electrolyzer, as illustrated in Fig. 10. The x-axis represents the acceptable rate of change in the electrolyzer power, while the right y-axis indicates the corresponding required capacitance. For instance, to limit the power variation to 20% of the nominal value, a capacitance of approximately 200 mF is required.

Required bus capacitance for different rates of power variation in the electrolyzer input.
This capacitance requirement has direct implications on both system cost and physical integration. High-capacitance components suitable for high-voltage DC applications tend to be bulky and costly, often presenting additional challenges in terms of reliability, lifespan, and thermal management. Electrolytic capacitors, while offering a lower cost per unit capacitance, typically suffer from reduced operational life and higher equivalent series resistance (ESR). Therefore, the capacitor selection process must carefully balance the dynamic performance requirements of the electrolyzer with the economic and volumetric constraints of the system.
III. CONTROL STRATEGY AND CONTROL ORIENTED MODEL
The system model described in Fig. 3 is divided into two stages: the first stage is composed of the photovoltaic array, the LC filter, the first buck interleaved; the second stage consists of the second interleaved buck converter and the electrolyzer. Unfortunately, the operation of multi-cell systems with common-duty-ratio cannot rely on natural balancing, therefore each cell was individually controlled [32].
A. Droop and MPPT Control Strategy
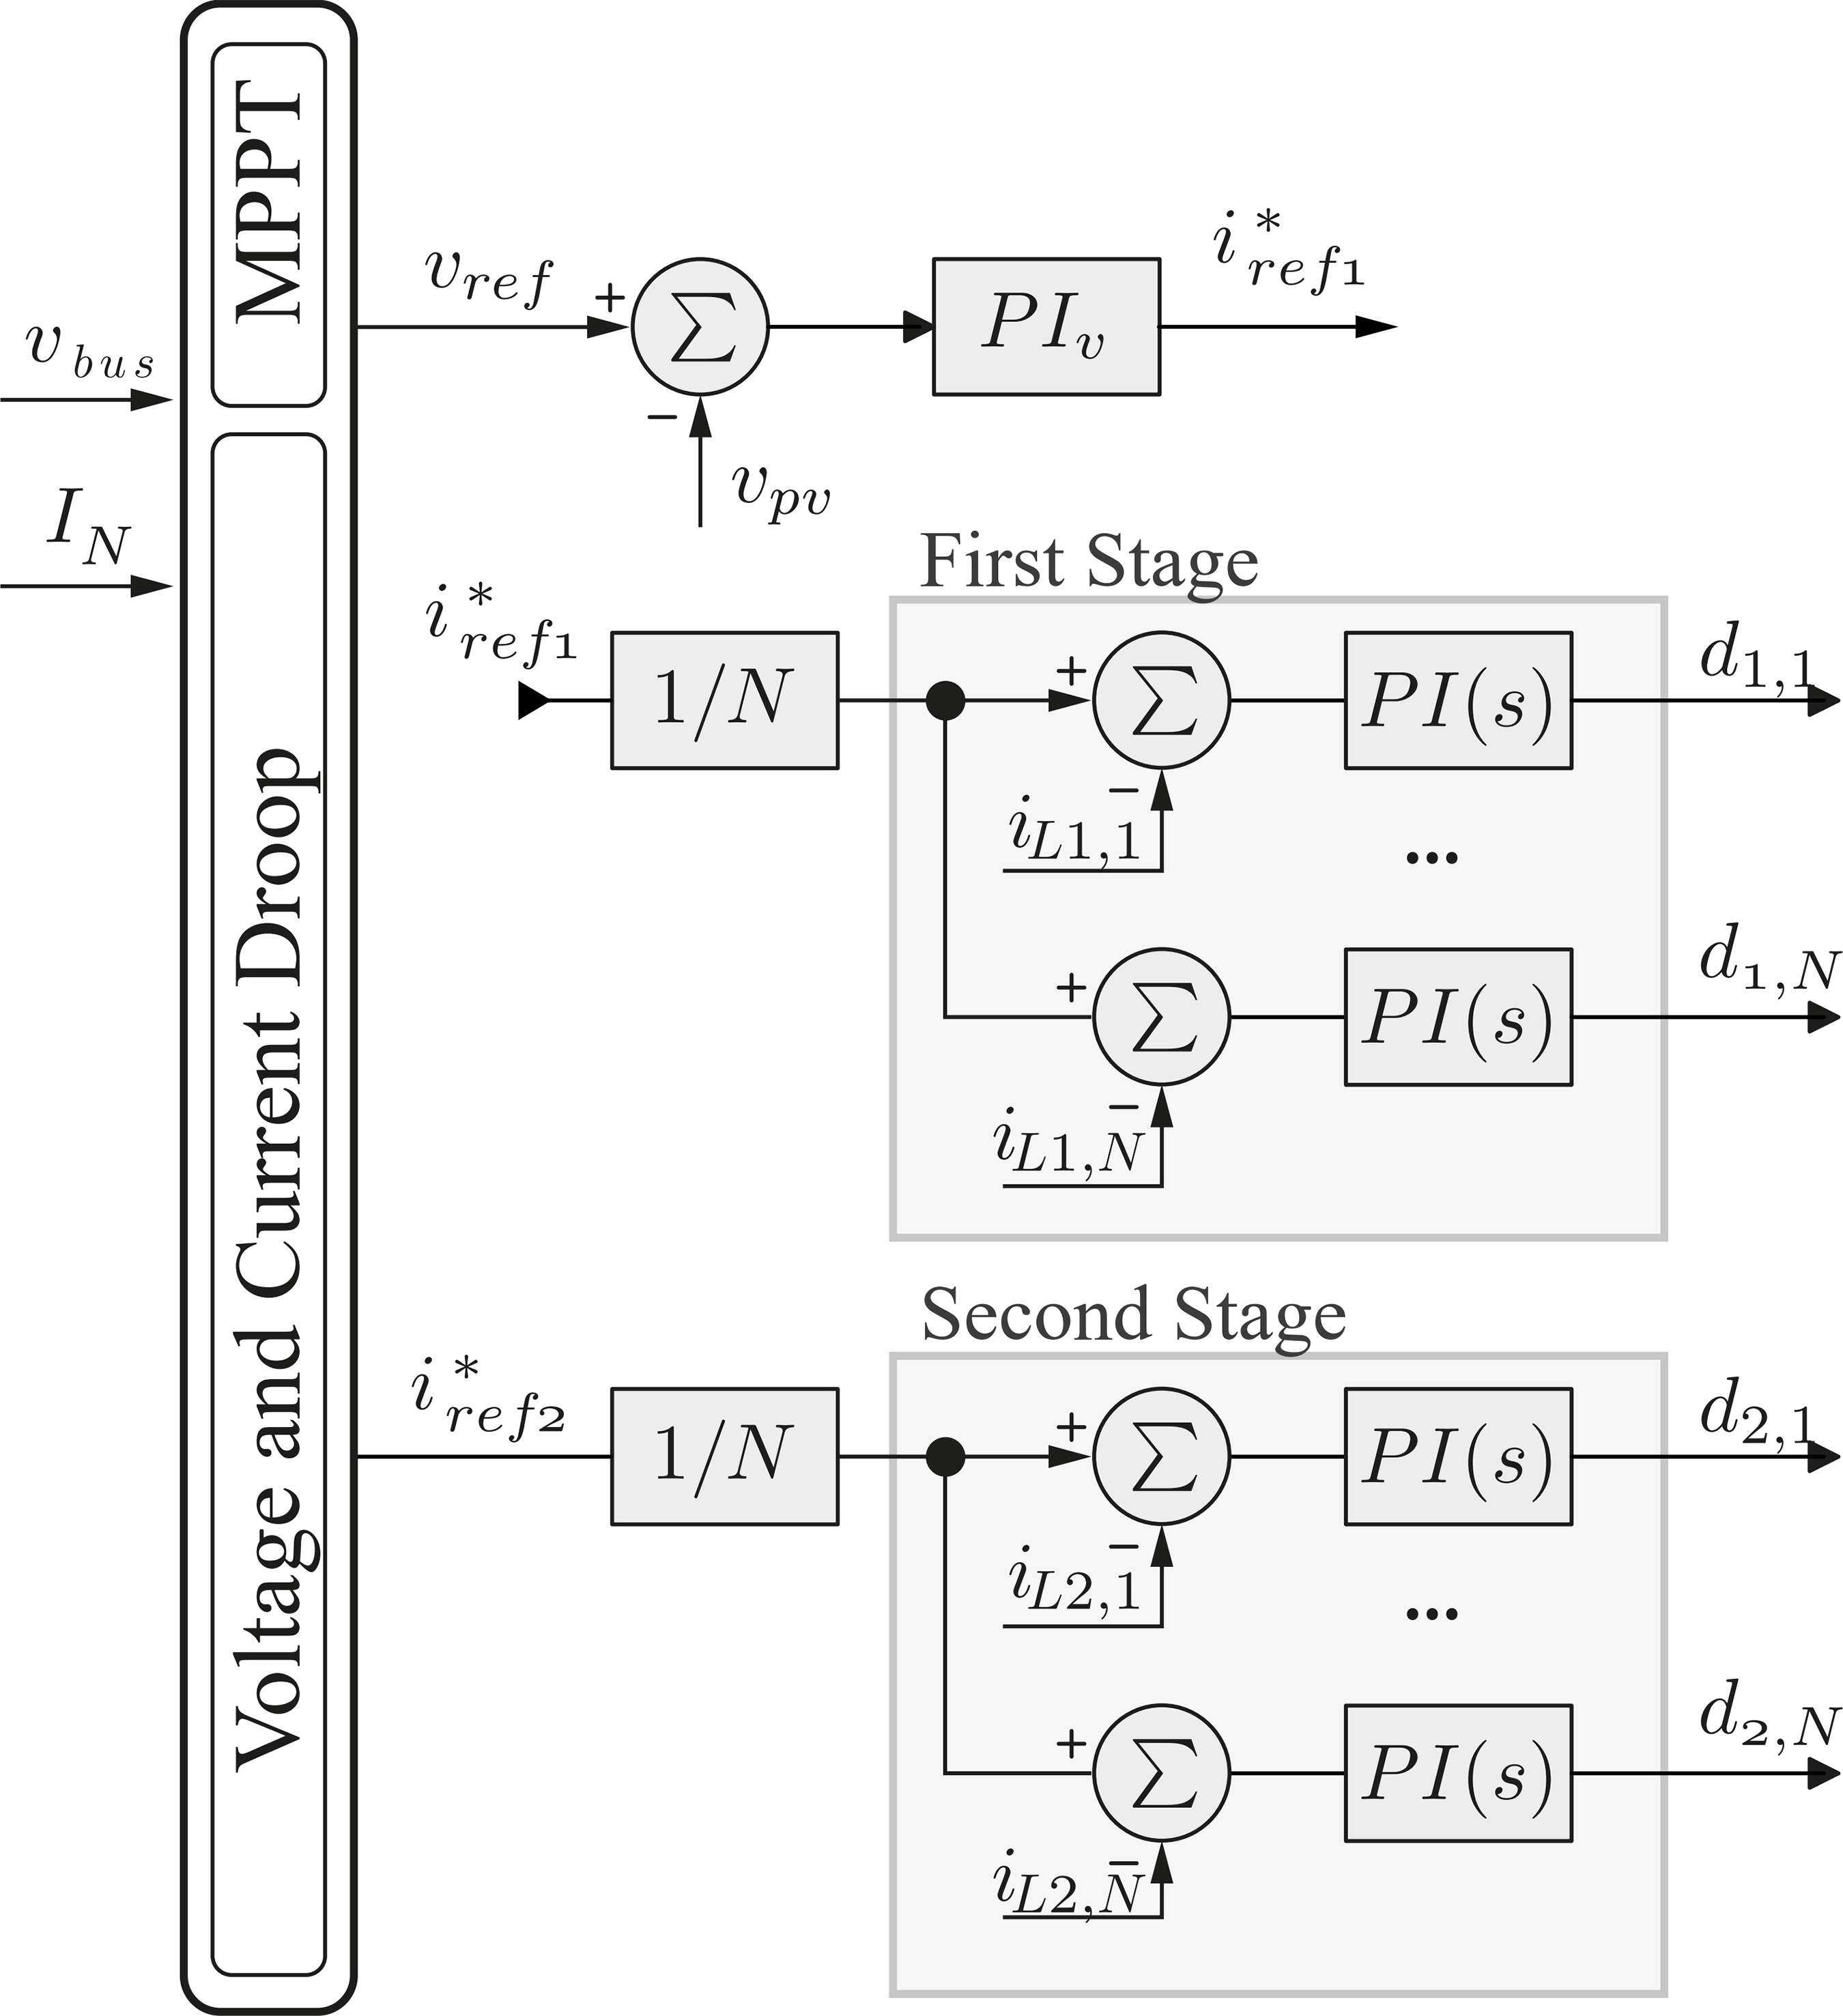
The system’s control diagram is presented in Fig. 11. The two stages of the cascaded interleaved buck converter are controlled separately. The reference signal of each stage is dependent on the operational state. In the first stage, a current controller must be used to guarantee an equal current distribution among phases 1 to N. A voltage controller regulates the duty cycle to follow the voltage reference that is either a Vmp or a droop reference, depending on the operational state. For the second stage, the current controller either tracks the external current reference (IN) or the droop response reference, in cases where environmental conditions cannot provide the required current.

Diagram of the controller for both stages. For the first stage, the voltage reference (vref) is provided either from the MPPT or from the voltage droop, the output of the voltage controller is the current reference (iref,1). For the second stage, the current reference (iref,2) is either (IN) or is given by the current droop.
The two main operational states are illustrated by Fig. 12. Depending on the power balance created between the PV array and the power consumed by the electrolyzer:
-
In the first operational state (vbus < Vnom) the PV array is maintained at maximum power point (MPP), and the current reference follows (18) until the bus voltage reaches the nominal operating point.
-
In the second operational state (vbus > Vnom), a voltage droop is applied, following (19), whereas the current is maintained at Inom. The multiloop control strategy, presented in Fig. 12, ensures an equal current distribution among the phases and adequate reference tracking.
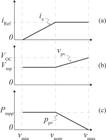
The current and the voltage reference for the second stage are given by
where the respective droop coefficients (mi) and (mv) are:
B. MPPT algorithm
In the context of MPPT algorithms, methods such as neural networks, pattern search, fuzzy logic and genetic algorithms require data for training, which raises problems related to memory, time complexity and source of training data [41]. Indirect methods are also available in the literature and are supported by mathematical expressions [34]. A temperature-based MPPT strategy was chosen because it allows the control system to continuously use the MPP information to calculate the droop reference, even when not operating on the MPP, as presented in Fig. 13.

The temperature-based MPPT calculates the MPP voltage reference to be used as an input to the controller:
where βmp = γ−α is the thermal coefficient of Vmp, while α, β, and γ are the thermal coefficients related to Isc, Voc and Pmp, respectively given by the PV module datasheet. Since the temperature (T) may not always be available for direct measurement, it may be estimated (Tes) from the PV open-circuit voltage, obtained by opening the switches of the first power stage, as in the fractional open circuit voltage method [15]:
To read the open-loop voltage, the switches of the first stage S1,1:N are opened for a small time interval, the current on the first stage (iL) inductors flows through the diodes until it becomes zero. The total time to the input capacitor reaches the open-circuit voltage depends on the dynamic of the input filter and the operating point. In addition, a few meters of wire between the PV array and the first-stage converter has enough inductance to compose the filter inductor, however, the effect of the parasitic resistance that causes voltage drops, needs to be predicted. Therefore, the voltage vpv must be reevaluated to its nominal input. Thus:
The dc-resistance rC is estimated based on the wire length and its diameter. The average input current is estimated by the sum of the inductor currents and the instantaneous duty cycle:
The control system and the MPPT are validated against the EN 50530 standard. This standard provides irradiancies profiles over a few minutes. The maximum theoretical, expressed in (26) power of the photovoltaic array is determined from the temperature (T) and irradiance (G) and then compared to the obtained output power. The input parameters G and T are updated every 250 ms, according to EN 50530 standard [42]. This standard was chosen because it defines a precise testing procedure for measuring the overall efficiency of grid-connected photovoltaic (PV) inverters. The standard specifies methods for measuring both static and dynamic MPPT efficiency, which evaluates the speed and precision of tracking under changing conditions to give a real assessment of the inverter’s performance. Typhoon HIL Control Center records iph and vpv at 100 Samples per Second (SPS) during the standard test (1900 seconds).
The obtained curves are presented in Fig. 14 a cross-correlation higher than 0.99 is found, indicating statistical equivalence between the maximum available power (PMAX) and the obtained power (POB). Also, an MPPT efficiency of 99.25% was obtained from the same data by comparing the total energy from the irradiance and temperature profile for the PV array against the obtained energy by employing the proposed MMPT strategy.

EN 50530 30%-100% along the y-axis: it is displayed maximum available theoretical power (PMAX [W]) and the obtained output power simulated in Typhoon HIL Control Center (POB [W]).
C. Control-Oriented Linear Model
For the control design of the PI controller, both stages of the converter and input filter were modeled separately in state space for a generic N value of interleaved cells, in the form = Ax+Bu and Y = Cx+Eu. The definition of the matrices C and E is based on the dynamic behavior being under study at the given time. Additionally, matrix E is null due to the absence of a direct output-input relationship. The first stage includes the PV Array, the LC filter, the first IBC. The bus voltage is considered to be constant and at a nominal value. This stage requires reference tracking either for the MPPT voltage, or the droop voltage of the solar array, the output is used as a reference to the current on the inductors. The state vector x is formed by the current on the inductors (iL1,1 ... iL1,N) the voltage on the PV array (vCpv), the current on the filter inductor, and the voltage on the filter capacitor (iLf and vCf):
The vector of derivatives is the state of the current in the filter capacitor. The derivatives are defined by:
To complete the system model, the input vector u is defined by the duty cycle (d), the input current (iph), and the bus voltage (vbus). So,
The matrices A, B, C, and E of the linearized system are obtained from the Jacobian matrix and vector of derivatives,
where X is the equilibrium point, determined by solving the system of equations presented in(28) when equal to zero. Therefore, the linearized state space system can be found. The open-loop transfer function of the inductors currents to d is given by;
where C1 is a empty matrix of which only C1,1 = 1, and the PV array voltage given by:
where C6 is a empty matrix of which only the element C6,1 = 1.
The second stage includes the bus capacitor, the second IBC, and the electrolyzer. This stage requires reference tracking of IN or the current-droop on current on the inductors. The state vector x2 is:
and the derivatives are:
The open-loop transfer function of the inductor current to d is given by:
where C1 is an empty matrix of which only the element C1,1 = 1.
The PI current and voltage controllers, presented in Section III are tuned based on the frequency response method, within a 60º phase margin and a crossover frequency of fs/5 (i.e 2 kHz) and 20 Hz, respectively, resulting in a proportional gain kp = 0.041 and integral gain ki = 41.92.
IV. HIL RESULTS
A switched model simulation of the proposed converter was implemented in Hardware-in-the-Loop (HIL) The PV system model and the converters switched models are implemented in Typhoon HIL 404, as presented in the diagram in Fig. 15.
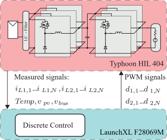
The actual setup is presented in Fig. 16. A time execution of 100 µs was used in Typhoon HIL 404 that generated analog signals between 0 and 3.3 V, which the DSP reads. The discrete control was realized by a microcontroller TMS320F280969M from Texas Instruments. This device allows reading up to 16 Analog Signals and generates the ePWM signals for each of the 6 switching cells.

HIL device - Typhoon HIL 404 connected to a DSPF28069, a osciloscope DSOX1102A displays the bus voltage.
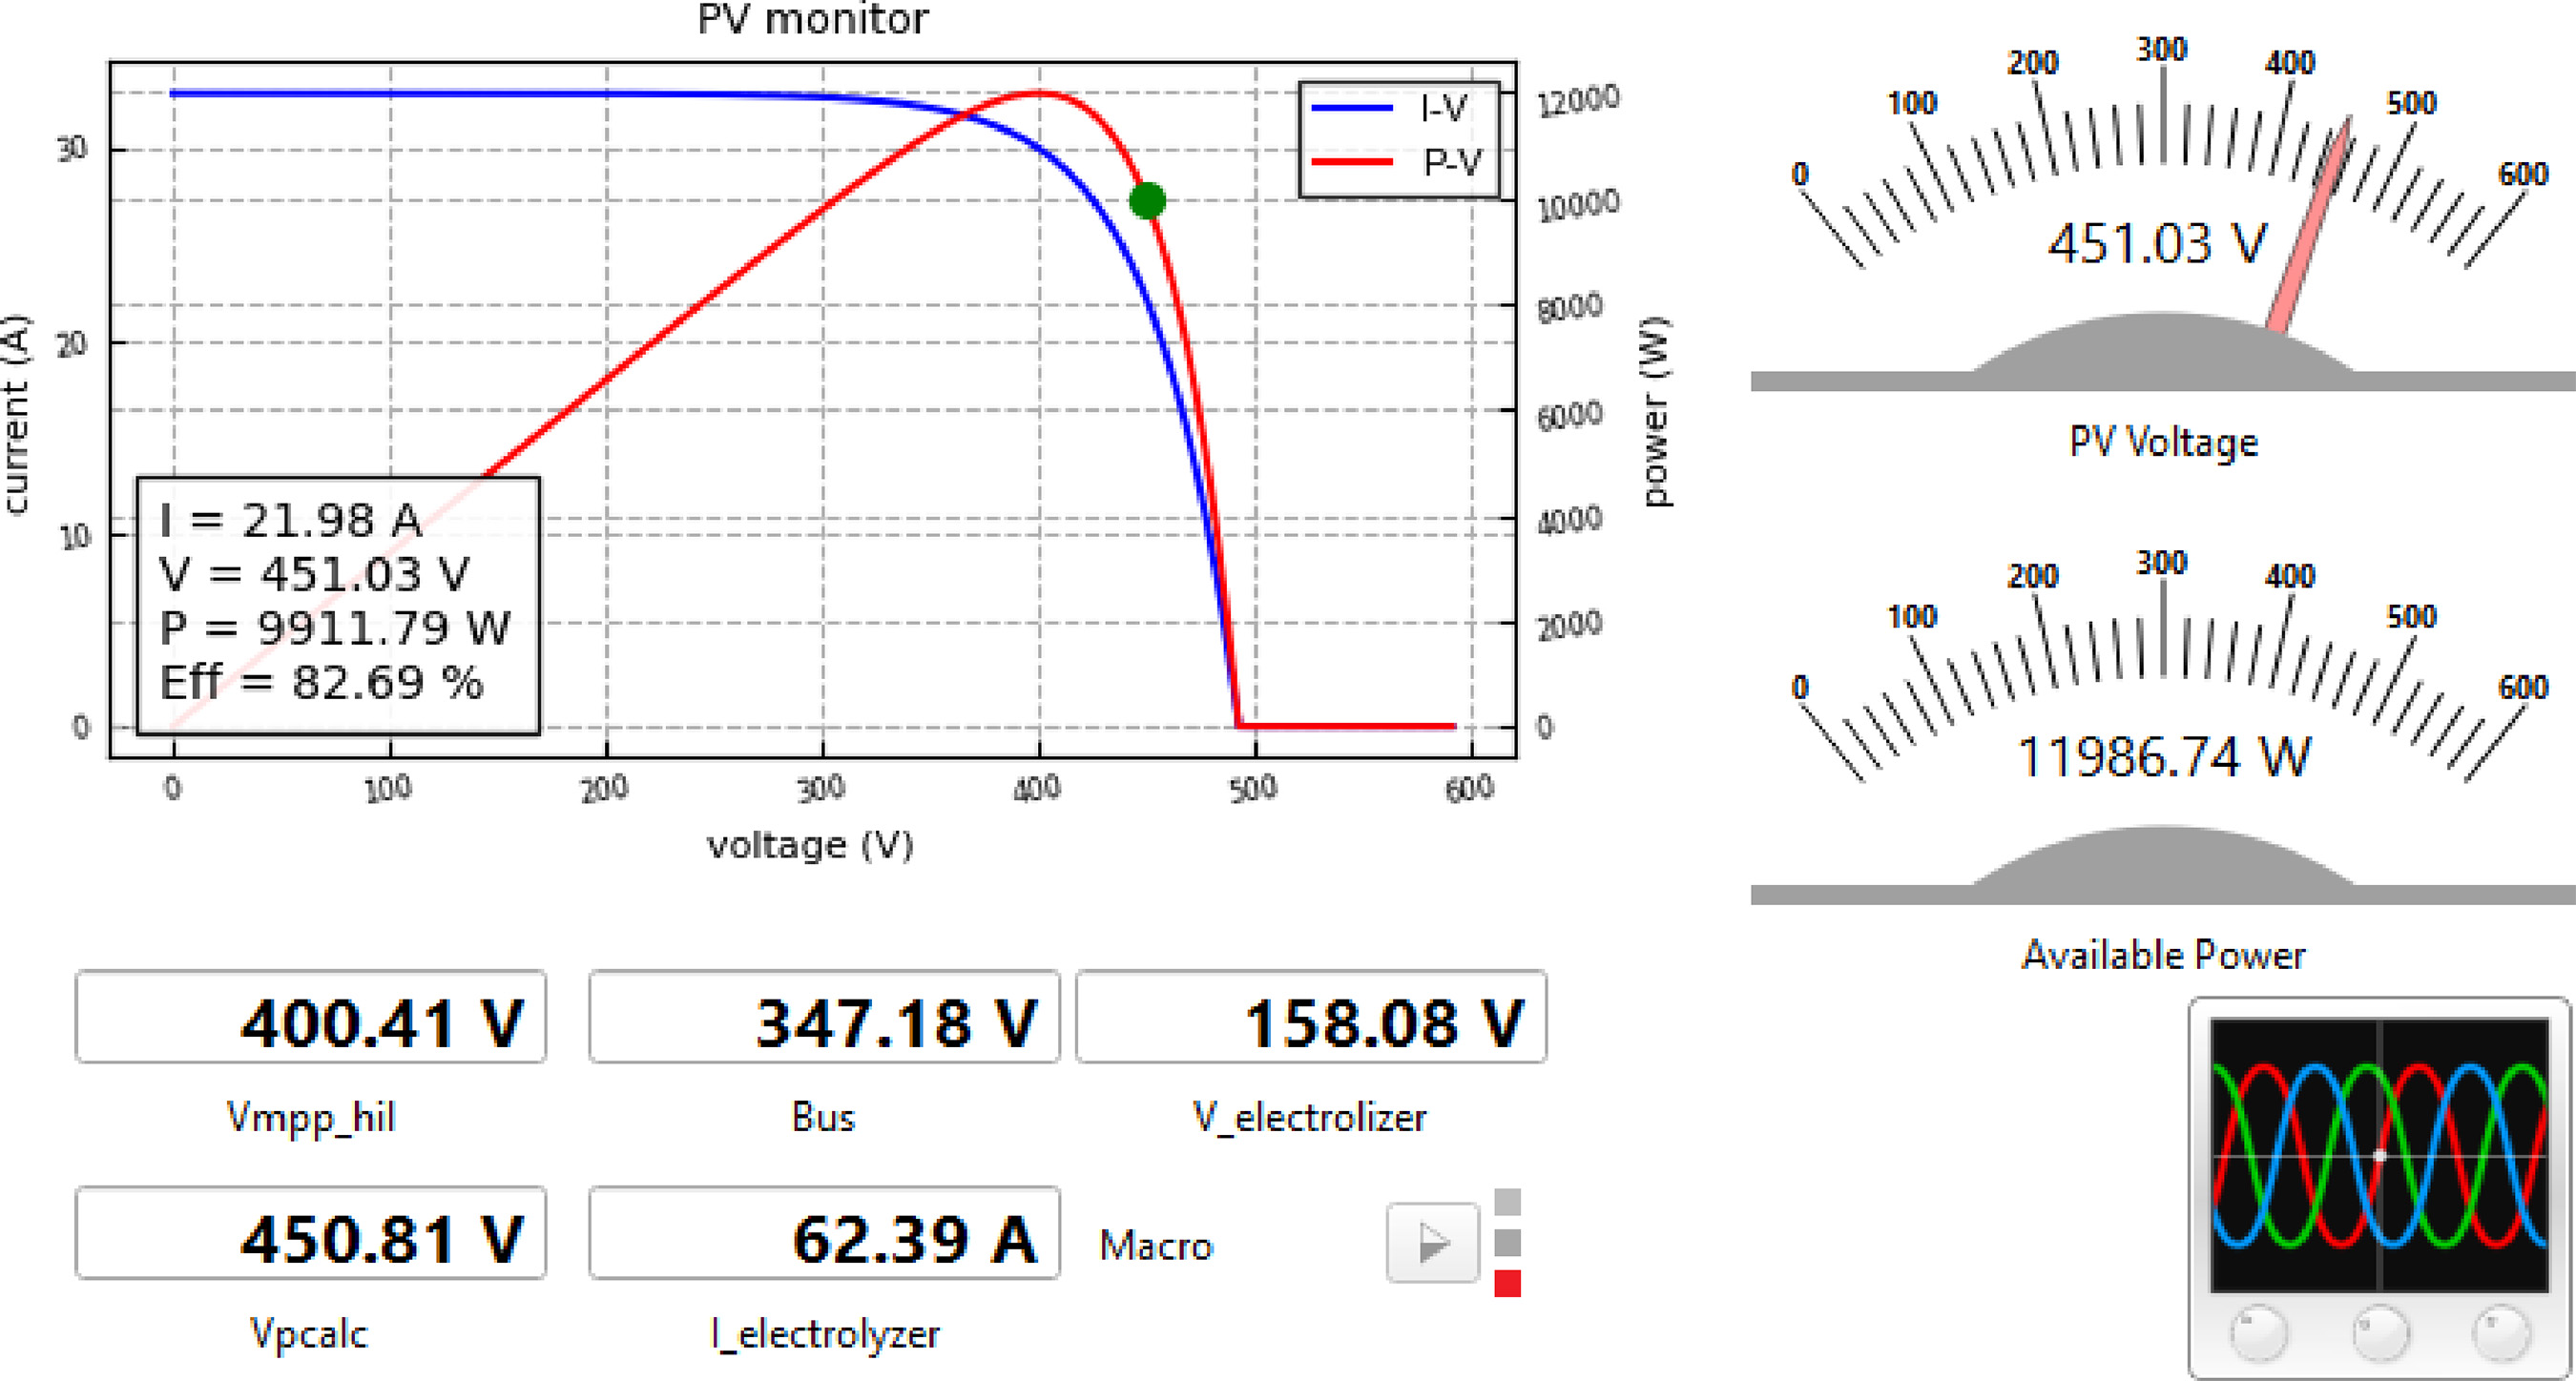
A SCADA application, shown in Fig. 17, was created in Typhoon HIL SCADA to monitor and control important variables such as irradiance and PV array temperature. Fig.17 displays the real-time SCADA, monitoring the PV curves, the PV voltage and other electrical variables of the system.

Real-time SCADA, monitoring PV curves and electrical variables of the system. In this scenario, the PV array is generating more power than the required from the electrolyzer.
The control system sets the current provided to the electrolyzer to Inom. The bus capacitor increases to almost 310 V. As can be seen, the bus voltage in Fig.18 b) increases until reaching steady state value. The voltage on the filter capacitor rapidly increases to Voc, which is then recorded by the DSP. As can be observed, the bus voltage (in Fig. 18 b)) increases until reaching its expected steady-state operation. Fig. 18 a) shows the inductor currents (iL2(1,2,3)), where a high-frequency ripple is observed due to the switching operation. The waveform demonstrates the expected behavior of the three-phase interleaved structure, with currents sharing the total load. Fig. 18 b) displays the voltages across the converter.

Main electrical quantities of the system operating with temperature-based MPPT: a) second stage inductor current (iL1,2) and the electrolyzer current (ie) and b) dc bus voltage (vbus).

Main electrical parameters obtained from HIL SCADA controlled by the microcontroller TMS320F280969M during the validation against the EN50530 standard; a) first and second stage inductor currents; b) voltage on the photovoltaic array and voltage on the dc-bus; c) filter capacitor voltage and filter inductor current.
Fig. 19 presents the converter’s main electrical quantities to validate the control system against the EN50530 standard [42]. The irradiance and temperature varies during the day. During the MPPT calculation, the measurement of Voc is realized to estimate temperature and the MPP, for that, the first stage converter’s lower and upper IGBT switches are opened so the current is brought to zero. The voltage on the filter capacitor quickly increases its voltage to Voc, which is recorded by the DSP.
To calculate the efficiencies of the proposed two-stage power conversion system across its operational input power range, the power-losses tool of the Typhoon HIL platform was used. This analysis provides an insight into the efficiency distribution within the cascaded architecture. The IBGT IKW30N65H5 was considered, and other losses (gate-driver, inductors and capacitors) were considered equal to 20 W in each stage. The result is illustrated in Fig. 20 illustrates four distinct efficiency metrics. First Stage: This curve represents the efficiency of the initial DC-DC conversion stage, η1. Second Stage: This curve represents the efficiency of the subsequent conversion stage, η2. This stage is responsible for the final output voltage regulation and ripple suppression, and its efficiency is calculated as the ratio of the converter’s output power to the power received from the first stage, Pin_2. Converter Stage: This curve displays the overall DC-DC converter efficiency, η3, calculated as the product of the individual stage efficiencies (η3 = η1 · η2). This metric reflects the total electrical conversion performance of the cascaded topology. System: This curve presents the estimated overall system efficiency, ηt. This metric integrates the electrical conversion efficiency with the MPPT performance, calculated as ηt = η3 · 0.9925. The 99.25% factor represents the steady-state tracking efficiency of the MPPT algorithm, providing a realistic approximation of the net power transfer from the photovoltaic array to the load under continuous operation.

V. CONCLUSION
This work has proposed the modeling, design, and control of an interleaved buck converter with N cells based on a linearized state space model for an electrolyzer system. The interleaved design allows for a current distribution among phases, which can be understood as its main advantage vsain the proposed application, since the voltage fluctuation on the input diminishes the potential advantage of the ripple cancellation of the interleaved converter.
The two-stage converter, along with the control strategy, allows the PV array to operate either MPP or on the required reference current of the electrolyzer. The MPPT was evaluated against the theoretical maximum power, according to EN 50530, and resulted in an efficiency of 99.25%. MPPT tracking and current reference tracking. These results confirm the proper operation of the control system, ensuring stable voltage and current waveforms throughout the MPPT process. The transient response observed in the waveforms aligns with the expected system dynamics during variations in irradiance and temperature. These results confirm the proper operation of the control system, ensuring stable voltage and current waveforms. However, the series connection of the stages reduces the global efficiency of the converter, a parallel strategy may be useful to reduce the power variation in the electrolyzer while maintaining efficiency levels.
A further limitation concerning the system design and the fluctuating voltage on the DC bus is the inability to fully exploit the ripple reduction capability intrinsic to the interleaved converter across the complete operational spectrum. Specifically for the three-phase configuration selected, this advantageous characteristic is partially lost when the duty cycle (D) is near 0.5 (D ≈ 0.5). In this case, the ripple reduction is one-third in comparison with buck converter with the same output filter.
The proposed capacitor dimensioning, along with the droop control, results in a safe driver for the electrolyzer, the strategy may result in conservative values for the bus capacitance. The final decision takes into account the limits on equipment, increase in cost and volume.
-
PLAGIARISM POLICY
This article was submitted to the similarity system provided by Crossref and powered by iThenticate – Similarity Check.
DATA AVAILABILITY
The data used in this research is available in the body of the document.
REFERENCES
- 1 EPE, “Bases para a Consolidação da Estratégia Brasileira do Hidrogênio”, , 2 2021.
-
2 J. B. West, “Henry Cavendish (1731-1810): Hydrogen, carbon dioxide, water, and weighing the world”, American Journal of Physiology - Lung Cellular and Molecular Physiology, vol. 307, pp. 2–7, 2014, doi:10.1152/ajplung.00067.2014.
» https://doi.org/10.1152/ajplung.00067.2014 -
3 H. Renaudineau, A. M. Llor, R. Cortés D., C. A. Rojas, C. Restrepo, S. Kouro, “Photovoltaic Green Hydrogen Challenges and Opportunities: A Power Electronics Perspective”, IEEE Industrial Electronics Magazine, vol. 16, no. 1, pp. 31–41, 2022, doi:10.1109/MIE.2021.3120705.
» https://doi.org/10.1109/MIE.2021.3120705 -
4 DOU, “Lei n° 14.948, de 2 de agosto de 2024”, Diário Oficial da União, Brasil, 2024, URL: https://www.in.gov.br/en/web/dou/-/lei-n-14.948-de-2-de-agosto-de-2024-576003914
» https://www.in.gov.br/en/web/dou/-/lei-n-14.948-de-2-de-agosto-de-2024-576003914 - 5 EPE, “BEN Relatório Síntese 2024”, , 2024.
-
6 G. Notton, M. L. Nivet, C. Voyant, C. Paoli, C. Darras, F. Motte, A. Fouilloy, “Intermittent and stochastic character of renewable energy sources: Consequences, cost of intermittence and benefit of forecasting”, Renewable and Sustainable Energy Reviews, vol. 87, no. August 2017, pp. 96– 105, 2018, doi:10.1016/j.rser.2018.02.007, URL: https://doi. org/10.1016/j.rser.2018.02.007
» https://doi.org/10.1016/j.rser.2018.02.007» https://doi. org/10.1016/j.rser.2018.02.007 - 7 Z. Dobó, Á. B. Palotás, P. Tóth, “The effect of power supply ripple on DC water electrolysis efficiency”, Materials Science and Engineering, vol. 41, no. 1, pp. 23–31, 2016.
-
8 X. Meng, M. Chen, M. He, X. Wang, J. Liu, “A Novel High Power Hybrid Rectifier With Low Cost and High Grid Current Quality for Improved Efficiency of Electrolytic Hydrogen Production”, IEEE Transactions on Power Electronics, vol. 37, no. 4, pp. 3763–3768, 2022, doi:10.1109/TPEL.2021.3126725.
» https://doi.org/10.1109/TPEL.2021.3126725 -
9 S. Mohamadian, R. Ghandehari, A. Shoulaie, “A comparative study of AC/DC converters used in high current applications”, in 2011 2nd Power Electronics, Drive Systems and Technologies Conference, pp. 604–609, 2011, doi:10.1109/PEDSTC.2011.5742491.
» https://doi.org/10.1109/PEDSTC.2011.5742491 -
10 T. L. Gibson, N. A. Kelly, “Predicting efficiency of solar powered hydrogen generation using photovoltaic-electrolysis devices”, International Journal of Hydrogen Energy, vol. 35, no. 3, pp. 900–911, 2010, doi:10.1016/j.ijhydene.2009.11.074, URL: http://dx.doi.org/10.1016/j.ijhydene.2009.11.074
» https://doi.org/10.1016/j.ijhydene.2009.11.074» http://dx.doi.org/10.1016/j.ijhydene.2009.11.074 -
11 H. Renaudineau, N. Vergara-Rosales, A. M. Llor, S. Kouro, “Green hydrogen production from offgrid photovoltaic: An assessment on optimal sizing”, Renewable Energy, vol. 246, p. 122794, 2025, doi:https://doi.org/10.1016/j.renene.2025.122794, URL: https://www.sciencedirect.com/science/article/pii/ S0960148125004562
» https://doi.org/10.1016/j.renene.2025.122794» https://www.sciencedirect.com/science/article/pii/ S0960148125004562 -
12 J. M. Stansberry, J. Brouwer, “Experimental dynamic dispatch of a 60 kW proton exchange membrane electrolyzer in power-to-gas application”, International Journal of Hydrogen Energy, vol. 45, no. 16, pp. 9305–9316, 2020, doi:10.1016/j.ijhydene.2020.01.228, URL: https://doi.org/10. 1016/j.ijhydene.2020.01.228
» https://doi.org/10.1016/j.ijhydene.2020.01.228» https://doi.org/10. 1016/j.ijhydene.2020.01.228 -
13 V. A. Martinez Lopez, H. Ziar, J. W. Haverkort, M. Zeman, O. Isabella, “Dynamic operation of water electrolyzers: A review for applications in photovoltaic systems integration”, Renewable and Sustainable Energy Reviews, vol. 182, no. September 2022, p. 113407, 2023, doi:10.1016/j.rser.2023.113407, URL: https://doi.org/10.1016/j.rser.2023.113407
» https://doi.org/10.1016/j.rser.2023.113407» https://doi.org/10.1016/j.rser.2023.113407 -
14 J. Eichman, K. Harrison, M. Peters, “Novel Electrolyzer Applications : Providing More Than Just Hydrogen Novel Electrolyzer Applications : Providing More Than Just Hydrogen”, NREL Report, pp. 1–24, 2014, URL: www.nrel.gov/publications.%0Ahttp://www.nrel.gov/docs/ fy14osti/61758.pdf
» www.nrel.gov/publications.%0Ahttp://www.nrel.gov/docs/ fy14osti/61758.pdf -
15 A. Garrigós, J. M. Blanes, J. A. Carrasco, J. L. Lizán, R. Beneito, J. A. Molina, “5 kW DC/DC converter for hydrogen generation from photovoltaic sources”, Renewable Energy, vol. 35, pp. 6123–6130, 2010, doi:10.1016/j.ijhydene.2010.03.131.
» https://doi.org/10.1016/j.ijhydene.2010.03.131 -
16 Y. Machida, A. Goto, A. Takahashi, S. Funabiki, “Energy Management of Hydrogen-Storage Photovoltaic Generation System with a Function of Suppressing Short-Period Components”, 2018 International Power Electronics Conference, IPEC-Niigata - ECCE Asia 2018, pp. 2449–2455, 2018, doi:10.23919/IPEC.2018.8507572.
» https://doi.org/10.23919/IPEC.2018.8507572 -
17 H. Niaz, M. M. Lakouraj, J. Liu, “Techno-economic feasibility evaluation of a standalone solar-powered alkaline water electrolyzer considering the influence of battery energy storage system: A Korean case study”, Korean Journal of Chemical Engineering, vol. 38, pp. 1617–1630, 8 2021, doi:10.1007/s11814-021-0819-z.
» https://doi.org/10.1007/s11814-021-0819-z - 18 T. F. Rech, T. Orlando, R. F. Coelho, “Step-Down Converter for Low Current Ripple in Electrolyzer with MPPT Control Strategy”, .
-
19 J. Koponen, A. Kosonen, V. Ruuskanen, K. Huoman, M. Niemelä, J. Ahola, “Control and energy efficiency of PEM water electrolyzers in renewable energy systems”, International Journal of Hydrogen Energy, vol. 42, no. 50, pp. 29648–29660, 2017, doi:https://doi.org/10.1016/j.ijhydene.2017.10.056, URL: https://www.sciencedirect.com/science/article/pii/ S036031991733954X
» https://doi.org/10.1016/j.ijhydene.2017.10.056» https://www.sciencedirect.com/science/article/pii/ S036031991733954X -
20 M. Becker, J. Brauns, T. Turek, “Battery-Buffered Alkaline Water Electrolysis Powered by Photovoltaics”, Chemie Ingenieur Technik, vol. 93, no. 4, pp. 655–663, 2021, doi:https://doi.org/10.1002/cite.202000151, URL: https://onlinelibrary.wiley.com/doi/abs/10.1002/cite.202000151, https://onlinelibrary.wiley.com/doi/pdf/10.1002/cite.202000151
» https://doi.org/10.1002/cite.202000151» https://onlinelibrary.wiley.com/doi/abs/10.1002/cite.202000151» https://onlinelibrary.wiley.com/doi/pdf/10.1002/cite.202000151 -
21 I. N. de Pesquisas Espaciais, “Sistema de Organização Nacional de Dados Ambientais”, URL: https://sonda.ccst.inpe. br/basedados/florianopolis.html
» https://sonda.ccst.inpe. br/basedados/florianopolis.html -
22 H. P. Buitendach, R. Gouws, C. A. Martinson, C. Minnaar, D. Bessarabov, “Effect of a ripple current on the efficiency of a PEM electrolyser”, Results in Engineering, vol. 10, 2021, doi:10.1016/j.rineng.2021.100216.
» https://doi.org/10.1016/j.rineng.2021.100216 -
23 J. Koponen, V. Ruuskanen, A. Kosonen, M. Niemela, J. Ahola, “Effect of Converter Topology on the Specific Energy Consumption of Alkaline Water Electrolyzers”, IEEE Transactions on Power Electronics, vol. 34, no. 7, pp. 6171–6182, 2019, doi:10.1109/TPEL.2018.2876636.
» https://doi.org/10.1109/TPEL.2018.2876636 -
24 V. Ruuskanen, J. Koponen, A. Kosonen, M. Hehemann, R. Keller, M. Niemelä, J. Ahola, “Power quality estimation of water electrolyzers based on current and voltage measure-ments”, Journal of Power Sources, vol. 450, no. December, 2020, doi:10.1016/j.jpowsour.2019.227603.
» https://doi.org/10.1016/j.jpowsour.2019.227603 -
25 V. Ruuskanen, J. Koponen, A. Kosonen, M. Niemelä, J. Ahola, A. Hämäläinen, “Power quality and reactive power of water electrolyzers supplied with thyristor converters”, Journal of Power Sources, vol. 459, no. December 2019, 2020, doi:10.1016/j.jpowsour.2020.228075.
» https://doi.org/10.1016/j.jpowsour.2020.228075 - 26 V. Guida, D. Guilbert, B. Douine, “Literature Survey of Interleaved DC-DC Step-Down Converters for Proton Exchange Membrane Electrolyzer Applications”, Transactions on Environment and Electrical Engineering, vol. 3, no. 1, 2019.
-
27 D. Guilbert, D. Sorbera, G. Vitale, “A stacked interleaved DC-DC buck converter for proton exchange membrane electrolyzer applications: Design and experimental validation”, International Journal of Hydrogen Energy, vol. 45, no. 1, pp. 64–79, 2020, doi:10.1016/j.ijhydene.2019.10.238, URL: https: //doi.org/10.1016/j.ijhydene.2019.10.238
» https://doi.org/10.1016/j.ijhydene.2019.10.238» https: //doi.org/10.1016/j.ijhydene.2019.10.238 -
28 M. C. Mira, Z. Zhang, K. L. Jorgensen, M. A. Andersen, “Fractional Charging Converter with High Efficiency and Low Cost for Electrochemical Energy Storage Devices”, in IEEE Transactions on Industry Applications, vol. 55, pp. 7461– 7470, Institute of Electrical and Electronics Engineers Inc., nov 2019, doi:10.1109/TIA.2019.2921295.
» https://doi.org/10.1109/TIA.2019.2921295 -
29 J. W. Zapata, S. Kouro, G. Carrasco, H. Renaudineau, T. A. Meynard, “Analysis of Partial Power DC-DC Converters for Two-Stage Photovoltaic Systems”, IEEE Journal of Emerging and Selected Topics in Power Electronics, vol. 7, no. 1, pp. 591–603, 2019, doi:10.1109/JESTPE.2018.2842638.
» https://doi.org/10.1109/JESTPE.2018.2842638 -
30 T. F. Rech, M. Constantino Orige, L. Schmitz, M. L. Heldwein, T. Brunelli Lazzarin, A. L. Kirsten, R. Francisco Coelho, “A Case Study on Modelling, Design, and Optimization of an Interleaving Buck Converter for Powering a Hydrogen Electrolyzer”, pp. 1–7, 2024, doi:10.1109/ECCEEurope62508.2024.10752079.
» https://doi.org/10.1109/ECCEEurope62508.2024.10752079 -
31 M. Kasper, D. Bortis, J. W. Kolar, “Scaling and balancing of multi-cell converters”, 2014 International Power Electronics Conference, IPEC-Hiroshima - ECCE Asia 2014, pp. 2079– 2086, 2014, doi:10.1109/IPEC.2014.6869875.
» https://doi.org/10.1109/IPEC.2014.6869875 -
32 F. J. Brito, M. L. Heldwein, R. P. Bascope, “Active current balancing technique employing the Lunze’s transformation for converters based on multistate switching cells”, 2015 IEEE 13th Brazilian Power Electronics Conference and 1st Southern Power Electronics Conference, COBEP/SPEC 2016, , no. Dcm, 2015, doi:10.1109/COBEP.2015.7420159.
» https://doi.org/10.1109/COBEP.2015.7420159 -
33 J. A. Oliver, P. Zumel, O. García, J. A. Cobos, J. Uceda, “Passive component analysis in interleaved buck converters”, Conference Proceedings - IEEE Applied Power Electronics Conference and Exposition - APEC, vol. 1, no. C, pp. 623– 628, 2004, doi:10.1109/apec.2004.1295871.
» https://doi.org/10.1109/apec.2004.1295871 - 34 R. F. Coelho, L. Schmitz, D. C. Martins, Energia Solar Fotovoltaica: Geração, Conversão e Aplicações, Roberto Francisco Coelho, Lenon Schmitz, Sep. 2022.
-
35 M. B. Hossain, M. R. Islam, K. M. Muttaqi, D. Sutanto, A. P. Agalgaonkar, “Dynamic Electrical Circuit Modeling of a Proton Exchange Membrane Electrolyzer for Frequency Stability, Resiliency, and Sensitivity Analysis in a Power Grid”, IEEE Transactions on Industry Applications, vol. 59, no. 6, pp. 7271–7281, 2023, doi:10.1109/TIA.2023.3297985.
» https://doi.org/10.1109/TIA.2023.3297985 -
36 S. Kélouwani, K. Agbossou, R. Chahine, “Model for energy conversion in renewable energy system with hydrogen storage”, Journal of Power Sources, vol. 140, pp. 392–399, 2005, doi:10.1016/j.jpowsour.2004.08.019.
» https://doi.org/10.1016/j.jpowsour.2004.08.019 -
37 Øystein Ulleberg, “Modeling of advanced alkaline electrolyzers: A system simulation approach”, International Journal of Hydrogen Energy, vol. 28, pp. 21–33, 2003, doi:10.1016/S03603199(02)00033-2.
» https://doi.org/10.1016/S03603199(02)00033-2 -
38 M. Yousuf, K. Zeb, “Design and Analysis of DC-DC Two-Phase Interleaved Buck Converter for EV Charging Applications”, in 2023 18th International Conference on Emerging Technologies (ICET), pp. 80–85, 2023, doi:10.1109/ICET59753.2023.10374676.
» https://doi.org/10.1109/ICET59753.2023.10374676 -
39 J. D. Logan, A First Course in Differential Equations, 3rd ed., Springer-Verlag, New York, 2015, URL: https://www.math.unl.edu/~jlogan1/PDFfiles/New3rdEditionODE.pdf
» https://www.math.unl.edu/~jlogan1/PDFfiles/New3rdEditionODE.pdf - 40 J.-J. E. Slotine, W. Li, Applied Nonlinear Control, PrenticeHall, Englewood Cliffs, NJ, 1991.
-
41 K. Y. Yap, C. R. Sarimuthu, J. M.-Y. Lim, “Artificial Intelligence Based MPPT Techniques for Solar Power System: A review”, Journal of Modern Power Systems and Clean Energy, vol. 8, no. 6, pp. 1043–1059, 2020, doi:10.35833/MPCE.2020.000159.
» https://doi.org/10.35833/MPCE.2020.000159 -
42 F. Baumgartner, A. Bergmann, B. Burger, H. Häberlin, N. Henze, R. Brundlinger, “prEN 50530 - The New European Standard for Performance Characterisation of PV Inverters”, , 2009, URL: https://api.semanticscholar.org/CorpusID: 55634769
» https://api.semanticscholar.org/CorpusID: 55634769
Edited by
-
Associate Editor
Fernanda de M. Carnielutti https://orcid.org/0000-0001-8257-7580
-
Editor-in-Chief
Heverton A. Pereira https://orcid.org/0000-0003-0710-7815