 DIGITAL DEVICES FOR GRAIN CLASSIFICATION: EFFICIENCY AND ACCURACY IN THE FOOD INDUSTRY
ABSTRACT
The grain classification process, essential in the industry, has traditionally relied on manual methods that are prone to inaccuracies and delays. The introduction of computer vision has revolutionized this scenario, enabling faster and more precise analyses. This study evaluated a digital classification device for identifying defects in rice grains, aiming to assess its reliability and associated benefits. Processed rice samples were manually classified by trained classifiers and subsequently analyzed using the Machvision Rice Analyzer equipment. A comparison of the results revealed remarkable consistency, validated by statistical analyses (including principal component analysis). The equipment achieved an average efficiency of 93.13% compared to the classifiers, with particular emphasis on the identification of defects, such as “chopped + stained” and “white belly”. Furthermore, multivariate analysis highlighted the significance of the “chalky” and “white belly” components in classification. The study concluded that adopting computer vision provides a reliable advantage, enhancing the standardization and efficiency of the grain classification process.
rice; categorization; digital tools; precision; food processing sector
INTRODUCTION
Quality and industrial standardization are guided by both legislation and internal standards set by individual companies. Generally, grain classification aims to assess the quality of a given batch by evaluating defects and ensuring compliance with both industry standards and legal regulations. Traditionally, manual visual classification has been employed for this purpose. However, when subjected to multiple classifiers, manual classification may yield varying results, demonstrating that the process is influenced not only by the classifier’s training and qualification but also by subjective factors such as the vision and interpretation of the classifier and the duration of the shift (Patrício, 2018).
Manual visual classification, in addition to its potential for inaccuracies, is a time-consuming process (Chen et al., 2019). The time required for sampling depends on the quantity of the products and the extent of defects, which often leads industries to reduce the number of batches to expedite decision-making. However, ensuring that sampling remains reliable for batch representation is crucial.
The development of digital image processing technology has advanced the precision of rice classification and defect detection (Trisnawan & Hariyanto, 2019). Currently, computer vision equipment integrated with verification algorithms enable automatic classification, transforming manual visual methods into efficient digital processes that allow for quicker and more accurate readings.
In the light of this context, the objective of this study was to evaluate a digital classification device, investigating its reliability for the automated identification of defects in rice grains. Additionally, this study explored the intrinsic benefits of this system in enhancing classification efficiency and accuracy.
MATERIAL AND METHODS
Predefined samples of benefited rice from varietal mixtures or the IRGA 424 RI cultivar, with known defects, were sourced from two industrial units. A total of 4164 samples were analyzed, including 2424 from unit 1 and 1740 from unit 2.
Defects were classified according to Brazilian legislation (IN MAPA 06/2009) (Brasil, 2009) and industry standards. The defects evaluated included “chalky,” “yellow,” “chopped + stained,” “moldy + burnt,” and “white belly” (a commercial defect).
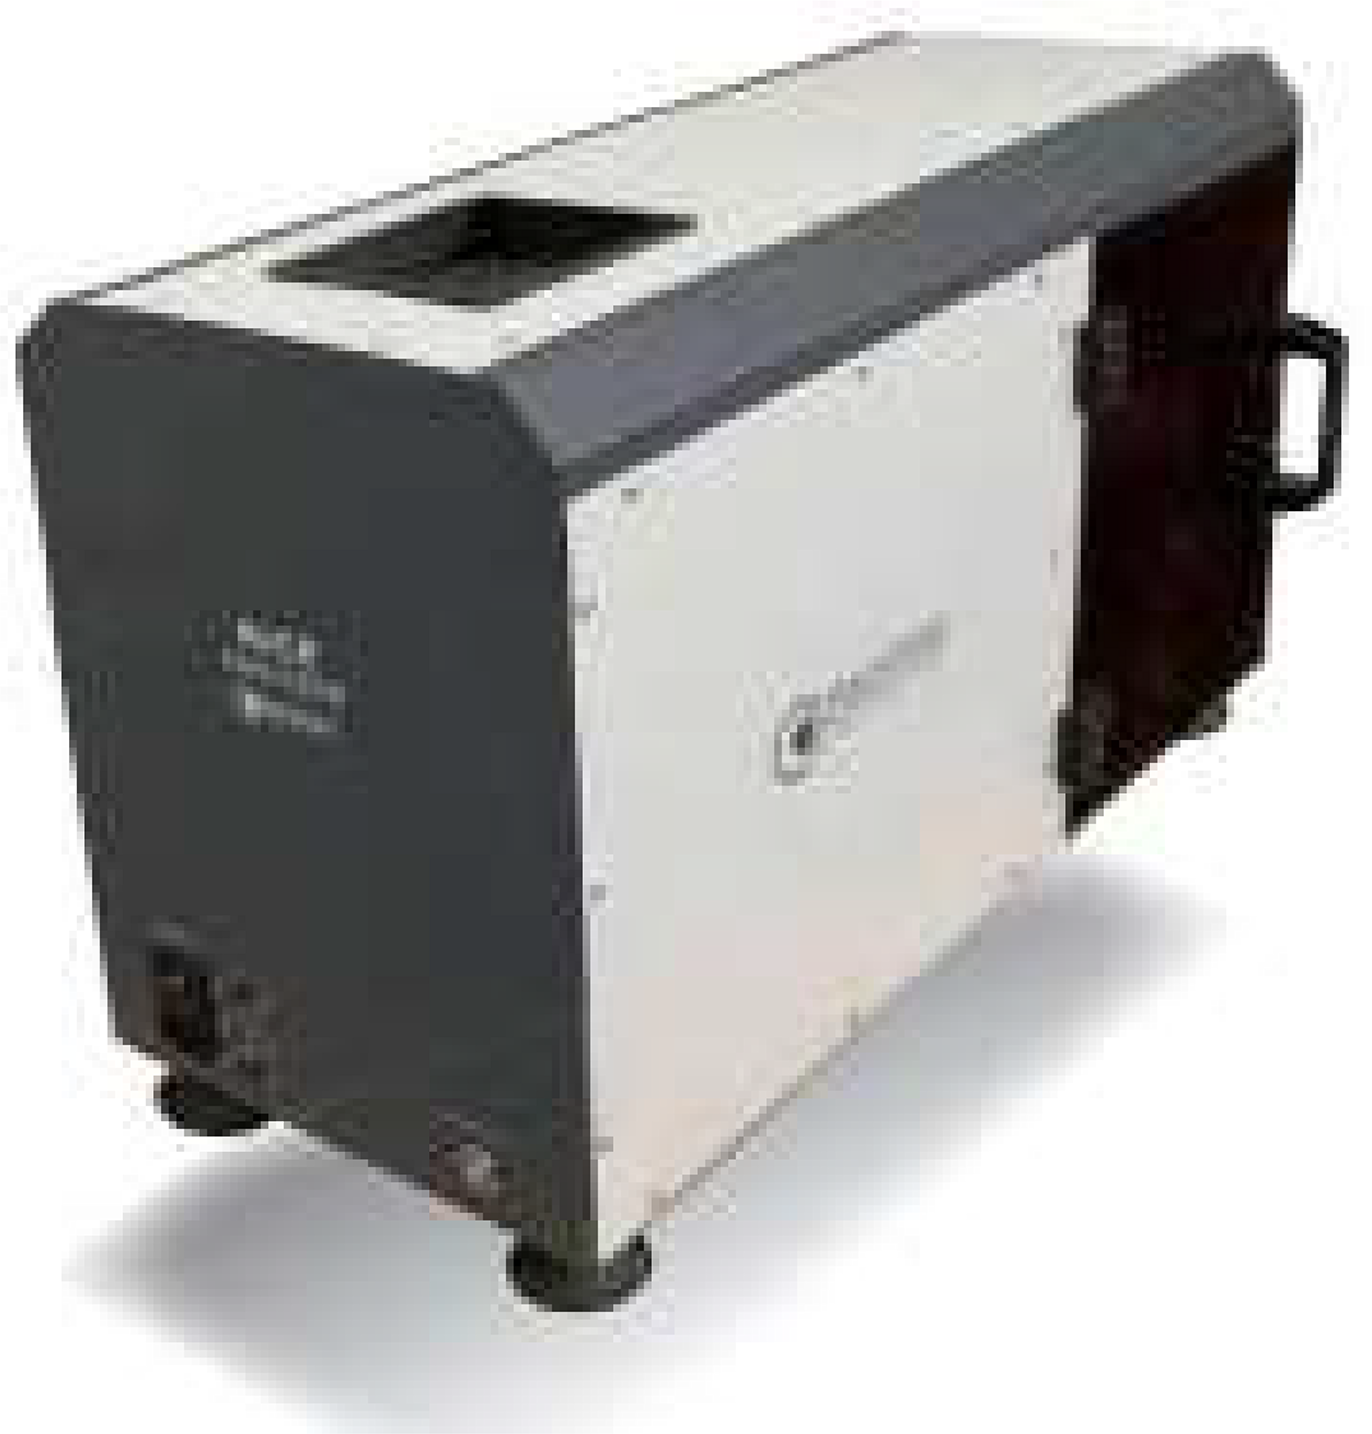
The paddy rice samples were processed using the PAZ-1/DTA rice testing equipment, Machvision, Argentina. After processing, trained classifiers manually classified the defects in each sample, with a time interval of 15–30 min between reading and recording. Following manual classification, the same samples were examined using Machvision, a digital image analysis system, model Rice Analyzer (Figure 1). The equipment comprises a digital camera that captures images of the grains as they are transported on a conveyor belt.
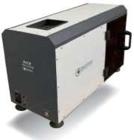
The analyses generated reports by differentiating defects, determining properties, and separating impurities using computer vision technology. Information was extracted based on color during image processing, with the number of pixels of the selected color within the grain being calculated as a percentage, thus allowing the detection and quantification of specific colors related to defects (Manual Machvision, s/d).
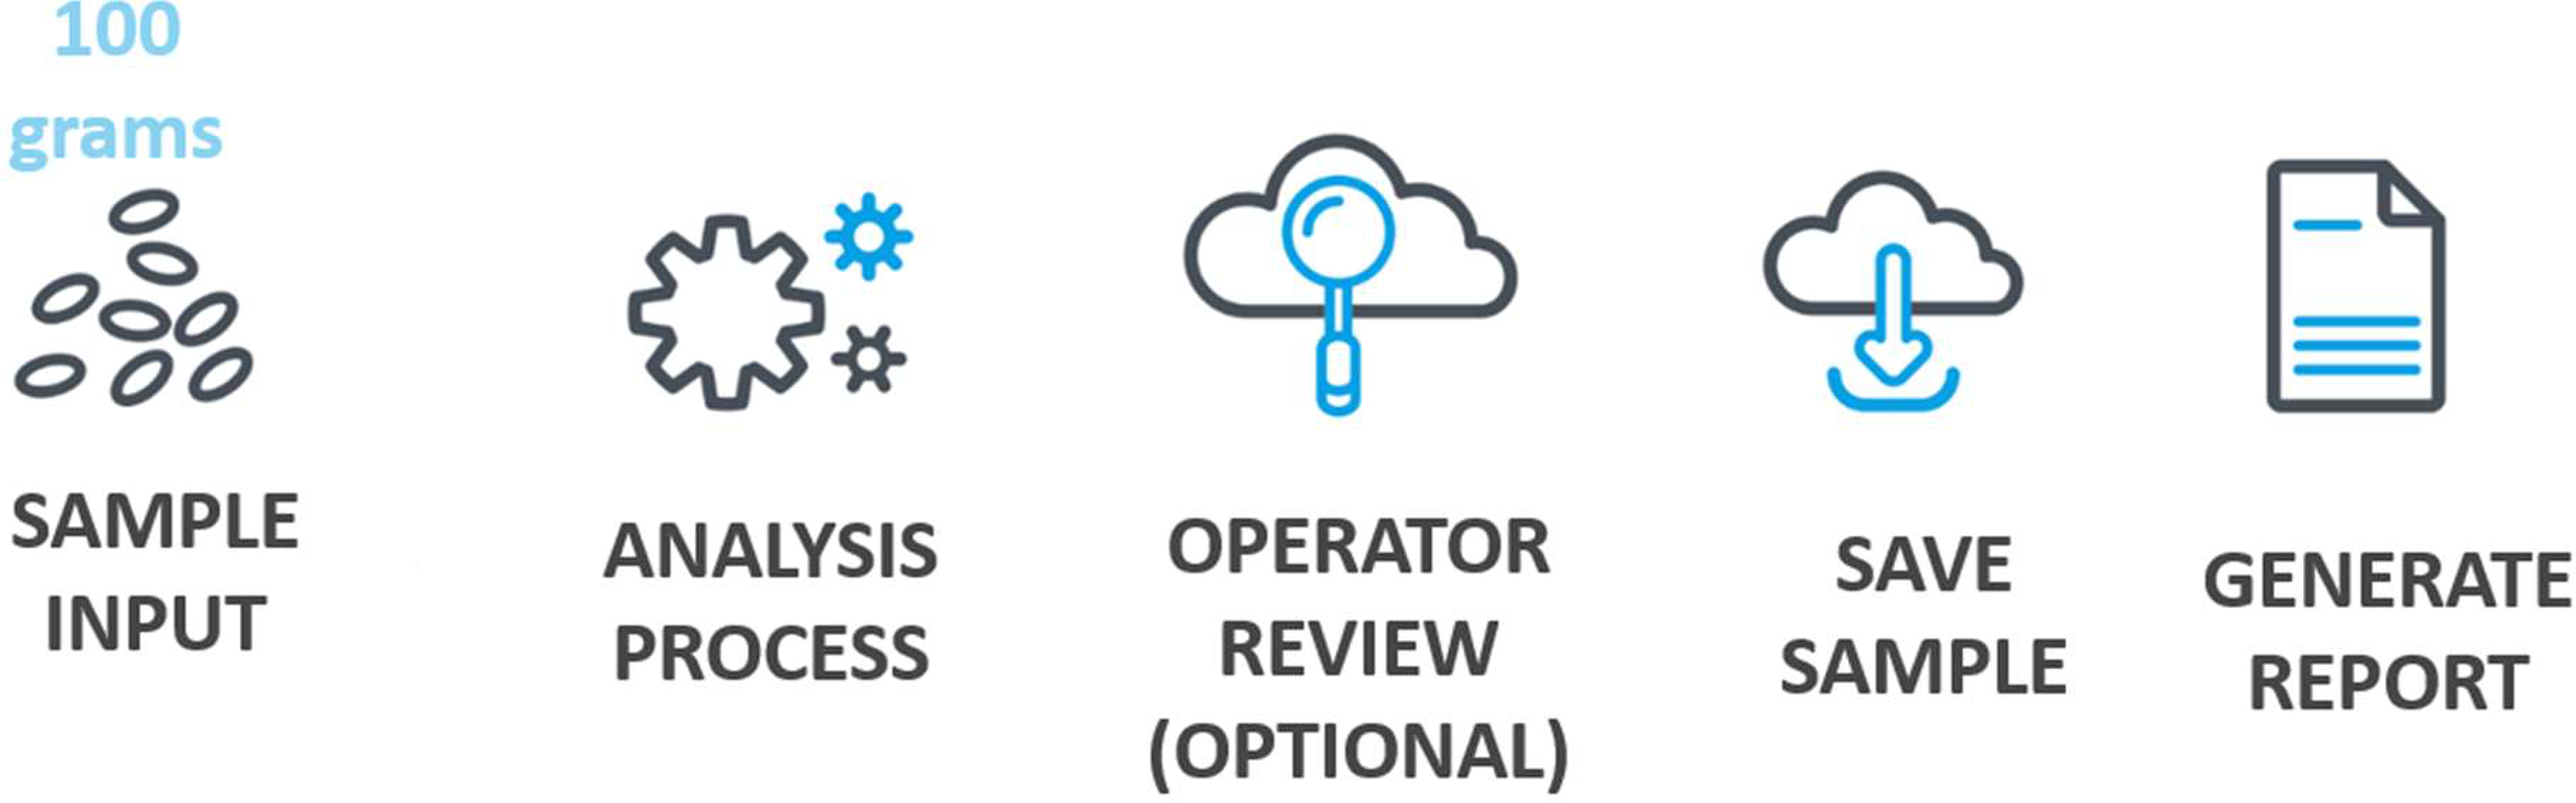
Classification configurations were created using samples classified by multiple classifiers, with consensus on defect identification. Subsequently, the equipment was parameterized for each configuration (commonly referred to as a recipe or job). For each location or product (raw material or finished product), the parameters of hue, sharpness, color, and brightness were adjusted. Once the system was calibrated, the classifiers assessed whether the automated classification was consistent with the manual classification (Figure 2).
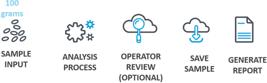
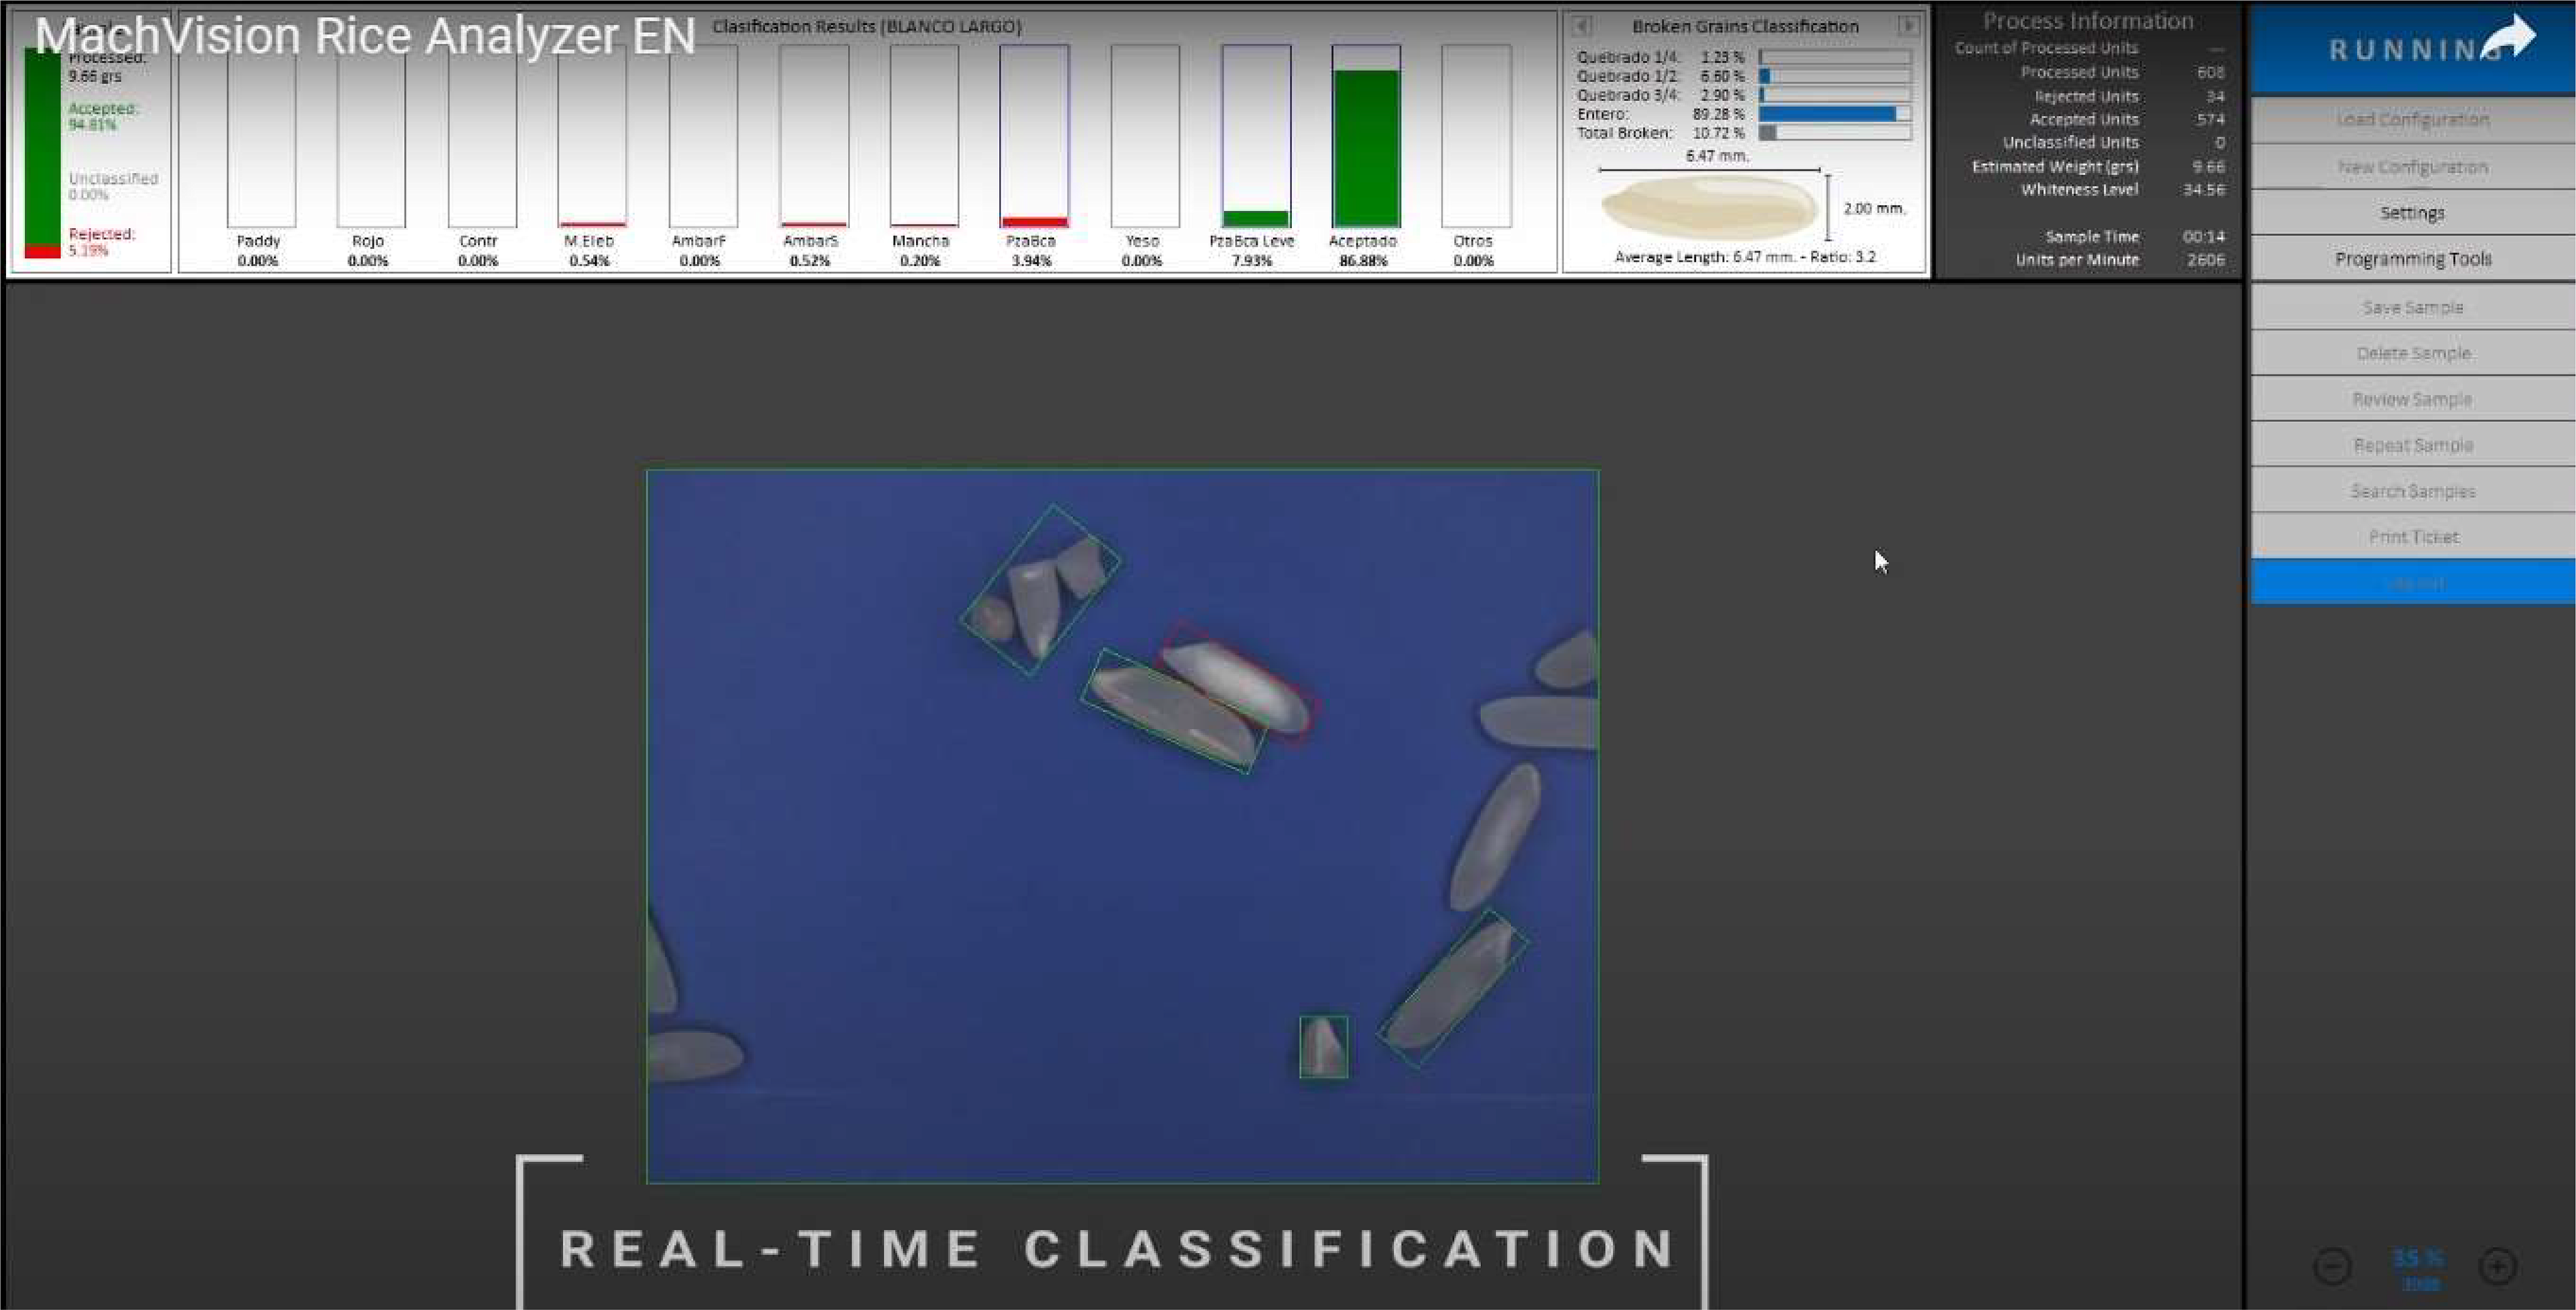
The Machvision equipment can analyze 100 g of sample by 60 s, performing a multispectral reading in the RGB + infrared spectra (850/940 nm). It also measures length and width, analyzes and classifies foreign defects and bodies and generates detailed reports. Figure 3 illustrates the results of the real -time classification, with red bar graphs indicating defects and green representing approved samples. In addition, percentages of broken and whole grains are displayed, although these aspects are not discussed in this study.
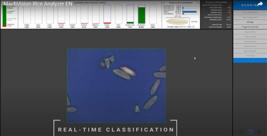
Screenshot of the computer vision equipment during analysis of milled rice. Source: Machvision analysis process in computer vision equipment (2024).
Image segmentation using hue, saturation, and brightness (HSV) was used for classification. According to Sural et al. (2002), the HSV color space differs from the RGB color space in that it separates the intensity (luminance) from the color information (chromaticity). By revisiting the two axes of chromaticity, discrepancies in hue are observed to be more prominent than those in saturation. In the context of each pixel, its dominant characteristic is determined by its hue or intensity, with carefully consideration of its saturation. This approach offers a robust method for pixel analysis and categorization, enhancing the understanding of chromatic nuances in the image.
The efficiency of the computer vision equipment was evaluated based on the performance of the trained classifiers, as they are considered the current standard. Efficiency was calculated using the following equation (Equation 1), where the results are expressed as percentages for all defects analyzed:
Where:
Mach and Man represent the defect reading obtained using the equipment and by the trained classifier, respectively.
The data obtained by classifiers and equipment were tested for homogeneity and normality. Subsequently, descriptive statistics were applied using the T test to evaluate significant differences between the results, ensuring its validity.
Additionally, analysis of covariance was performed to determine the numerical interdependence between the analyzed variables. Multivariate Principal Component Analysis (PCA) was also conducted to analyze the interrelationships between the variables and their inherent components. PCA is used to reduce and transform data, extracting information from a dataset and representing it with a new set of orthogonal variables. This process allows the visualization of patterns of similarity among observations and variables as points in a graph (Anderson, 1972; Morrison, 1976).
RESULTS AND DISCUSSION
Table 1 demonstrates standard deviations with low values indicating that the values are around the average for unit 1. The standard deviations are low, indicating that the values are closely distributed around the average for unit 1. Only minimal differences were observed between the maximum, minimum, and average defect values analyzed by the classifiers and those analyzed by the equipment, regardless of the defect type. To ensure safety in use, the certified classifier, as outlined in the Brazilian legislation Decree No. 6,268 of November 22, 2007 (Brasil, 2007), and its Normative Instruction No. 46 of October 29, 2009 (Brasil, 2009), is responsible for classification. However, this ruling does not preclude the use of the laboratory procedures to support its implementation.
Descriptive statistics of processed rice defects analyzed by classifiers and computer vision equipment in industrial unit 1. *** SD: standard deviation; Mach Chop + Stain: “chopped + stained” defect detected by machine; Man Chop + Stain: manually detected “chopped + stained” defect; Mach Yellow: “yellow” defect detected by machine; Man Yellow: manually detected “yellow” defect; Mach Chalky: “chalky” defect detected by machine; Man Chalky: manually detected “chalky” defect; Mach Moldy + Burnt: “moldy + burnt” defect detected by machine; Man Moldy + Burnt: manually detected “moldy + burnt” defect; Mach White Belly: “white belly” defect detected by machine; Man White Belly: manually detected “white belly” defect. Source: Authors (2024).
The statistical calculations conducted for unit 1 were also performed for unit 2. Unit 2 exhibited higher values for the maximum, minimum, and average standard deviations than unit 1. These values were similar when comparing the visual classification method to the classification performed by the equipment (Table 2). Therefore, no significant differences were observed between the readings of the official classifier and those of the equipment.
Descriptive statistics of processed rice defects analyzed by classifiers and computer vision equipment in industrial unit 2. *** SD: standard deviation; Mach Chop + Stain: “chopped + stained” defect detected by machine; Man Chop + Stain: manually detected “chopped + stained” defect; Mach Yellow: “yellow” defect detected by machine; Man Yellow: manually detected “yellow” defect; Mach Chalky: “chalky” defect detected by machine; Man Chalky: manually detected “chalky” defect; Mach Moldy + Burnt: “moldy + burnt” defect detected by machine; Man Moldy + Burnt: manually detected “moldy + burnt” defect; Mach White Belly: “white belly” defect detected by machine; Man White Belly: manually detected “white belly” defect. Source: Authors (2024).
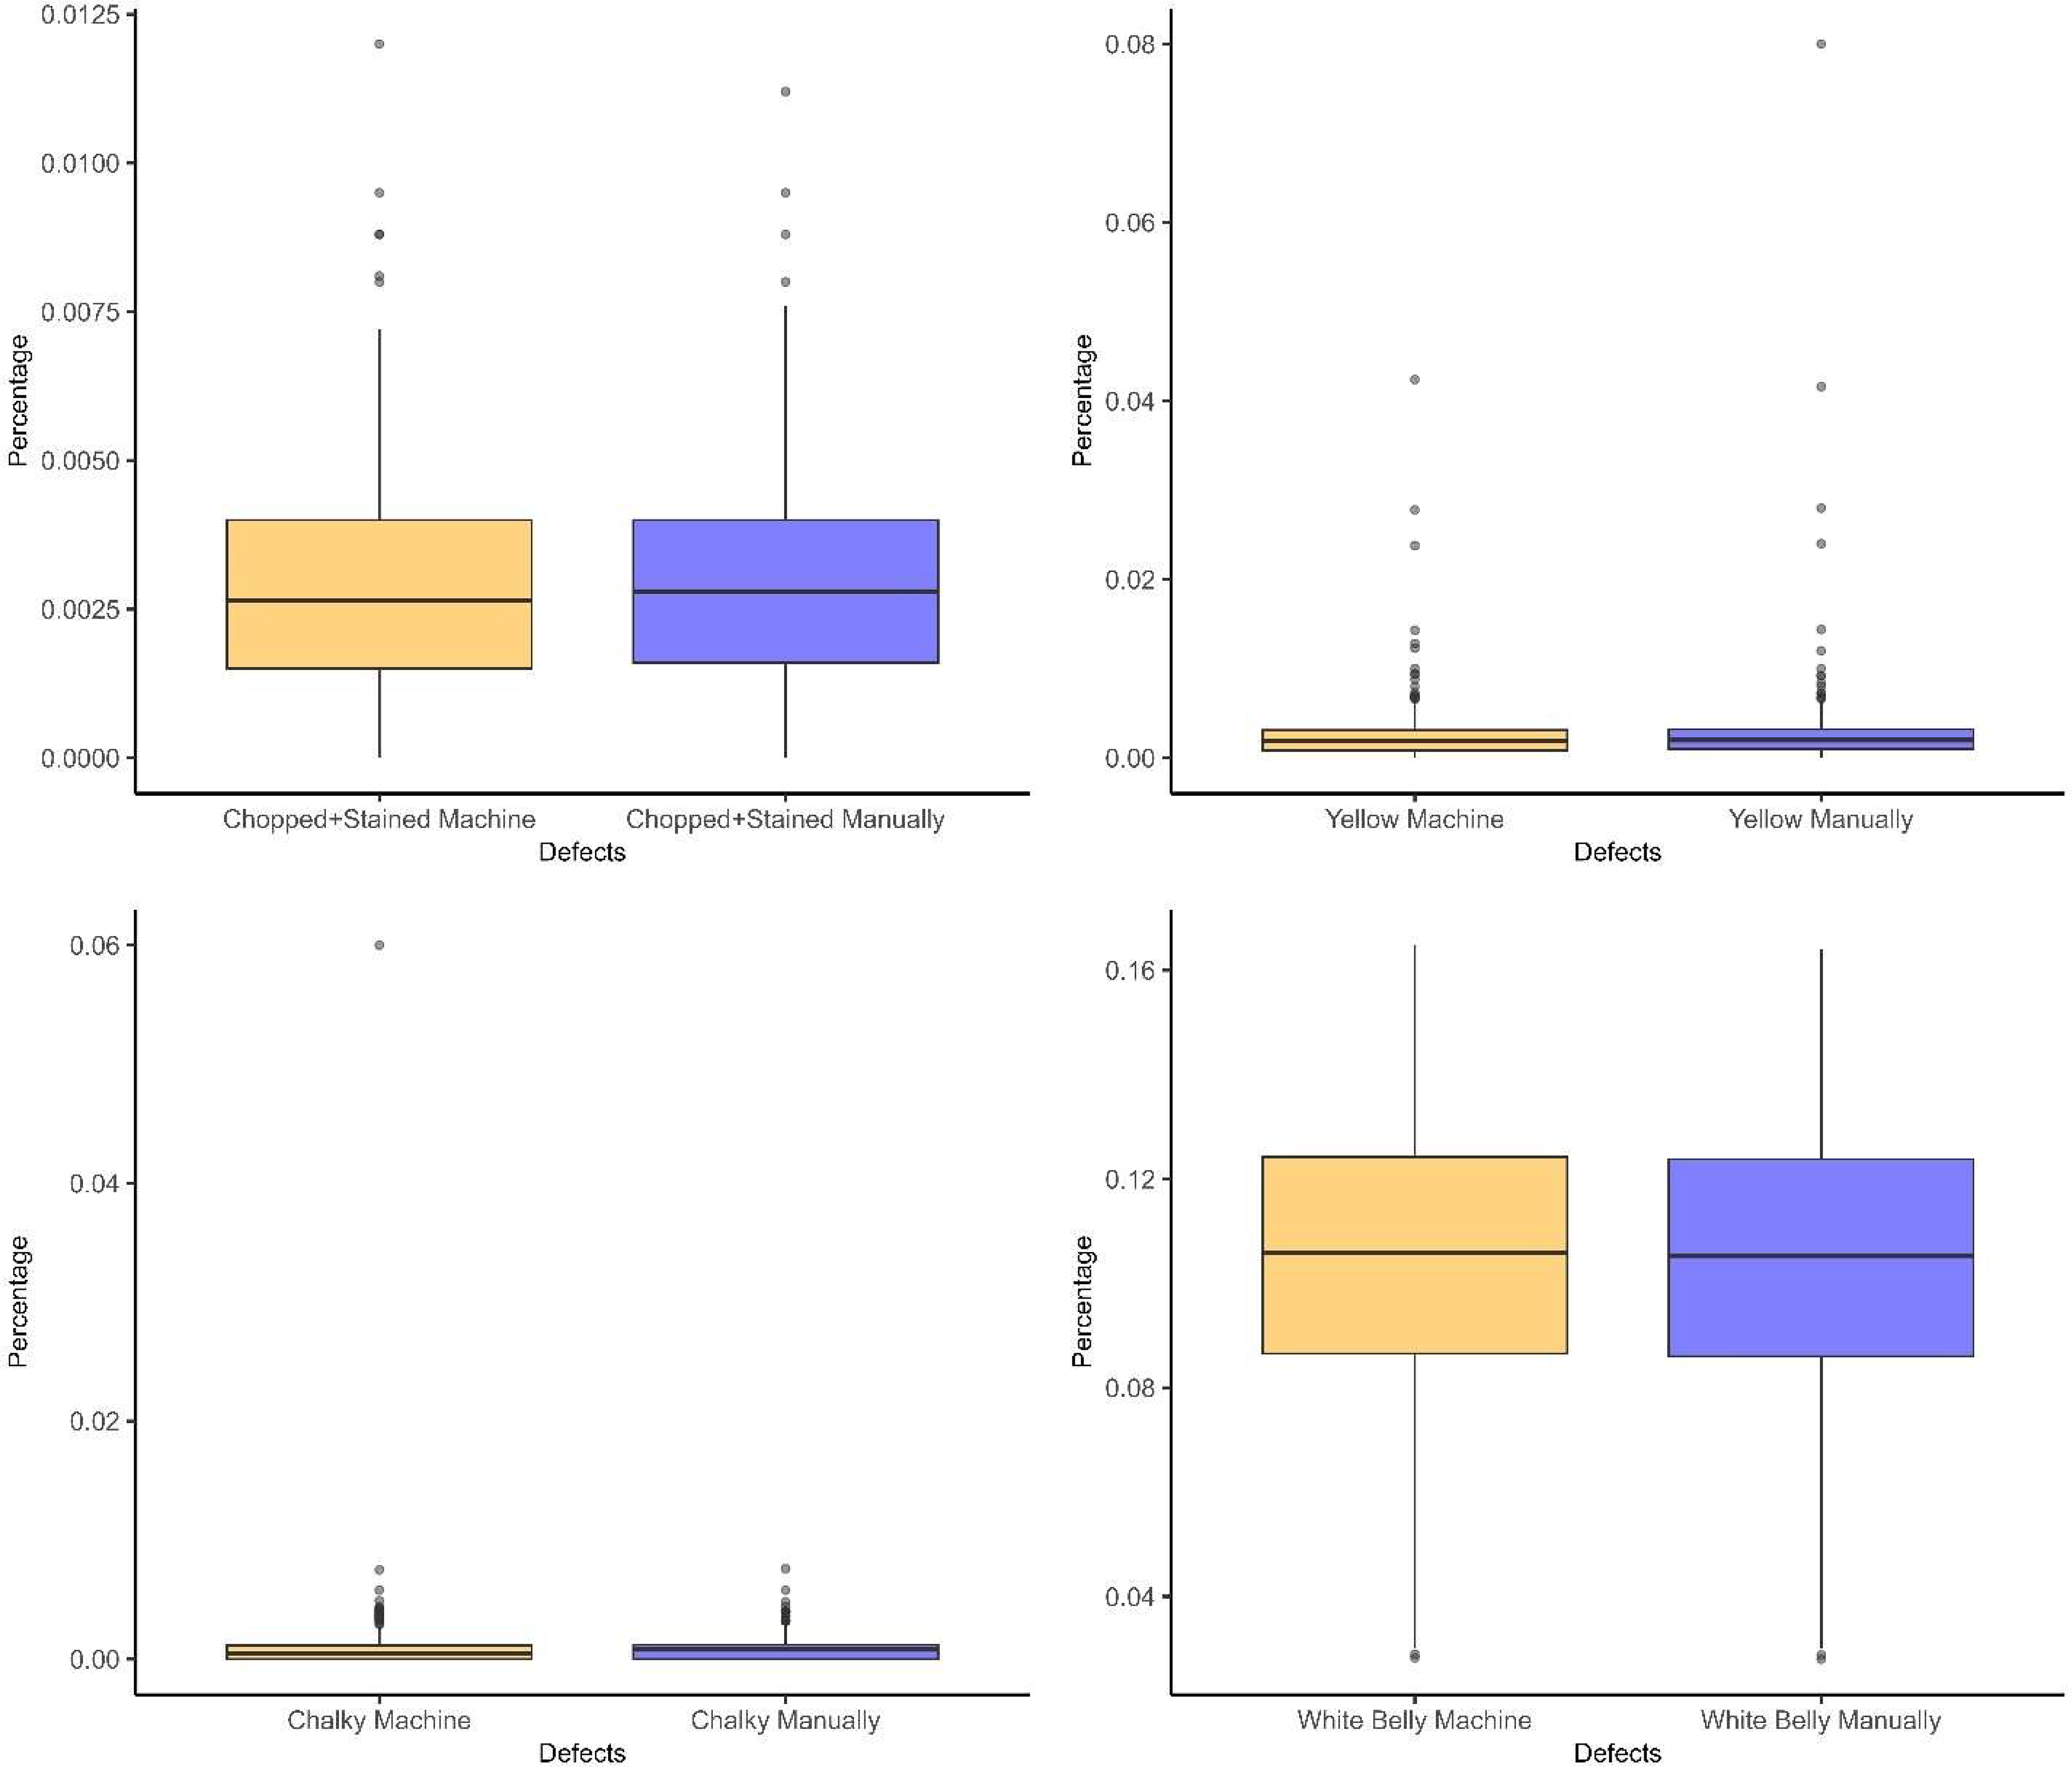
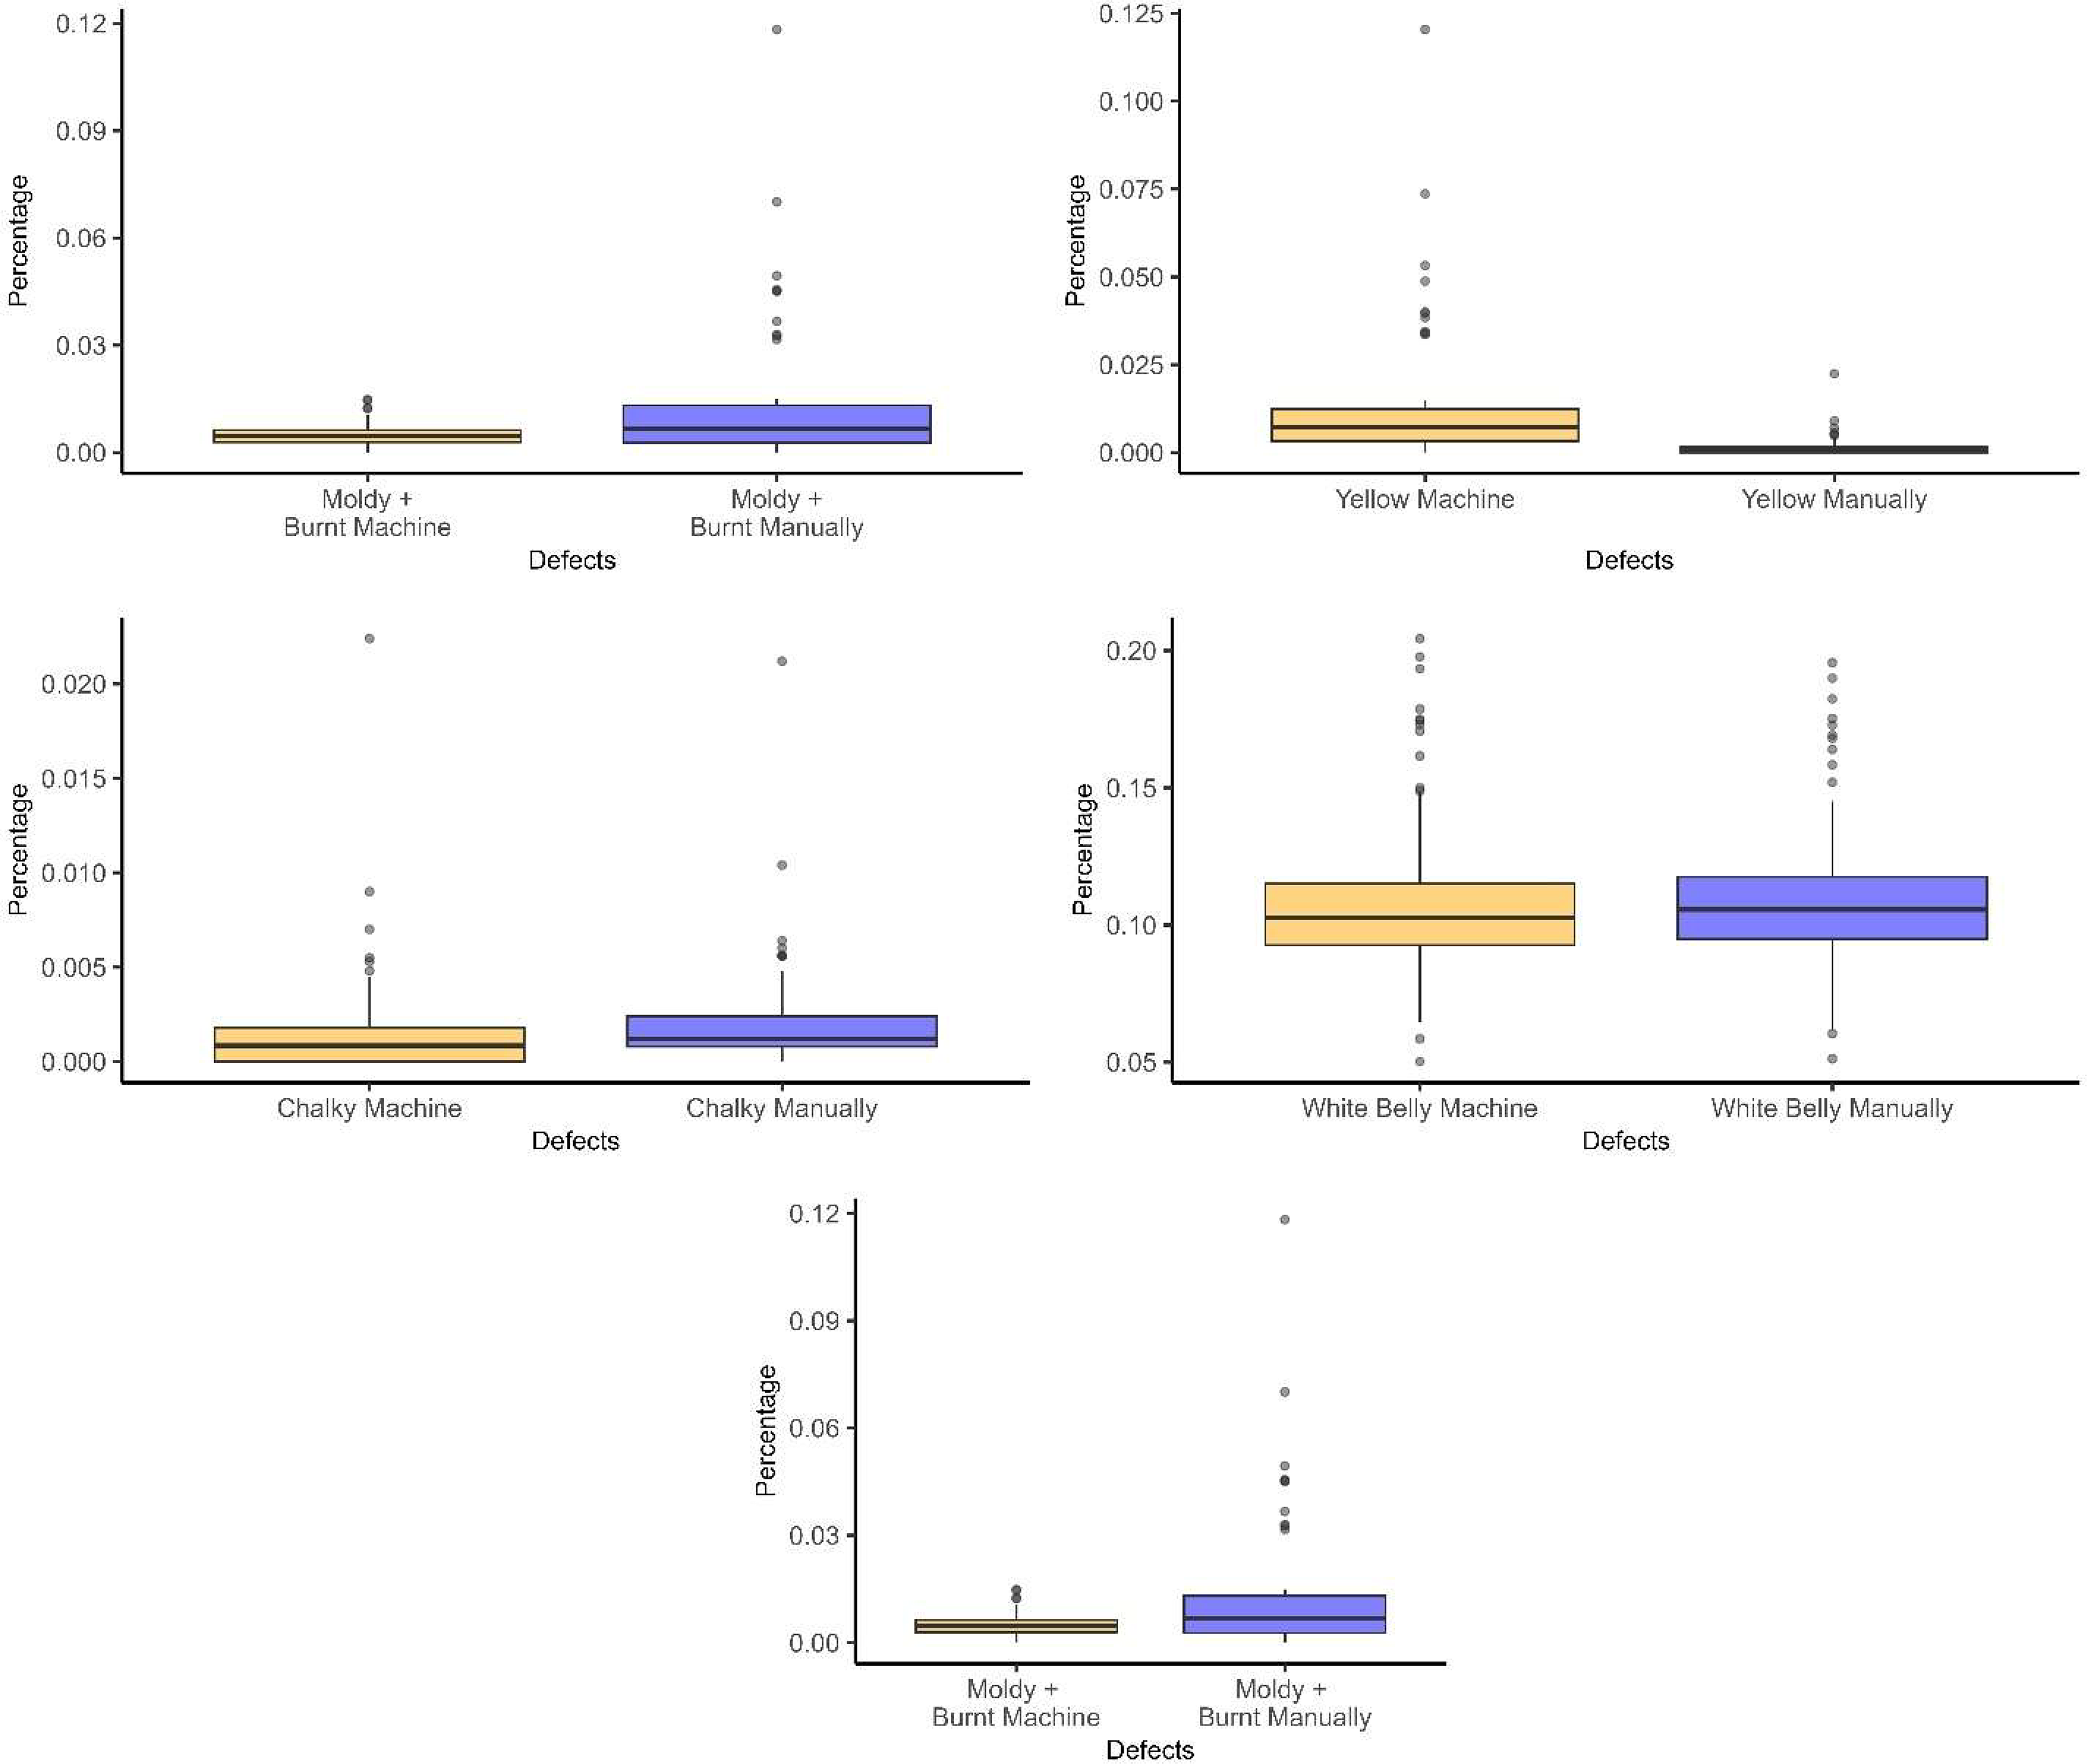
The descriptive statistical data corroborated the t-test results, which indicated a 95% probability that the data were similar across all variables. Figures 4 and 5 illustrate that no significant differences were observed between the readings from the classifiers and the computer vision equipment.
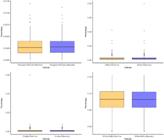
Boxplot of rice defects analyzed in the first industrial unit by classifiers and computer vision equipment. a) Mach Chop + Stain: “chopped + stained” defect detected by machine; Man Chop + Stain: manually detected “chopped + stained” defect b) Mach Yellow: “yellow” defect detected by machine; Man Yellow: manually detected “yellow” defect. c) Mach Chalky: “chalky” defect detected by machine; Man Chalky: manually detected “chalky” defect. d) Mach White Belly: “white belly” defect detected by machine; Man White Belly: manually detected “white belly” defect. Source: Authors.
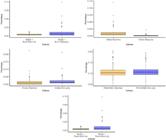
Boxplot of rice defects analyzed in the second industrial unit by classifiers and computer vision equipment. a) Mach Chop + Stain: “chopped + stained” defect detected by machine; Man Chop + Stain: manually detected “chopped + stained” defect b) Mach Yellow: “yellow” defect detected by machine; Man Yellow: manually detected “yellow” defect. c) Mach Chalky: “chalky” defect detected by machine; Man Chalky: manually detected “chalky” defect. d) Mach Moldy + Burnt: “moldy + burnt” defect detected by machine; Man Moldy + Burnt: manually detected “moldy + burnt” defect. e) White Belly Mach: “white belly” defect detected by machine; White Belly Man: manually detected “white belly” defect. Source: Authors.
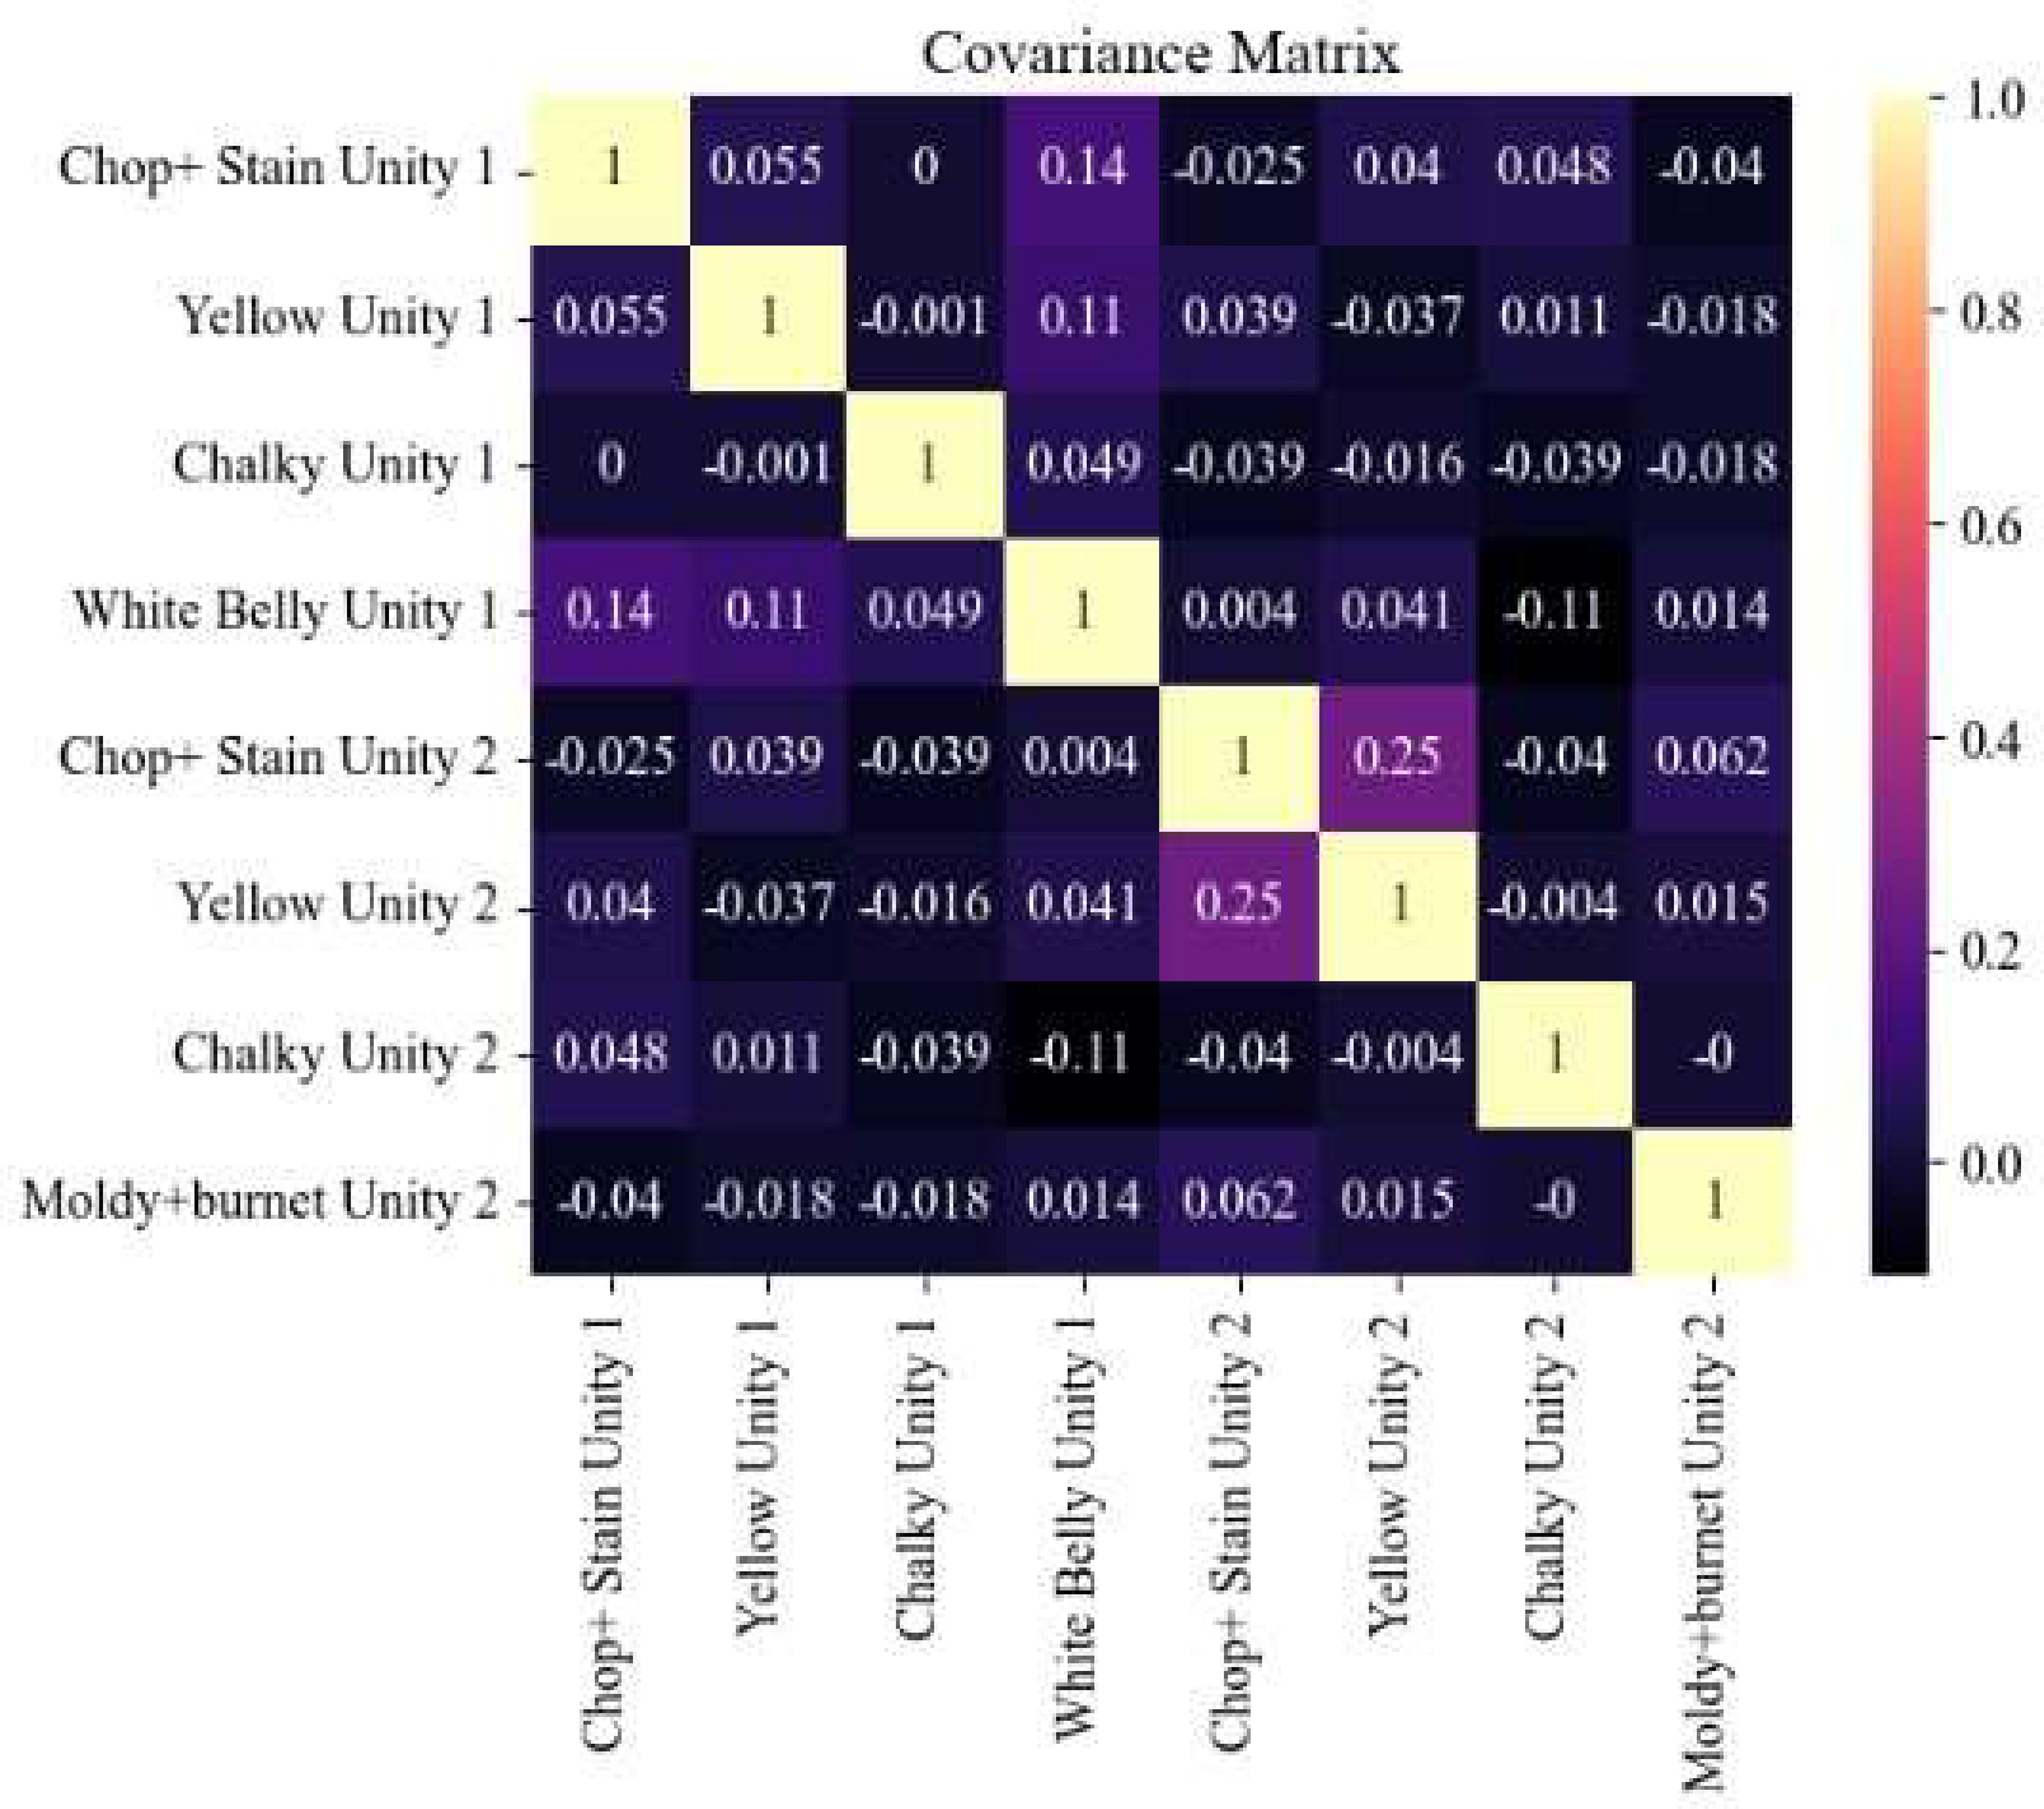
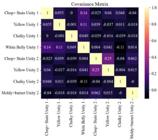
Figure 6 displays the covariance matrix, revealing minimal interdependence, with the highest value of 0.25 observed between the “most yellow” and “chopped + stained” defects from the same unit, suggesting interdependence. The “chopped + stained” defect originates in the field; Elias (2007) classified rice defects as metabolic when they developed during storage, with both “yellow” and “chopped + stained” defects exhibiting this characteristic.
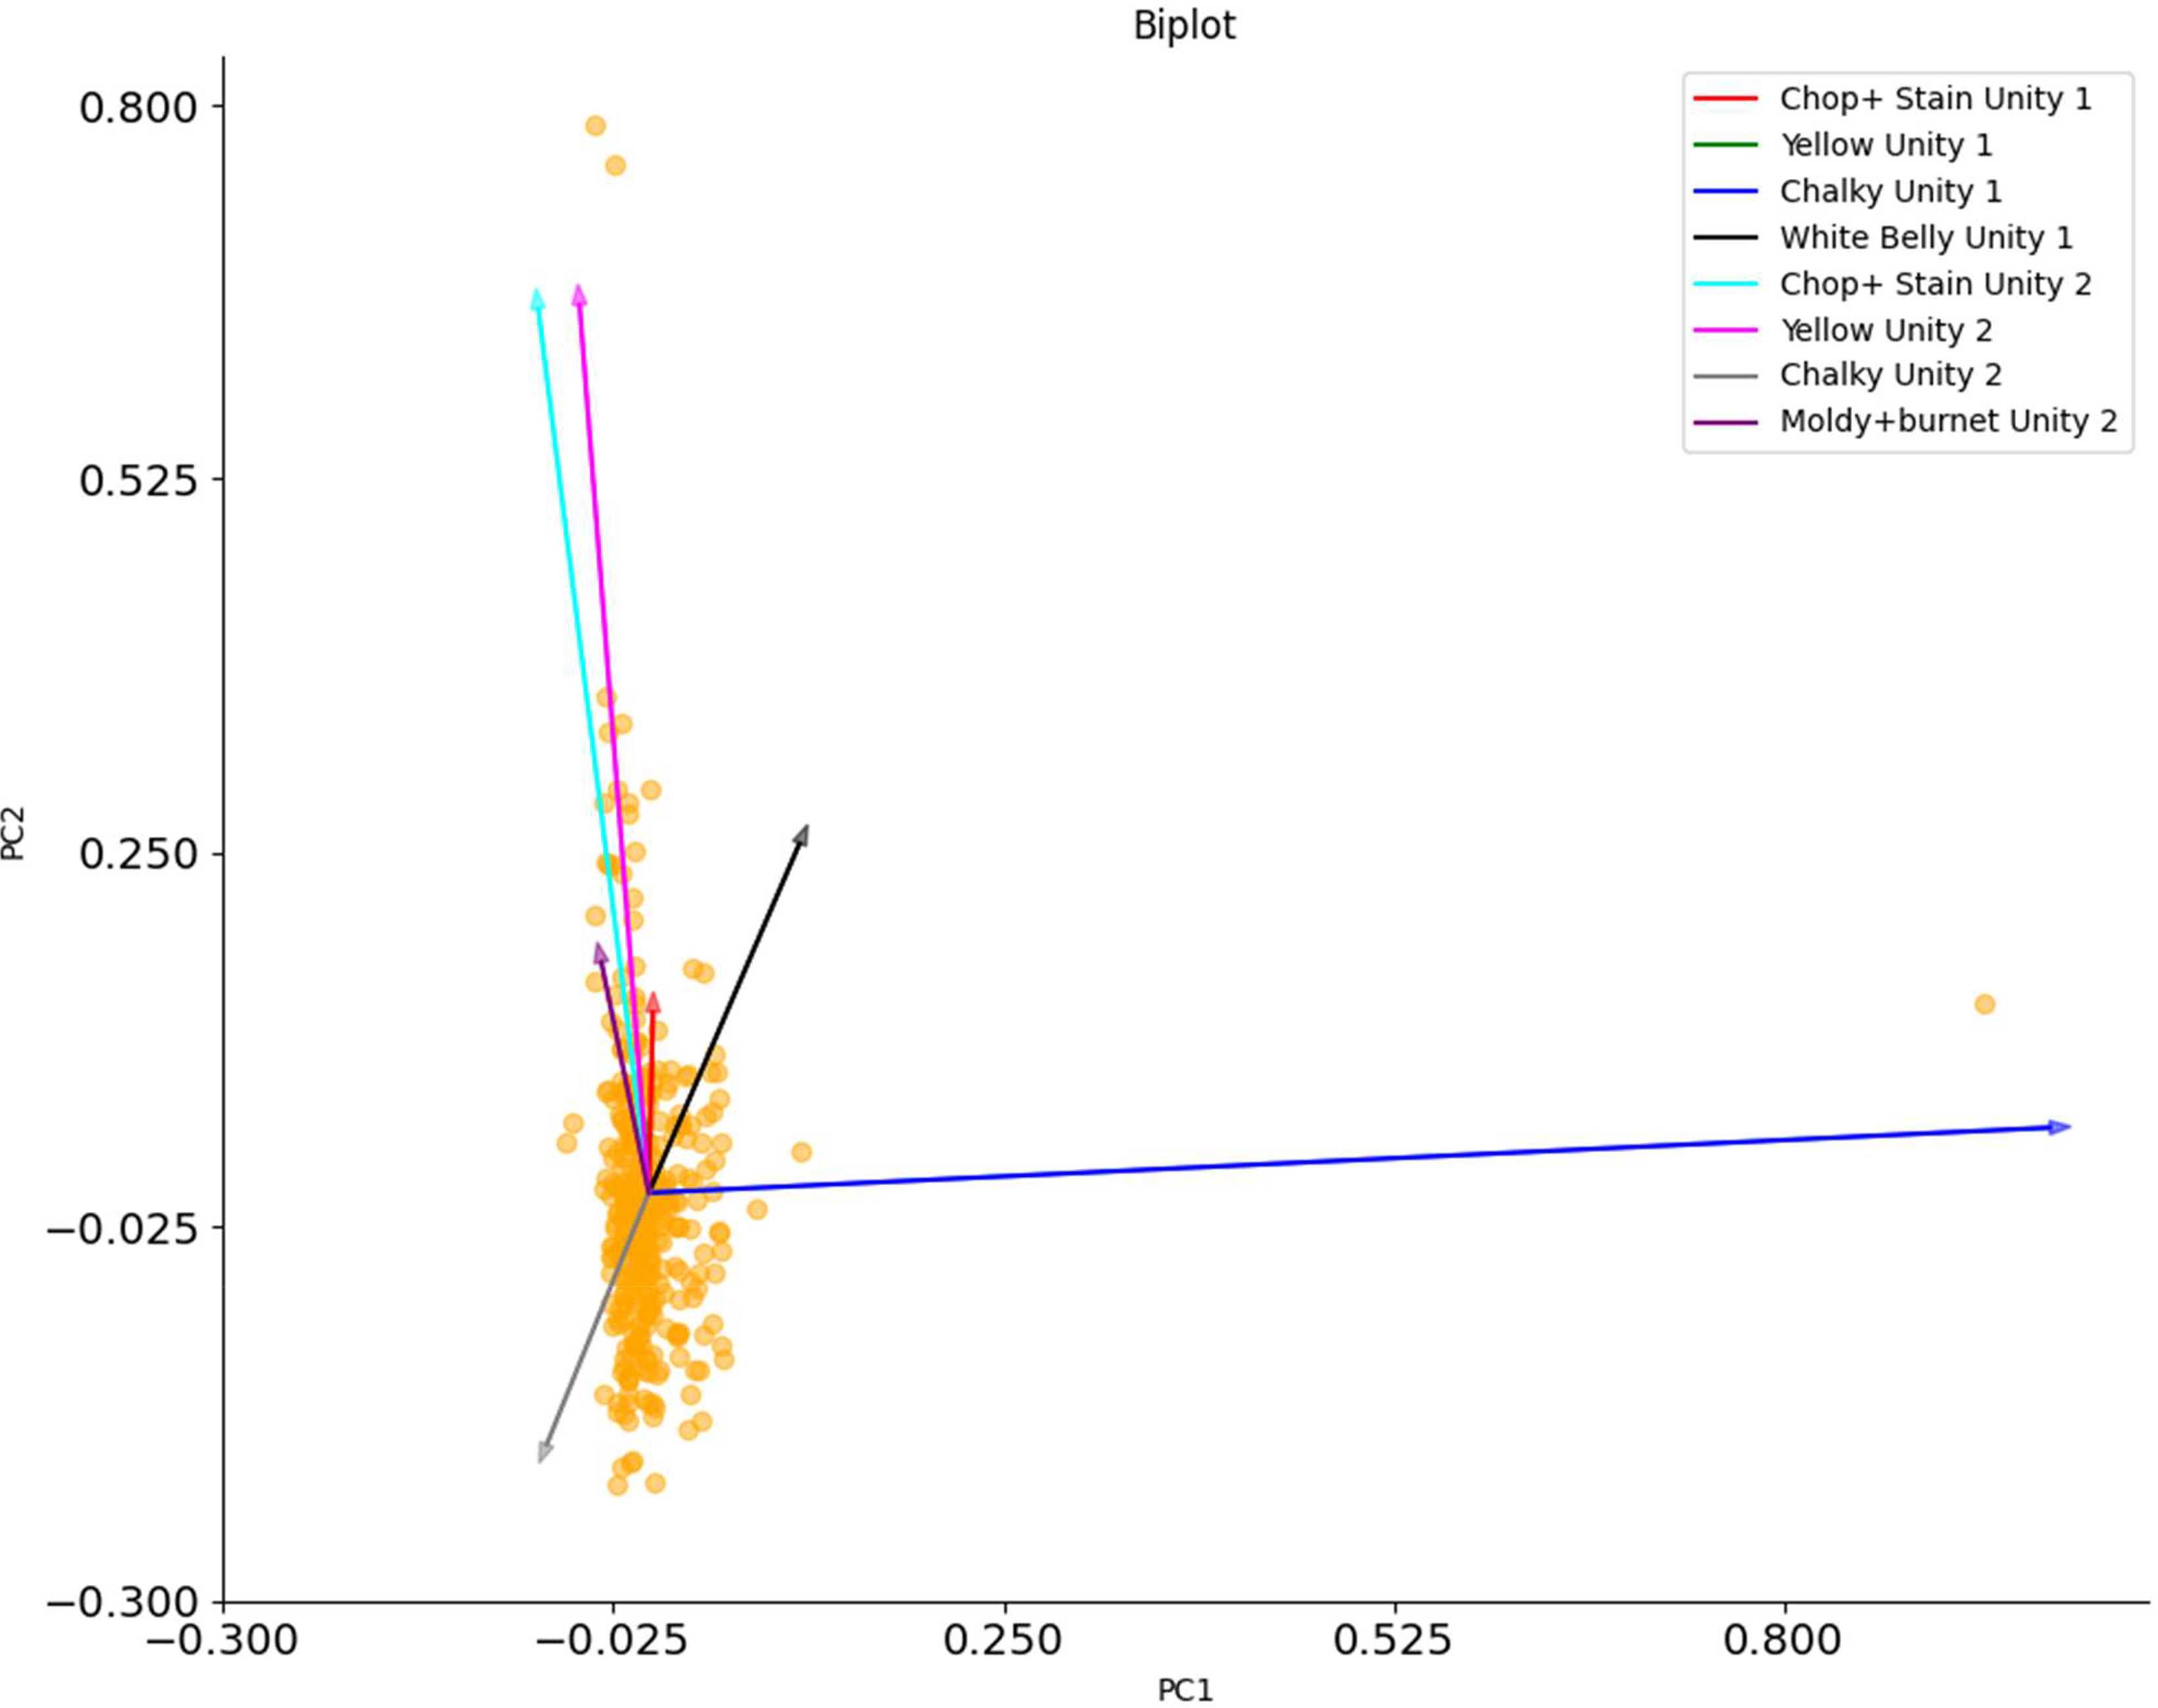
PCA revealed that the primary components were “chalky,” “white belly,” “chopped + stained,” and “yellow” (Figure 7), suggesting that these defects are aligned in the same direction, where the abundance of data rapidly increases. Additionally, the length of the arrows in the PCA plot indicates the rate of change in the abundance of each defect. The longest vectors correspond to “chopped + stained,” “yellow,” and “chalky,” implying that these defects exhibit the most significant rate of change and contribute the most to observed variance.
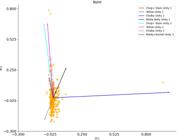
Principal component analysis of rice defects analyzed in both industrial units. Source: Authors.
The pattern presented in the PCA plot (Figure 7) demonstrates that the “chopped” and “stained” defects share a similar pattern, indicating that these defects are linked and occur with a higher incidence depending on the unit. The “white belly” defect in one unit and the “chalky” defect in the other unit display distinct components, suggesting that these defects are influenced by factors such as the origin of the rice, the production fields, or potential genetic differences.
Both “chalky” and “chopped and stained” defects originate in the field. According to Luz et al. (2023), chopped grains are caused by sucking insects and stained by fungi, typically occurring when the grain is in a milky or pasty state. Even after parboiling, chopped grains may become stained as the color intensifies due to the opening caused by the insect's “bite”. Therefore, treating these defects as inherent by the data mining process of the computer vision equipment is justified.
The efficiency of the computer vision equipment compared with that of the classifiers in this industrial unit, is presented in Table 3. The equipment, when evaluated alongside trained classifiers, showed reduced efficiency in detecting the “chalky” defect. This decrease in performance could be attributed to the broader range of data, the presence of numerous null data points, and the computational complexity of real-time analysis.
The efficiency of computer vision equipment compared to that of official classifiers in detecting processed rice defects. Chopped + stained: “chopped + stained” defect; Yellow: “yellow” defect; Chalky: “chalky” defect; White Belly: “white belly” defect. Source: Authors.
Usage of the computer vision equipment ensured consistency in data, eliminating the fluctuations previously observed in classifier results, such as variations in detecting “chalky” (75%) and “white belly” (50–75% or even 50–99%) defects, which often caused divergences between classifiers and required continuous retraining.
Thus, computer vision provides a significant advantage in classification, particularly during the harvest, when temporary or new collaborators may cause delays in aligning results and in classifying rice within standard categories. Additionally, variations in the performance of the same classifier throughout the day can lead to inconsistencies due to repetitive work.
Sun et al. (2014) developed a method using computer vision equipment to identify “chalky” rice based on its location within the grain. The authors reported that the distances between the rice’s centroid and the top of the embryo were the longest. When a suspicious “chalky” area was detected, it was classified based on these defined distances. If the distances were similar, and the distances to the two short sides were also comparable, the area was classified as “chalky.” Conversely, if the distance to the upper left short side was considerably larger than that to the lower left short side, the area was classified as an embryo. Areas near the long side of the seed, with nearly identical distances from the upper left and lower left short sides, were identified as “white belly”.
The computer vision equipment captures the image in RGB and multispectral formats, then converts them to HSV, revealing the parameterization for each defect. Monteiro et al. (2022) used RX and RGB and found that RGB is also an alternative. Monteiro et al. (2019) discussed color scales to separate chalky rice from white rice, with blue being the most suitable scale. However, they noted that no single scale was efficient in distinguishing chalky rice from other defects. To address this issue, the equipment must be specifically calibrated for this defect, as each defect requires its own parameterization.
A comparison of the efficiency data presented in Table 3, the PCA plot (Figure 7), and covariance analysis data (Figure 6) shows that the observed differences in results arise not from the equipment reading, but from the differences in intrinsic characteristics between each analyzed batch.
CONCLUSIONS
It was concluded that the adoption of computer vision offers a significant advantage, providing more stable results and contributing to the standardization and efficiency of the grain classification process.
REFERENCES
- Anderson, T. W. (1972). An Introduction to Multivariate Analysis. Wiley Eastern Pvt. Ltd. New Delhi.
-
Brasil. (2007, 22 de novembro). Decreto nº 6.268, de 22 de novembro de 2007. Diário das Leis. https://www.diariodasleis.com.br/legislacao/federal/6694-regulamenta-a-lei-9-972-de-25-de-maio-de-2000-que-institui-a-classificauuo-de-produtos-vegetais-seus-subprodutos-e-residuos-de-valor-economico-e-da-outras-providencias.html
» https://www.diariodasleis.com.br/legislacao/federal/6694-regulamenta-a-lei-9-972-de-25-de-maio-de-2000-que-institui-a-classificauuo-de-produtos-vegetais-seus-subprodutos-e-residuos-de-valor-economico-e-da-outras-providencias.html - Brasil. (2009, 30 de setembro). Instrução Normativa nº 46, de 29 de setembro de 2009. Diário Oficial da União, Seção 1, p. 10.
- Brasil. (2009). Instrução Normativa Nº 6, de 2009. Diário Oficial da União, Seção 1, p. 3.
-
Chen S., Xiong J., Guo W., Bu R., Zheng Z., Chen Y., Yang Z., Lin R. (2019) Colored rice quality inspection system using machine vision. Journal Of Cereal Science 88, 87 - 95. https://doi.org/10.1016/j.jcs.2019.05.010
» https://doi.org/10.1016/j.jcs.2019.05.010 - Elias, M. C. (2007). Pós-colheita de arroz: Secagem, armazenamento e qualidade. Editora Universitária UFPEL.
- Luz, M. L. G. S., Luz, C. A. S., Araujo, A. S (2023). Processamento de Arroz Branco e Parboilizado. Pelotas: Blücher.
- Monteiro, R. C. M., Gadotti, G. I., & Araújo, A. S. (2019). Processamento de imagens para identificação de defeitos no arroz. In A. Zuffo (Org.), A produção do conhecimento nas ciências agrárias e ambientais (pp. 298-306). Atena.
-
Monteiro, R. de C. M., Gadotti, G. I., Villela, F. A., Cardoso, J. T. C., Oliveira, M. de. (2022). Fissure Identification Methods in Rice Seeds After Artificial Drying. Engenharia Agrícola, 42, e20210148. https://doi.org/10.1590/1809-4430-Eng.Agric.v42nepe20210148/2022
» https://doi.org/10.1590/1809-4430-Eng.Agric.v42nepe20210148/2022 - Morrison, D.E. (1976) Multivariate Statistical Methods. 2. ed. New York: McGraw-Hill.
- Patrício, D. I. (2018). SeedFlow: Sistema de visão computacional para classificação de grãos de aveia (Dissertação de mestrado, Universidade de Passo Fundo).
-
Sun, C., Liu, T., Ji, C., Jiang, M., Tian, T., Guo, D., Wang, L., Chen, Y., & Liang, X. (2014). Evaluation and analysis the chalkiness of connected rice kernels based on image processing technology and support vector machine. Journal of Cereal Science, 60, 426-432. https://doi.org/10.1016/j.jcs.2014.04.009
» https://doi.org/10.1016/j.jcs.2014.04.009 -
Sural, S., Gang, Q., & Pramanik, S. (2002). Segmentation and histogram generation using the HSV color space for image retrieval. In Proceedings. International Conference on Image Processing (pp. 589-592). https://doi.org/10.1109/ICIP.2002.1040019
» https://doi.org/10.1109/ICIP.2002.1040019 - Trisnawan, A., Hariyanto, W. (2019). Klasifikasi Beras Menggunakan Metode K-Means Clustering Berbasis Pengolahan Citra Digital. Jurnal Terapan Sains & Teknologi (Rainstek), 1(1), 16-24.
Edited by
-
Area Editor:
Welington Gonzaga do Vale