
 {censobr}: Easy Access to Brazilian Population Census Data
Abstract
This paper introduces {censobr}, an R package that provides an efficient method for accessing and analyzing Brazilian census data. The package enables in-disk data manipulation, allowing users to handle larger-than-memory datasets seamlessly with familiar {dplyr} syntax. The package integrates with {geobr}, enriching census data with geographic identifiers for easy spatial analysis. It offers a range of functions to download microdata and aggregated data for all of the Brazilian census editions since 1960. It also provides access to essential documentation such as variable dictionaries and interview manuals. Through this approach, {censobr} enhances accessibility to detailed demographic and socioeconomic information, including both individual-level microdata and census tract-level aggregates. Additionally, the package’s handling of complex survey designs and support for spatial data visualization facilitates in-depth analysis of the Brazilian population’s sociodemographic characteristics and living conditions over several decades. Practical examples included in the paper demonstrate its applications in areas such as demographic analysis and household-level research. {censobr} represents a significant advancement in making Brazilian census data accessible and efficient for academic and policy-related research. Future updates will expand its functionality and data coverage, contributing further to the package’s ease of use and analytical capabilities.
Keywords:
Brazilian Demographic Census; R package; censobr; microdata; census tracts
Resumo
Este artigo apresenta o {censobr}, um pacote para R que fornece métodos eficientes para acessar e analisar dados censitários brasileiros. Ele permite a manipulação de dados diretamente em disco, possibilitando que os usuários trabalhem facilmente com bases maiores do que a memória RAM disponível, utilizando a sintaxe familiar do {dplyr}. O {censobr} integra-se ao pacote {geobr}, enriquecendo os dados censitários com identificadores geográficos que facilitam análises espaciais. Ele disponibiliza diversas funções para baixar microdados e dados agregados referentes a todas as edições do censo brasileiro desde 1960, além de fornecer acesso à documentação essencial, como dicionários de variáveis e manuais de entrevista. O {censobr} inclui tanto microdados da amostra quanto dos agregados por setores censitários. Exemplos práticos apresentados no artigo demonstram suas aplicações em áreas como análises demográficas e pesquisas domiciliares. O {censobr} representa um avanço significativo na disponibilização eficiente dos dados censitários brasileiros para pesquisa acadêmica e formulação de políticas públicas. Atualizações futuras ampliarão suas funcionalidades e a cobertura dos dados, contribuindo ainda mais para a facilidade de uso e capacidade analítica do pacote.
Palavras-chave:
censo demográfico brasileiro; pacote para R; censobr; microdados; setores censitários
Résumé
Cet article présente le {censobr}, un paquet pour R qui fournit des méthodes efficaces pour accéder aux et analyser les données censitaires brésiliennes. Il permet la manipulation de données directement sur disque, offrant aux utilisateurs la possibilité de travailler facilement avec des bases plus volumineuses que la mémoire RAM disponible, tout en utilisant la syntaxe familière de {dplyr}. Le {censobr} s’intègre au paquet {geobr}, enrichissant les données censitaires avec des identifiants géographiques qui facilitent les analyses spatiales. Il propose diverses fonctions pour télécharger des microdonnées et des données agrégées couvrant toutes les éditions du recensement brésilien depuis 1960, en plus de fournir un accès à la documentation essentielle, comme les dictionnaires de variables et les manuels d’entretien. Le paquet inclut à la fois des microdonnées issues de l’échantillon et des agrégats par secteurs de recensement. Les exemples pratiques présentés dans l’article démontrent ses applications dans des domaines tels que l’analyse démographique et les enquêtes auprès des ménages. Le {censobr} représente une avancée significative dans la mise à disposition efficace des données censitaires brésiliennes pour la recherche académique et l’élaboration de politiques publiques. Les mises à jour futures élargiront ses fonctionnalités et sa couverture de données, contribuant encore davantage à la facilité d’utilisation et aux capacités analytiques du paquet.
Mots-clés:
recensement démographique brésilien; paquet pour R; {censobr}; microdonnées; secteurs de recensement
Resumen
Este artículo presenta el {censobr}, un paquete para R que proporciona métodos eficientes para acceder y analizar datos censales brasileños. Permite la manipulación de datos directamente en disco, lo que posibilita a los usuarios trabajar fácilmente con bases de datos mayores que la memoria RAM disponible, utilizando la sintaxis familiar de {dplyr}. El {censobr} se integra con el paquete {geobr}, enriqueciendo los datos censales con identificadores geográficos que facilitan los análisis espaciales. Ofrece diversas funciones para descargar microdatos y datos agregados referentes a todas las ediciones del censo brasileño desde 1960, además de proporcionar acceso a documentación esencial, como diccionarios de variables y manuales de entrevista. El {censobr} incluye tanto microdatos de muestra como datos agregados por sectores censales. Los ejemplos prácticos presentados en el artículo demuestran sus aplicaciones en áreas como análisis demográficos e investigaciones domiciliarias. El {censobr} representa un avance significativo en la disponibilidad eficiente de los datos censales brasileños para la investigación académica y la formulación de políticas públicas. Las futuras actualizaciones ampliarán sus funcionalidades y la cobertura de los datos, contribuyendo aún más a la facilidad de uso y capacidad analítica del paquete.
Palabras clave:
censo demográfico brasileño; paquete para R; censobr; microdatos; sectores censales
Introduction
Population census data is one of the most important sources of information on the characteristics and living conditions of populations. In Brazil, the population census conducted by the Brazilian Institute of Geography and Statistics (IBGE) is an essential resource for scientific research and serves as a cornerstone for informing government policies and planning. However, the raw data format of Brazilian census data released to the public and the large size of these datasets often pose substantial challenges for researchers, particularly those working with limited computing resources.
To address these issues, we developed {censobr}, an R package designed to facilitate the efficient access and manipulation of Brazilian census data and documentation, covering all census editions since 1960. Because the {censobr} package builds on the Apache Arrow platform and preprocessed files saved in .parquet format, it enables users to manage larger-than-memory datasets using a columnar memory format that optimizes data access and processing. Arrow seamlessly integrates with {dplyr} syntax, allowing users to interact with in-disk datasets using familiar R commands, thus streamlining the analytical workflow without the need for extensive new learning. {censobr} also integrates with {geobr} (Pereira et al., 2019), an R package to download official geospatial data in Brazil, using matching geographic identifiers that facilitate the merging of census data with spatial geometries for visualization and analysis. Our goal is to make census data more accessible while maintaining the flexibility and power of the R programming language.
This research note introduces the {censobr} package, outlines its core functionalities, and provides illustrative examples demonstrating its applications in social science research. The development of {censobr} is documented on GitHub at https://github.com/ipeaGIT/censobr. The code used to write/replicate this paper can be found at https://github.com/ipeaGIT/censobr_paper_2025.
Compared to other computational packages to read and analyze Brazilian census data, such as IPUMS (Ruggles et al., 2024) and Base dos Dados (Dahis et al., 2022), the {censobr} package provides a simple and user-friendly syntax to access the complete records of all datasets and documentation for several years since 1960 and allows for easy integration with spatial data. Some packages have the same purpose of reading census data from other countries. This is the case for packages such as {Tidycensus} for the United States (Walker & Herman, 2025), and {cancensus} for Canada (von Bergmann et al., 2021). These packages, however, are designed to access census data provided directly by official agencies through APIs. In contexts where data is not made available via official APIs from the data-producing agencies and where datasets are very large, as is the case in Brazil, the architecture used in organizing the {censobr} package can serve as a promising framework for handling census and as well as other large datasets in different countries.
An Overview of Brazilian Censuses
The first census of Brazil was conducted in 1872, during Brazil’s imperial period, while modern censuses began in 1940 under the coordination of the Brazilian Institute of Geography and Statistics (IBGE, 1990). Given the country’s size in terms of both population and territory, the Brazilian population census represents one of the most extensive population data collection efforts worldwide.
Since 1960, each Brazilian census has been divided into two main components: the universe survey and the sample survey (similar to what was commonly done in the United States and the United Kingdom, and is still in use in Canada). The universal survey is administered to all households and collects essential demographic and housing information through a short questionnaire containing between 9 and 30 questions, depending on the census edition. In contrast, the sample survey targets a representative subset of the population and uses a longer questionnaire that includes all questions from the universe components as well as dozens of more detailed questions on topics such as migration, religion, education, fertility, income, and employment. The sample size was 25% in the 1960, 1970, and 1980 censuses, and it was reduced to 10% from 1991 onwards (IBGE, 2013).
Brazilian population census data is published in two main formats: aggregated data at the census tract level, and microdata at the person or household level. The data from the universe survey (short questionnaire) is only available in aggregated form, providing summary statistics (counts, proportions, and means) computed at the census tract level. For example, this dataset can be used for spatial analysis to examine spatial patterns, disparities, and trends of various population characteristics (e.g., Brueckner, Mation, Nadalin, 2019; Goto, Suarez, Ye, 2022). Census tracts are the smallest geographic unit in the Brazilian censuses. They are contiguous areas typically containing approximately 200 households, designed to facilitate efficient enumeration and data collection. Over time, the number of census tracts has expanded in response to population growth and changes in settlement patterns, with approximately 216,000 census tracts in 2000, 314,000 in 2010, and 452,000 in 2022. These tracts form the fundamental spatial units for census data collection, reflecting the evolution of Brazilian urban and rural landscapes.
Meanwhile, the microdata from the sample survey (long questionnaire) consists of a dataset in which each row represents an instance of data collection. In IBGE surveys and censuses, “persons” and “households” are typically the units of analysis of microdata. “Persons” refer to individual members of the population, and their data typically includes personal characteristics such as age, gender, and education. “Households” represent residential units, which consist of one or more persons living together, sharing living expenses, and typically occupying a single housing unit. Household-level microdata includes variables related to housing conditions, access to services (such as water and sanitation), and household composition (such as the number of residents and their relationships). Because the sample survey is more sparse geographically, it does not allow for fine-grained spatial analyses. The smallest geographic units available in the microdata are weighting areas (áreas de ponderação), which are groups of contiguous census tracts ensuring statistical representativeness. For the 2010 Census, IBGE established that a weighting area should have at least 400 occupied households in the sample. In less densely populated regions, these areas cover a large territorial extension.
In summary, there is a trade-off of spatial granularity and richness of information between the universe and the sample survey components of the Brazilian census. While aggregated data at the census tract level allows for fine-grained spatial data, it covers relatively few variables. By contrast, the microdata from the sample survey covers many more variables that allow for detailed individual- and household-level analysis, but at a coarser geographical level.
Figure 1 below illustrates the hierarchical spatial organization of Brazilian Census data, ranging from municipality-level aggregation to census tract and weighting area levels. Census tracts, the smallest geographic unit, guide data collection operations and offer a high-resolution snapshot of local characteristics. In contrast, weighting areas combine contiguous census tracts to ensure statistical representativeness while allowing for more detailed analyses of microdata variables.

Installation and Core Functions
{censobr} is available on CRAN, and the stable version can be installed like any other R package using the install.packages() function:

Users interested in accessing the latest features can install the development version directly from GitHub using:

After installing {censobr}, load it into your R session with:

The package includes several core functions to download and read different types of census data, as indicated in Table 1.
These functions allow users to specify the year and type of data they want to access and whether the function should return the data in a format compatible with Arrow or a regular data.frame (see next section). The first time the user runs a function, {censobr} will download the data file in. parquet format and store it locally. This way, the data only needs to be downloaded once (more information on section “managing {censobr} files cached locally”.
All datasets available through {censobr} are identical to data published by IBGE, the only difference being that the datasets in {censobr} are enriched with geography columns following the name standards of the {geobr} package to facilitate integration with spatial data. The only exception is the data from the 1960 census, which is the result of a careful data process to rebuild the original data, as detailed below. The datasets in {censobr} are also provided through online permanent links, with data stored in servers at the Institute for Applied Economic Research (Ipea) and on the public repository of the package on GitHub to guarantee perennial access to the data.
The 1960 Census
The 1960 Brazilian Census dataset presented in {censobr} builds upon previous work by one of the authors, which, until now, had not been publicly available. {censobr} thus marks the first time this dataset is accessible to the broader academic community, providing a unique and valuable resource for researchers studying Brazil’s demographic history. The microdata version we now make available represents a combination of two distinct datasets drawn from the 1960 population census.
The 1960 Census in Brazil marked a significant chapter in the nation’s demographic data collection history, characterized by both methodological complexity and subsequent challenges in data processing. Initially, IBGE conducted a comprehensive 25% sample survey alongside the universe census, but technical issues delayed its processing, and several states’ data remained incomplete and undigitized. The 25% sample currently available includes only 16 states of the country, excluding Maranhão, Piauí, Guanabara, Santa Catarina, Espírito Santo, and the Northern Region. It also contains data from a contested border region between Minas Gerais and Espírito Santo known as Serra dos Aimorés.
Amid the processing delay, in 1965, IBGE also created a probabilistic sub-sample representing approximately 1.27% of the population, covering all Brazilian states and the Federal District. This sub-sample was used to produce several official reports in the 1960s, and it remains an important source of data. Unlike the 25% sample, the 1.27% dataset is comprehensive in terms of geographic coverage, encompassing states not included in the 25% sample (which was never fully processed), albeit excluding rural areas of the state of Rondônia. We combined both the 25% and 1.27% samples to form a more complete dataset, approximating the original design intended for the 1960 Census. The merging process involved substantial pre-processing to address data inconsistencies, especially since portions of the original 1.27% sample were corrupted, leading to missing or inaccurate information. A detailed explanation of how this data was processed is available at https://github.com/antrologos/ConsistenciaCenso1960Br.
We developed a crosswalk to align municipality codes from the 1960 Census with municipality names, using auxiliary documents from IBGE’s online library, with extensive manual digitization required due to the low quality of the scanned documents. Using the municipality names, we matched the 1960 Census with the Brazilian Statistical Yearbook and imported detailed information on the population totals of rural and urban areas for all municipalities and states. This allowed us to construct a sample weight variable, enabling proper population estimates and correcting for unbalanced data. For the 25% sample observations, the weights expand to the municipal level, while for the 1.27% sample observations, the expansion occurs at the state level. Additionally, variables representing stratification and clustering were incorporated to approximate the original complex sample design and allow for more accurate statistical analyses. This feature enables the calculation of standard errors and confidence intervals that properly account for the combined sampling structure.
We believe the availability of these combined datasets of the 1960 Census in the {censobr} package offers a unique opportunity for researchers interested in studying Brazil’s demographic history during a period marked by rapid urbanization and socioeconomic transformation.
Census Documentation Available In {censobr}
In addition to functions for data reading, the {censobr} package also provides a set of functions for quick access to census documentation, including variable dictionaries, questionnaires, and interviewer’s manuals.
All documentation functions download the files in .html or .pdf format and open the document in the browser. Similar to the data reading functions of {censobr}, these documentation functions also save the files in a local cache the first time the function is run. Thus, when the user runs the function again, the package loads the local file almost instantly.
Data Dictionary
The data_dictionary() function loads the variable dictionary, pointing to the definition of each variable and the meaning of its categories for categorical variables. Currently, the function covers the sample microdata dictionaries for all Brazilian censuses since 1960. The function also includes the dictionaries for census tract-level aggregate data for the years 2000 and 2010.

Questionnaires
Understanding the structure and flow of a questionnaire is often crucial for effective data analysis. The questionnaire() function includes the questionnaires used in data collection for all Brazilian censuses since 1960. In addition to passing the year parameter, the user needs to indicate the type of questionnaire of interest, whether the short form for the universe survey (type = ‘short’) or the long form used in the sample survey (type = ‘long’).

Interviewer’s Manual
Finally, the interview_manual() function downloads and opens the “Interviewer’s Manual” in the browser, i.e., the instruction manual for IBGE enumerators on how to collect census data. Manuals for all censuses since 1960 are available.

Handling Larger-Than-Memory Data
In-disk analysis with {arrow}, SQL databases with {duckdb} and {dbplyr}
One of the most essential features of {censobr} is its capability to handle larger-than-memory datasets. The Brazilian census datasets are often too large to load directly into users’ RAM. To address this, {censobr} uses files saved in .parquet format and, by default, returns an “Arrow table” rather than a conventional data.frame. An Arrow table is an object that points to the dataset stored on disk, allowing for basic data manipulation without loading it into memory entirely.
Once the desired data is accessed through any read_* function, users can use common {dplyr} functions to select columns, filter cases, recode variables, or aggregate observations. Operations on Arrow tables are executed lazily; that is, they are only evaluated when explicitly requested, allowing researchers to delay heavy computations until they are necessary. After processing, smaller, more manageable datasets can be collected for further analysis.
To retrieve the results, users have two options:
-
collect(): Converts the results into a regular data.frame loaded on the RAM memory.
-
compute(): Materializes the results as a new Arrow table, keeping it in Arrow format.
In this quick example below, we read the data with all the 111,555 observations of deaths recorded in the 2010 census, but this data is not loaded to the RAM memory. Once we filter the data to keep only the deaths of men in the state of Rio de Janeiro (RJ), it is only after we perform the collect() that the result is loaded to memory as a data.frame with 3,947 observations.

Another approach allowed by {censobr} is using {duckdb}, a library that enables Arrow tables to be queried as if they were part of a database, allowing researchers to use SQL-like syntax for data operations. Users can register the Arrow table with {duckdb} and {DBI} to query the data:

Practical Examples
Here, we present a few use cases that illustrate the versatility of the package, supplemented by empirical examples and R code to demonstrate practical applications.
Population Data: Making Age Pyramids
One of the key applications of census data is to analyze demographic trends over time. In this example, we use the read_population() function to download data from 1970 and 2010, and to visualize how the population pyramids of Brazil have changed in the period.

Then, we recoded the raw data (still as Arrow tables), aggregated it to count the number of men and women by age, and finally collected the data in a suitable format to create the pyramid figure. As these are sample microdata, it is necessary to use sampling weights (variable V054 in the 1970 Census and V0010 in the 2010 edition).
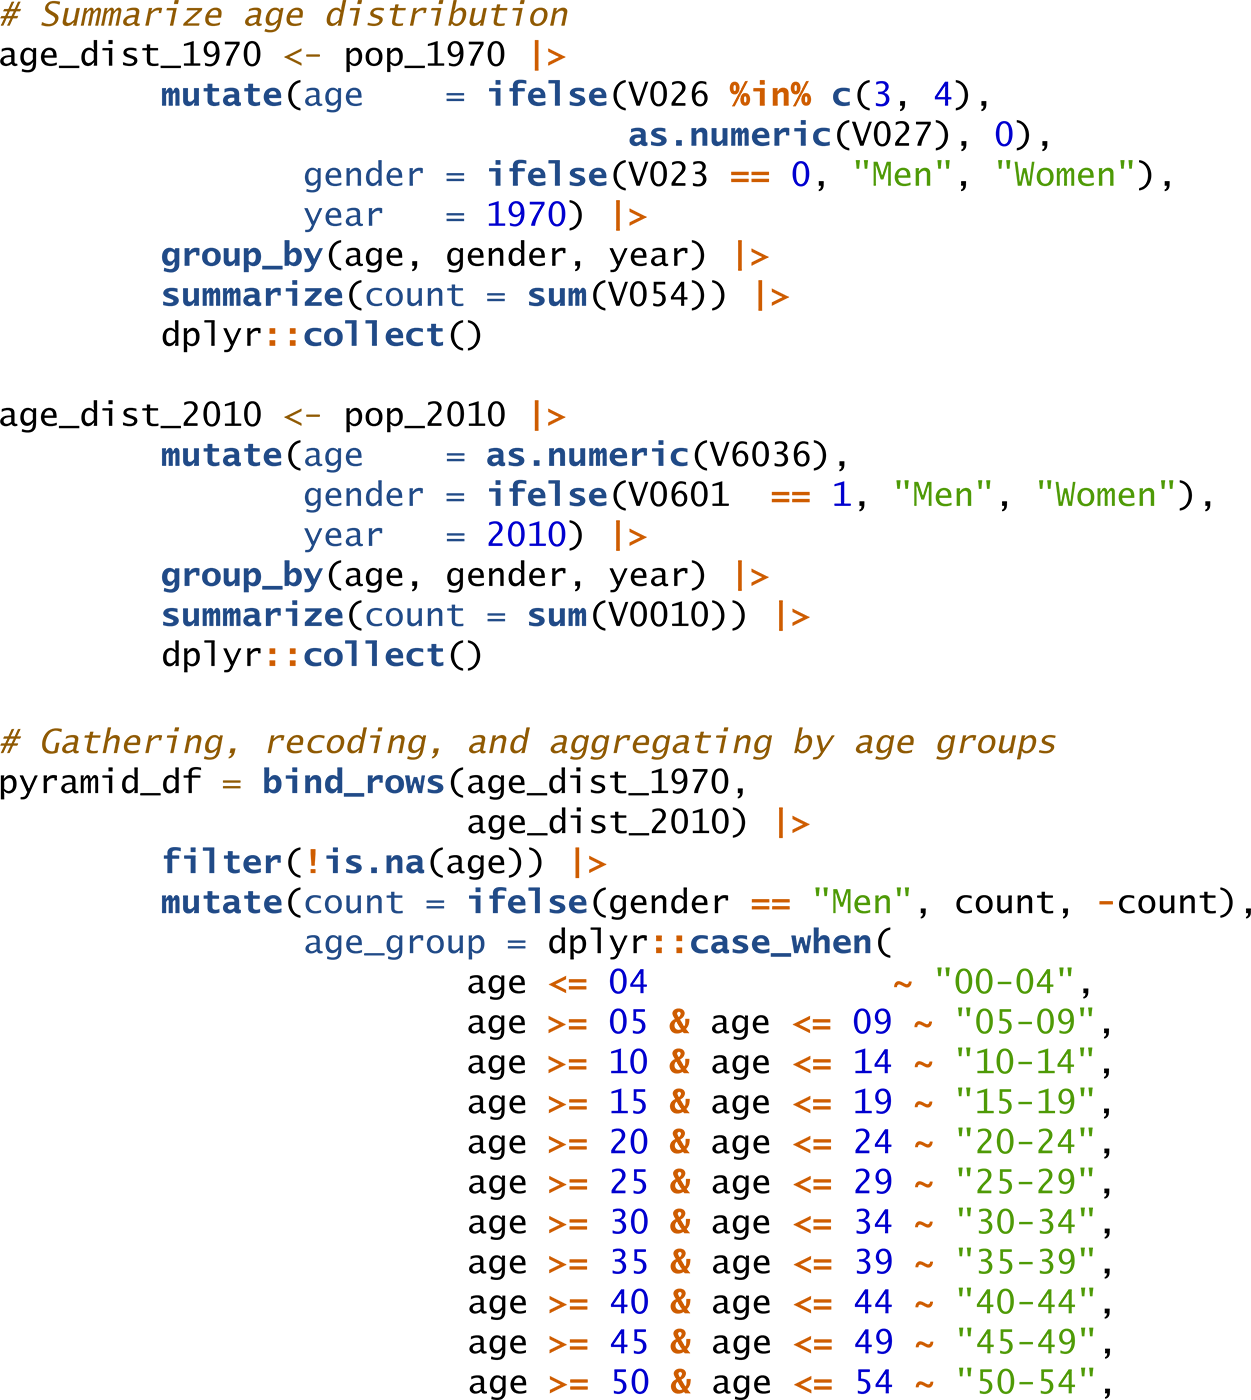

Using {ggplot2}, we can plot the age pyramid for the two census years:


Household Data: Sanitation Conditions
In this example, we use the read_households() function to access data from the 2010 Census and examine how the proportion of households with adequate sanitation carries across Brazil’s regions.
The variable V0207 lists several types of sanitation, such as connected sewage systems or septic tanks. We recoded this variable to differentiate between “Adequate Sanitation” (including connection to public sewage systems or septic tanks) and “Inadequate Sanitation” (e.g., rudimentary or no sewage treatment).

Using this summary table, we can visualize disparities in sanitation access by region:


Using Complex Sample Design in the 1960 Census
As explained above, the 1960 Census microdata provided by {censobr} is the combination of two distinct datasets: a comprehensive 25% sample survey and a 1.27% probabilistic sub-sample. The dataset provides the variables for incorporating the Complex Sample Design with stratification, clustering, and weighting. Stratification ensures that different population groups are represented with certainty, while clustering addresses the correlation among observations within the same sampling units. By their turn, sampling weights correct for disproportions and incorporates an expansion factor, making the counts sum up to the population totals.
In this section, we illustrate how to use data from the states of Rio de Janeiro and Guanabara (now the city of Rio de Janeiro) to construct an object of the class survey.design. In the following example, we estimate the distribution of the population served by different forms of water supply: the official public network vs. other forms (wells, springs, etc.). Then, we calculate the confidence intervals. First, it is necessary to download and recode the data:

Notice that despite having very similar populations, Guanabara and Rio de Janeiro have very different sample sizes in the {censobr}’s version of the 1960 Census. Guanabara is not present in the 25% sample – only in the 1.27%. Therefore, we expect it to have larger error margins.
The next example illustrates how to transform the census_rj_gb data.frame into a survey object using the function as_survey_design(), from the {srvyr} package. We inform the primary sampling units (PSUs) and secondary sampling units (SSUs), strata, and weights.

Using a simple dplyr-like syntax, we can produce a contingency table with the correct confidence intervals.


Population by forms of water supply. Guanabara (Rio de Janeiro City) and Rio de Janeiro State, 1960
Working with Census Tracts
As previously mentioned, IBGE does not distribute microdata from the universe survey. And as most users are interested in individual- or household-level analysis, the sample microdata often becomes the focus of attention. However, the aggregated data at the census tract level provides rich data on population and environmental characteristics on a detailed geographical resolution.
In its original format, this aggregated data is divided into different and separate datasets, organized by themes and types of variables (e.g., variables related to individuals, households, etc.). The same theme is often spread across multiple files (sometimes with hundreds of variables). To make accessing and using this data easier, {censobr} consolidates all files/variables into different tables. In the 2010 census, for example, the data is organized into eight tables:
-
“Basico” (Basic variables)
-
“Entorno” (Household surroundings/neighborhood)
-
“Domicilio” (Aggregated household information)
-
“Pessoa” (Aggregated persons information)
-
“Responsavel” (Aggregated information on the household heads)
-
“PessoaRenda” (Aggregated information on persons’ income)
-
“DomicilioRenda” (Aggregated information on households’ income)
-
“ResponsavelRenda” (Aggregated information on the household heads’ income)
When variables in a table originate from different files, we added a prefix to the variable names, indicating the table number of origin. For instance, let us look at the “Domicilio” table. This {censobr} table comes from two separate original files: Domicilio01 and Domicilio02. Thus, the column names in this table are organized as follows:


Spatial Distribution of Income in 2010
In this example, we map the spatial distribution of average per capita income. Information on the total number of residents in each census tract is available in the “Basico” block variable set, in the variable “V002”. The information on total income for the census tract can be found in the “DomicilioRenda” block, in the variable “V003”.
Using the code below, we can download the data and calculate the per capita income of all census tracts in Brazil. We will later filter these results to include only the tracts of the municipality of São Paulo.

The next step is to download the geometries of census tracts for 2010 using the read_census_tract() function from the {geobr} package. Here, we pass the parameter code_tract = “SP” to download all tracts in the state of São Paulo and then filter only for its capital, the municipality of São Paulo.

Finally, we can merge the spatial data with the income data of the census tracts using the key variable code_tract and create a map of the spatial distribution of per capita income in the municipality.

Spatial Distribution of Population in 2022
In this final example using the aggregated data, we use the “Preliminares” (preliminary) results from the 2022 census, which were released by IBGE in March 2024, to analyze the spatial distribution of the population in the municipality of Belo Horizonte. Specifically, we use variable “V0001”, which provides the total population of the tracts. Additionally, since there was a change in the spatial grid of census tracts between 2010 and 2022, we need to download the grid for the corresponding year.

Now, we can merge the population table with the spatial data, calculate the area of the tracts in square kilometers, and compute the population density of each tract to create the map.


Managing {censobr} files cached locally
As mentioned earlier, the first time the user runs a function, {censobr} will download and store the file locally. This way, the data only needs to be downloaded once. The package includes support functions to help users manage these files (Table 3).
Users can use the censobr_cache() function, for example, to list all files cached locally by setting list_files = TRUE.

This function also allows users to delete a specific file or all files:

By default, {censobr} files are saved in the ‘User’ directory. However, users can run the set_censobr_cache_dir() function to set a custom cache directory. Note that this custom setting needs to be specified at the beginning of each new R session.

Conclusion
The {censobr} package offers a simple and efficient way for researchers and practitioners to access and analyze Brazilian population census data. It allows handling large and complex datasets that exceed available memory resources, enabling users to manipulate in-disk data seamlessly using familiar {dplyr} syntax. Through its integration with {geobr}, {censobr} enriches datasets with geometries and standardized geographic identifiers, making it easy to carry out spatial analyses. The package also provides easy access to census documentation, including variable dictionaries, questionnaires, and interviewer’s manuals, enhancing transparency and ease of use.
The examples included in this research note illustrate the versatility of {censobr} – but, of course, they are far from exhaustive. By making census data more accessible and manageable, we intend to facilitate more data-driven insights and empower researchers with limited computing resources to engage with the census datasets that were previously difficult to handle. Future developments will focus on expanding the package’s functionalities, including support for the latest census edition and further enhancements to documentation and data handling capabilities.
References
- Brueckner, Jan K.; Mation, Lucas; Nadalin, Vanessa G. (2019), "Slums in Brazil: Where are they located, who lives in them, and do they 'Squeeze' the Formal Housing Market?". Journal of Housing Economics v. 44, pp. 48-60.
-
Dahis, Ricardo et al. (2022), Data Basis (Base Dos Dados): Universalizing Access to High-Quality Data. Disponível em SSRN: https://ssrn.com/abstract=4157813 ou http://dx.doi.org/10.2139/ssrn.4157813
» https://ssrn.com/abstract=4157813» http://dx.doi.org/10.2139/ssrn.4157813 - Goto, Erica Akemi; Suarez, A. Marcela; Ye, Haiyun. (2022), "Spatial analysis of social vulnerability in São Paulo city, Brazil.". Applied Geography, v. 140.
-
IBGE (Instituto Brasileiro de Geografia e Estatística). (1990), Estatisticas Históricas Do Brasil: Séries Econômicas Demográficas e Sociais de 1550 a 1988. Rio de Janeiro, IBGE. Disponível em: https://biblioteca.ibge.gov.br/index.php/biblioteca-catalogo?view=detalhes&id=221431
» https://biblioteca.ibge.gov.br/index.php/biblioteca-catalogo?view=detalhes&id=221431 -
IBGE (Instituto Brasileiro de Geografia e Estatística). (2013), Metodologia do Censo Demográfico 2010. Rio de Janeiro: IBGE. Available at: https://ftp.ibge.gov.br/Censos/Censo_Demografico_2010/metodologia/metodologia_censo_dem_2010.pdf
» https://ftp.ibge.gov.br/Censos/Censo_Demografico_2010/metodologia/metodologia_censo_dem_2010.pdf -
Pereira, Rafael H. M. et al. (2019), Geobr: Download Official Spatial Data Sets of Brazil. CRAN. Disponível em: https://doi.org/10.32614/CRAN.package.geobr
» https://doi.org/10.32614/CRAN.package.geobr -
Ruggles, Steven et al. (2024). IPUMS International: Version 7.5 [dataset]. Minneapolis, MN. Disponível em IPUMS: https://doi.org/10.18128/D020.V7.5
» https://doi.org/10.18128/D020.V7.5 - von Bergmann, J.; Dmitry Shkolnik; Aaron Jacobs (2021), Cancensus: R package to access, retrieve, and work with Canadian Census data and geography. V0.4.2.
-
Walker K.; Herman, M. (2025). tidycensus: Load US Census Boundary and Attribute Data as 'tidyverse' and 'sf'-Ready Data Frames. R package version 1.7.1, https://walker-data.com/tidycensus/
» https://walker-data.com/tidycensus/
-
Data Availability Statement –
The authors declare that all data used in this study are publicly available and can be accessed through the Harvard Dataverse platform: https://dataverse.harvard.edu/dataset.xhtml?persistentId=doi:10.7910/DVN/WDYA1N
-
Responsible editor:
Luiz Augusto Campos.
The authors declare that all data used in this study are publicly available and can be accessed through the Harvard Dataverse platform: https://dataverse.harvard.edu/dataset.xhtml?persistentId=doi:10.7910/DVN/WDYA1N

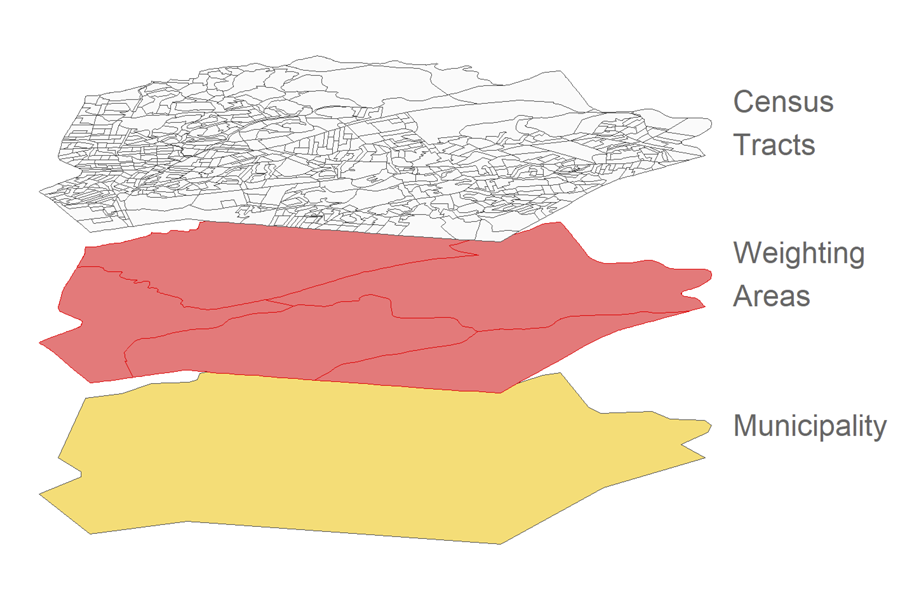 Source: {geobr}. Census tracts, weighting areas, and municipalities shapefiles (2010).
 Source: 1970 and 2010 Brazilian Census Microdata (IBGE), extracted from {censobr}
 Source: 2010 Brazilian Census Microdata (IBGE), extracted from {censobr}
 Source: 1960 Brazilian Census Microdata (IBGE), extracted from {censobr}
 Source: 2010 Brazilian Census tract data and census tract geometries (IBGE), extracted from {censobr} and{geobr}
 Source: 2022 Brazilian Census tract data and census tract geometries (IBGE), extracted from {censobr} and {geobr}