
 Equity as a guiding principle of digital transformation: a model for resource allocation in the SUS Digital Program
Abstract
This article presents the foundations, methodology, and territorial analyses that underpinned the creation of the Index of Criteria for the Distribution of Financial Resources for the Digital SUS Program (ICSD), developed by the Department of Information and Digital Health of the Ministry of Health, to promote a more equitable distribution of resources of the program. The methodology involved the use of variables, such as rural-urban typology (2017), the Social Vulnerability Index (SVI) (2015), the Brazilian Connectivity Index (Índice Brasileiro de Conectividade - IBC) (2022), the medical specialists density per inhabitant (2023), the percentage of own revenues allocated to health (2022), SUS hospital beds (2023), specialized health care establishments (2023), outpatient production (2023), as well as the attraction indices for health services, of varying complexities, used in the classification of the Region of Influence of Cities (2018). The results revealed regional inequalities and highlight the need for strategies to strengthen digital health in territories with greater vulnerability. This study also discusses the application of the ICSD in the health macroregions and the simulations that guided resource transfers within the Digital SUS Program, aiming to reduce inequities and promote territorial justice.
Key words:
Digital health; Health equity; Unified Health System; Social vulnerability; Financing
Resumo
O artigo apresenta os fundamentos, a metodologia e as análises territoriais que fundamentaram a criação do Índice de Critérios para a Distribuição de Recursos Financeiros para o Programa SUS Digital (ICSD), desenvolvido pela Secretaria de Informação e Saúde Digital do Ministério da Saúde com o objetivo de promover uma alocação mais equânime dos recursos do programa. A metodologia considerou variáveis como a tipologia rural-urbana (2017), o Índice de Vulnerabilidade Social (2015), o Índice Brasileiro de Conectividade (2022), a densidade de médicos especialistas por habitante (2023), o percentual das receitas próprias aplicadas em saúde (2022), os leitos hospitalares do SUS (2023), os estabelecimentos de saúde de atenção especializada (2023), a produção ambulatorial (2023) e índices de atração para serviços de saúde de diferentes complexidades, conforme a região de influência das cidades (2018). Os resultados evidenciaram desigualdades regionais e apontam a necessidade de estratégias para fortalecer a saúde digital em territórios de maior vulnerabilidade. O artigo discute a aplicação do ICSD nas macrorregiões e as simulações que orientaram as transferências de recursos, visando reduzir iniquidades e promover justiça territorial.
Palavras-chave:
Saúde digital; Equidade em saúde; Sistema Único de Saúde; Vulnerabilidade social; Financiamento
Resumen
Este artículo presenta fundamentos, metodología y análisis territoriales que basaron la creación del Índice de Criterios para la Distribución de Recursos Financieros para el Programa SUS Digital (ICSD), desarrollado por la Secretaría de Información y Salud Digital del Ministerio de Salud, con el objetivo de promover una asignación más equitativa de los recursos del programa. La metodología considero variables como la tipología rural-urbana (2017), el Índice de Vulnerabilidad Social (2015), el Índice Brasileño de Conectividad (2022), la densidad de médicos especialistas (2023), el porcentaje de ingresos propios en salud (2022), las camas hospitalarias del SUS (2023), los establecimientos de salud de atención especializada (2023), la producción ambulatoria (2023) y los índices de atracción de servicios, según la Región de Influencia de las Ciudades (2018). Los resultados evidenciaron desigualdades regionales, y señalan la necesidad de fortalecer la salud digital en territorios vulnerables. El artículo analiza la aplicación del ICSD en las macrorregiones y las simulaciones que orientaron las transferências de recursos, buscando reducir inequidades y promover justicia territorial.
Palabras clave:
Salud digital; Equidad en salud; Sistema Único de Salud; Vulnerabilidad social; Financiamiento
Introduction
Understanding territory as a category of critical analysis is essential when formulating or improving public policies that have equity and the promotion of territorial justice as a guideline. In Brazil, social, economic, demographic, and technological inequalities are expressed in space and condition of how individuals and communities access public goods and services, including health.
The concept of territorial justice has been developed from works that discuss the relationship among space, justice, and social inequality. According to Harvey1, the spatial organization of cities reflects and reinforces social and economic inequalities. Among geographers, according to Jacques Lévy, the association between justice and space assumes, on the one hand, that space offers content to define what is just, and on the other hand, that the capacities for action upon space allow for an approach to a just agency2. For Lima3, territorial justice inevitably involves expanding the democratic and citizenship horizon, through the recognition and realization of social rights as an inherent attribute of territorialized subjects. In this sense, one can speak not only of the right to space, but also of the territorialization of rights, when the author discusses the defense of the transversality of social rights in its systemic and complex approach.
From this perspective, the incorporation of digital technologies in health emerges as a key strategy to overcoming access barriers and improving the quality of health care in Brazil. However, the profound regional, social, and technological inequalities require public financing models capable of reducing existing inequities, considering the scenario mediated by new information and communication technologies (ICTs) and how these interfere with social structures.
Internationally, the Global Digital Health Strategy of the World Health Organization (WHO) is firm in its support of health systems’ efforts to achieve universal health coverage4.
In Brazil, the Department of Information and Digital Health of the Ministry of Health (Secretaria de Informação e Saúde Digital do Ministério da Saúde - SEIDIGI/MS), created in early 2023, coordinated the formulation and implementation of the SUS Digital Program5. The Program’s main objective is to promote progress in the digital transformation of the Brazilian health system, guaranteeing its principles, and therefore aims to contribute to expanding the population’s access to health actions and services, reducing inequities, creating conditions for continuity of care, and, at the same time, designing the application of new digital technologies from the perspective of ensuring their critical use and ethical principles within their application6.
To guarantee universal access to healthcare, comprehensiveness, and effectiveness of healthcare services, one of the challenges is to incorporate digital health actions into the planning processes of the Brazilian Unified Health System (SUS) at its different levels and federative scales - municipal, state, and regional plans - especially in the bottom-up construction of plans by health macroregion, understanding digital transformation as a constitutive element of the consolidation and strengthening of health care networks (HCNs), beginning with primary health care (PHC).
Faced with these challenges, SEIDIGI/MS prioritized bottom-up planning by health macroregion for the development of digital health transformation action plans.
By contrast, with the development of the Index of Criteria for the Distribution of Financial Resources for the SUS Digital Program (Índice de Critérios para a Distribuição de Recursos Financeiros para o Programa SUS Digital - ICSD), the financing model was defined, based on Technical Note No. 9/2023-DEMAS/SEIDIGI/MS7.
The objective was to promote the distribution of resources to states and municipalities in an equitable manner, based on scenario studies, encompassing criteria of social vulnerability, rural-urban typology, digital connectivity, installed capacity, and other indicators that reflect local conditions and their effects that may infer the determination of socio-digital inequalities.
Methodology
The development of the financing model for the SUS Digital Program faced a core challenge: the limited availability of consistent, up-to-date, and sufficiently granular data and information to capture the multicausal complexity of the determinants of social vulnerability, regional inequalities, and health inequities in the country. This is a significant obstacle in a national context marked by intense cultural, socioeconomic, and political diversity, expressed uniquely in each territory.
In this sense, when defining the parameters and weightings to construct the analysis scenarios, not only were the quality and consistency of the databases available at the municipal level taken into account, but the question of whether or not these indicators can truly represent situations of social vulnerability and specific needs related to Digital Health was also assessed. The methodology sought to balance the technical robustness of the data with its practical relevance to capture the real challenges of the territories.
The present study sought to create analytical scenarios that are not limited to observing isolated variables, but rather combine them in an integrated manner. The intention was to represent typical situations or recurring patterns that characterize the different territories.
Scenarios should not be understood as predictions, but rather as synthetic models built from the integration of multiple sources of information. They function as analytical tools capable of highlighting contrasts, revealing structural inequalities, and identifying clusters of municipalities with similar conditions, offering a comprehensive reading of territorial dynamics and disparities present in the country.
The study was divided into two stages. In the first, the initial data set included indicators and analyses already recognized and used nationally, such as the Social Vulnerability Index (SVI)8 and the rural-urban (RU) typology of the IBGE9.
The SVI, from the Institute for Applied Economic Research (Instituto de Pesquisa Econômica Aplicada - IPEA), expresses social vulnerability and expands the analysis beyond the monetary dimension, incorporating multidimensional aspects of social development.
The SVI is a synthetic index, comprised of three sub-indices: (i) urban infrastructure; (ii) human capital; and (iii) income and work, which brings together 16 indicators expressing, in an articulated manner, access to, absence of or insufficiency of assets that determine a given population’s conditions of well-being.
These assets can, to a great extent, be provided by the State, at different levels of the federation. Thus, the SVI constitutes an instrument to identify failures in the supply of public goods and services in the country.
The RU typology is a methodology that differentiates Brazilian rural and remote spaces, aligned with typologies already established by the OECD and the European Union. It considers population density and accessibility to higher-level urban centers as its main criteria, from which five classification typologies are created for municipalities: (i) remote rural; (ii) adjacent rural; (iii) remote intermediate; (iv) adjacent intermediate; and (v) urban.
Regarding density, it articulates the combination of population density and degree of urbanization, aggregating municipalities into the predominantly urban, intermediate, and predominantly rural categories. Regarding location, the study differentiates municipalities in their relation to larger urban centers (municipal isolation index: remote and adjacent). Municipalities classified as remote have a relative distance above the national average, simultaneously, in relation to greater hierarchies of Areas of Influence of Cities10. Adjacent municipalities, on the other hand, are close to the areas of influence of cities.
Based on the municipal data from these two studies, a first set of scenarios was produced, beginning with aggregations by municipalities, and their intersection with different territorial divisions, including large regions, states, and strategic territories included in the country’s regional development policies: Legal Amazon, Border Strip, Semi-Arid Region.
Data were added to these initial scenarios, and complementary analyses were performed, using data from the Brazilian Connectivity Index (Índice Brasileiro de Conectividade - IBC)11, density of specialist doctors per inhabitant12, and the application of own prescriptions in health13.
Correlation analyses of the data were carried out, with emphasis on Pearson’s correlation, to identify how the SVI, the RU typology, the IBC, and the density of specialist doctors per thousand inhabitants behave. In the analysis of Pearson’s linear correlation, it is considered that the closer to the extremes (-1 or 1), the greater the strength of the correlation. These may be either direct (positive correlation) or inverse (negative correlation). The statistical method helped to understand the factors that tend to be associated within the territory, allowing for differentiation between robust structural relationships and mere casual associations. By contrast, weak or near-zero correlations indicate independence between variables, which is also important to avoid misinterpretations and to properly calibrate the construction of scenarios.
Based on the conformation of these previous studies and scenarios, and aiming to produce a metric that would operate as a parameter for the distribution of financial resources of the SUS Digital SUS, the ICSD was created.
The ICSD was intended to reflect, in an approximate manner, the socio-digital inequalities14 in Brazil, seeking to produce a more equitable distribution of the program’s financial resources.
Corroborating the results of these initial scenarios and analyses, it was verified that the presence of dummy (binary) variables, such as the territorializations analyzed in this stage of the study, caused disproportionate weights to the results in the initial composition of the ICSD. Therefore, it was decided to use only the variables of the RU typology and the SVI, as they already represent social and regional inequalities. The SVI encompasses the dimensions of urban infrastructure, human capital, income, and work. The RU typology incorporates population density and urban hierarchy, including its correlation with the IBC and the density of doctors. In this sense, it synthesizes indicators of potential determinants of socio-digital inequalities.
The production of scenarios has become an essential intermediate step between data analysis and the formulation of the Index of Criteria for the Distribution of Financial Resources for the SUS Digital Program (ICSD), allowing the financing model to be structured on consistent bases, sensitive to inequalities and aligned with the principles of equity and regionalization of SUS. To this end, information capable of highlighting structural inequalities was prioritized.
Based on these analyses, the ICSD was defined as the sum of these two main variables: ICSD = RU + SVI.
RU corresponds to the RU typology; SVI, to the Social Vulnerability Index. For the purpose of calculating this index, values were assigned to each RU typology (Table 1), defined according to the proportion of municipalities in the very high and high SVI classes.
It is important to highlight that the ICSD methodology considered the variables available at the time, prior to the release of the 2022 Demographic Census. Both the SVI (2015) and the RU typology adopted in the municipal classification released by IBGE in 2017, with regard to the level of municipal aggregation, use population data from the 2010 IBGE Census as a reference. Although both indicators are widely used in territorial analyses, their time lag implies that socioeconomic changes and spatial reconfigurations that occurred in subsequent years may not be fully reflected in the results obtained at that time.
Furthermore, regarding the RU typology used in the study, it is acknowledged that other relevant methodological proposals developed by IBGE do exist, such as the classification of rural, urban, and nature-based spaces published in 202315, as well as the methodological revision of the RU typology applied to the 202216 Demographic Census. However, it was decided not to employ them in this study due to differences in the spatial units of analysis.
The classification published in 2023 does not constitute an update or direct continuation of the 2017 typology. Neither this proposal nor the revision used in the 2022 Census produces classifications at the municipal level, but rather in weighting areas, which frequently exceed the limits of municipalities, or in census units, in the case of the methodological revision of the 2022 Census. Although suitable for other purposes, these units do not align with the needs of the ICSD, whose construction requires the adoption of the municipal scale. This scale is essential to ensure the direct link between the territorial typology, the SVI, and the other databases and information systems used in the development of the study’s scenarios.
It is important to note that the study with the methodology, analyses, and preliminary results of the ICSD were presented and discussed at meetings of the Information and Digital Health Working Group, comprised of representatives from the Ministry of Health (Ministério da Saúde - MS), the National Council of Health Secretaries (Conselho Nacional de Secretários de Saúde - Conass), and the National Council of Municipal Health Secretariats (Conselho Nacional de Secretarias Municipais de Saúde - Conasems).
From the meetings held, it was established that the financial incentive model of the SUS Digital Program should act as an inducer of Integrated Regional Planning (Planejamento Regional Integrado - PRI), in an ascending process agreed upon in the CIB, aiming to strengthen the governance of HCNs. With the recommendations contained in CIT Resolutions No. 23/201717 and No. 37/201818, it was defined that the Transformation Action Plans for Digital Health would be conducted by the State Health Departments, in coordination with the municipalities and with the participation of the Federal Government, taking the health macroregions as a reference. These guidelines reinforce that planning should occur at the macro-regional level, since it is in this expanded space that HCNs are structured19, including high-complexity services, ensuring the scale necessary for their organization and sustainability.
From then on, new Scenario analyses were developed, with the aggregation of municipal data by health macroregion. New variables were also incorporated with data provided by the Department of Healthcare Regulation and Control (Departamento de Regulação Assistencial e Controle - DRAC), including the number of SUS beds (2023), the presence of health establishments for specialized care (2023), and outpatient production (2023). The attraction indices for health services, of high complexity and low and medium complexity, used in the classification of the Area of Influence of Cities10, were also considered.
In the end, at the 11th Ordinary Meeting of the Tripartite Intermanagerial Commission, based on the ICSD, the financing model for the SUS Digital Program20 was agreed upon.
Results and discussion
Territorial approximations: intersection between SVI and RU in the territories under analysis
Municipalities with greater isolation - especially remote rural areas - show greater criticality in SVIs. Despite limitations and sociocultural diversity, the RU typology is useful for discriminating rural and remote spaces at the municipal scale, historically defined by exclusion from the urban according to political-administrative criteria9.
Based on these analyses, scenarios were produced for the Legal Amazon, Border Strip, and Semi-arid region.
Legal Amazon and border strip
The Legal Amazon, created in the 1950s, has consolidated itself as a strategic space for development and reduction of inequalities, supported by the 1988 Constitution21 and Complementary Law No. 124/200722. It is internationally recognized for its cultural and biological diversity, with environmental and social implications23-25.
The region occupies 5.03 million km² (58.93% of Brazil), with 23% being indigenous lands, where 60% of the national indigenous population lives26,27. The analysis showed that 64% of the municipalities are in high/very high vulnerability and 48% in rural/remote areas. Despite economic progress, one of the worst inequality scenarios and health indicators still persists28.
Border Strip
The Border Strip region encompasses a group of 11 states, covering 590 municipalities, and an area of 1.4 million km². Historically, it has been characterized as a region marked by difficulty in accessing public goods and services, as well as by problems and situations inherent to border regions, such as migratory flows, cultural diversity, specific arrangements, and bilateral and multilateral cross-border cooperation. This context led to its centrality in the National Regional Development Policy in 2011. A high level of vulnerability is observed in its northern portion, intersecting with the Legal Amazon region, where 96% of the municipalities are in a very high level of criticality according to the definition of SVI.
Brazilian Semi-Arid Region
The Brazilian Semi-Arid region encompasses the Northeast and part of Minas Gerais, covering 1.12 million km², 1,262 municipalities, and approximately 27 million inhabitants, making it the most densely populated semi-arid region in the world30-33.
According to the SVI, 76% of municipalities are in high and very high vulnerability, and 76% of municipalities are rural (adjacent or remote). Despite recent progress, structural inequality persists.
Public health budget
The percentage of spending on public health actions and services (PHAS) by municipalities was also analyzed in order to demonstrate their efforts, even if in an incipient and approximate manner. A set of four ranges was established as a reference for analysis, based on the percentages of own revenues applied to health by the municipalities - indicator 3.1. “Percentage participation of own revenues applied to health according to LC No. 141/2012”.
The analysis of SIOPS13 showed four ranges of application of own revenues in PHAS. Remote municipalities are concentrated in smaller ranges; urban and adjacent municipalities in larger ranges, 63% apply more than 20% to PHAS, many in areas of high social vulnerability.
The per capita values of total health expenditures, financed by transfers and own resources, were obtained by simple average. In this analysis for the territorial divisions - the Legal Amazon and Semi-Arid region - the findings demonstrated that the municipalities in these regions depend more on transferred funds than other municipalities in Brazil, especially those located in the Semi-Arid region, where the majority of municipal health expenditures (51%) come from transfers from the states and the federal government.
Brazilian Connectivity Index (IBC) and density of specialist doctors
Considering the importance of connectivity in the field of digital transformation in health, another analysis was carried out based on the IBC, developed by Anatel (2022)11. The IBC enables the ranking of municipalities and states in relation to their respective stages of connectivity. The index consists of the weighted average of seven variables, namely: mobile access density; fixed broadband access density; percentage of mobile telephony coverage in the municipality; density of radio base stations per 10,000 inhabitants; existence of fiber optic backhaul in the municipalities; degree of competitiveness of mobile telephony; and degree of competitiveness of fixed broadband.
When comparing the IBC and its distribution with the RU typology, it was found that, of the 5,570 Brazilian municipalities, those with the lowest connectivity rates (very low and low) are those that are in the remote rural (90%), adjacent rural (56%) and remote intermediate (65%) typology. Another finding is that 66% of all municipalities in the SVI range (high and very high) are in the IBC range of very low connectivity.
In the analysis of the density of specialist doctors per inhabitant, it was found that most states in the North and Northeast regions have the lowest densities of specialist doctors per one thousand inhabitants - densities of 2.01 in the North region and 3.51 in the Northeast region. The Southeast and Midwest regions have densities close to that of the Northeast, with 3.65 and 3.92, respectively. However, the CFM data is limited, as it is impossible to say whether or not the doctor is actually practicing his profession in a specific region of the state12.
By applying Pearson’s linear correlation, the results revealed strong correlations between the IBC, the RU typology, and the SVI (-0.56 and -0.57), in an inverse manner, where the higher the IBC and the lower the SVI, the municipalities are classified as more rural and remote. The correlations between the density of specialist doctors, the SVI, and the RU typology are also inversely manifested, where the higher the SVI and the more rural and remote the municipalities, the lower the densities of specialist doctors per one thousand inhabitants. In relation to the IBC, the density of specialist doctors showed a direct correlation, where the higher the connectivity index, the higher the density of specialist doctors per one thousand inhabitants. These findings highlight the great challenge of providing and retaining specialist doctors in locations with high social vulnerability, rural and remote areas, and low connectivity (Figure 1).

Pearson linear correlation between IVS, rural-urban typology, density of specialist physicians, and IBC.
Therefore, the construction of these scenarios made it possible to infer that, in Brazil, there is a close relationship between social vulnerability and regional inequality, especially in small municipalities in rural and remote areas, indicators that may highlight socio-digital inequalities14, as observed in the correlation between connectivity (IBC), density of specialist doctors, and vulnerability (SVI) in rural areas and in situations of greater isolation.
Other studies developed by Cetic.br, such as the recent study entitled “Frontiers of digital inclusion: social dynamics and public policies of Internet access in small Brazilian municipalities”34, provide ample evidence of socio-digital inequalities, especially in small municipalities in rural and remote areas. Despite the expansion of access and an improvement in the quality of the Internet in many of these municipalities, then driven, above all, by the performance of small providers, there are challenges to the continuity of this process, especially in contexts where there is less connectivity and social vulnerabilities, bringing the need for the development of public policies that contribute to strengthening local capacities to address socio-digital inequalities.
Characterization of health macroregions and the distribution of resources
According to the tripartite agreement, the ICSD was used for the distribution of financial resources for the SUS Digital Program, and a ceiling was established per health macroregion. Thus, to use it as a measure for distributing resources per health macroregion, simple averages of the municipal ICSD were applied, and the macroregions were grouped into quintiles, forming five groups of Health Macroregions by ICSD intervals.
The classification of the health macroregions grouped into quintiles showed similar characteristics that express similar situations of social vulnerability and regional inequality, with group 1 being that with the least vulnerability and group 5 being that with the greatest vulnerability, as shown in Figure 2 and detailed in Chart 1.

Most of the municipalities in the Legal Amazon (88%) and Semi-Arid (85%) regions are in groups 5 and 4. Group 5 has a greater presence of municipalities from the Legal Amazon region, and group 4, from the Semi-Arid region. With characteristics very similar to group 5, group 4 encompasses 32% (12.7 million people) of the Brazilian population in municipalities classified as having very high and high vulnerability. This group includes 14% of remote rural municipalities, 13% of intermediate remote municipalities, and 25% of adjacent rural municipalities, with 15% of remote rural municipalities having up to 20,000 inhabitants. Group 3, although with a smaller number of municipalities in these more critical vulnerability ranges, includes 28% (12.7 million people) of the total Brazilian population in municipalities classified as having very high and high vulnerability. This group includes 8% of remote rural municipalities, 12% of intermediate remote municipalities, and 22% of adjacent rural municipalities.
Groups 1 and 2 consist mostly of urban municipalities (62%). Group 3, although it also includes municipalities from ALEG and the Semi-Arid region, has most of its municipalities with vulnerability indices of lower criticality (medium and low or very low).
It should be noted that in addition to the variables that make up the ICSD, such as the SVI and the RU typology, the population was used as a proxy variable for the installed capacity of the municipalities in the health area.
For the installed capacity by health macroregions, it was also decided to evaluate the use of the population as a proxy variable, thus testing the hypothesis that there is a linear correlation between the population and the following variables: number of SUS beds; number of establishments in specialized care; outpatient production; as well as the attraction indices for health services, of high complexity and low and medium complexity, used in the classification of the Area of Influence of Cities. For this, the Pearson coefficient between the population and these variables was calculated.
The analyses demonstrate strong positive correlations between population and the number of SUS beds (0.97), the number of specialized care facilities (0.91), and outpatient production (0.96), and a weaker correlation with the attraction index for high-complexity (0.73) and low- and medium-complexity (0.68) health services. These findings support the hypothesis that population may be a proxy variable for installed capacity.
Therefore, the following formula was applied to the resource allocation model by ICSD:
Where j is the municipality; RT is the total available resource; P is the population; x is the weight applied to the population; and ICSD is the Index of criteria for the distribution of Financial Resources for the SUS Digital Program. This calculation was carried out using R$1.00 per inhabitant and the remainder of the program’s resources was distributed according to the ICSD, in such a way that, in the end, ceilings were generated per municipality, which in turn were grouped into their respective macro-regional configurations, published in Ordinance GM/MS No. 3,233, of March 1, 202435.
When analyzing these values in light of the Health Macroregion Groups by ICSD intervals (Figure 2, Chart 1), one can see a general overview of the impact of the ICSD on the more equitable distribution of resources (Figure 3). This graph shows that using the ICSD for distribution increases per capita values in the macroregions of the most vulnerable groups and those with more remote and rural territories, such as groups 4 and 5. Despite having a smaller population than the other groups, but totaling more than 53 million people according to the 2022 Demographic Census, these groups presented the highest per capita values, R$3.31 per each inhabitant. Next are groups 3 and 2, with R$2.45 and R$2.3, respectively. Finally, group 1, being the most urban and most populous, showed R$1.4 (https://doi.org/10.48331/SCIELODATA.RYREUF).
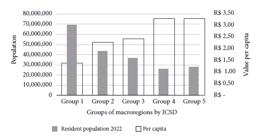
Per capita distribution of resources from the 1st stage of the Digital SUS program and the 2022 population, by health macroregion group according to ICSD intervals.
Final considerations
The use of scenarios in the ICSD construction process sought to organize, compare, and interpret different combinations of territorial, social, technological, and structural information from municipalities and health macroregions. The scenarios worked as analytical tools that allowed for an integrated view of how certain factors, such as social vulnerability, rurality, connectivity, installed capacity, availability of professionals, and local investments, overlap and shape distinct realities across the Brazilian territory.
The use of this method allowed the study to interpret data from different databases in an integrated manner; understand how socioeconomic, territorial, and technological variables overlap in different areas of the country; reduce the risk of fragmented analyses, which is especially important in national policies; guide the definition of weights and dimensions relevant to the construction of the ICSD; strengthen the technical legitimacy of the funding proposal by highlighting territorial patterns of need; and support interstate agreements based on contextualized evidence.
The combination of the SVI and the RU typology as the core of the ICSD aimed to synthesize essential dimensions of Brazilian reality: persistent socioeconomic inequalities, infrastructure asymmetries, differentiated patterns of urbanization, and distinct degrees of territorial isolation.
The adoption of the ICSD as the basis for the distribution of resources from the SUS Digital SUS represents a new model for resource allocation, no longer centrally considering the population base, but choosing indicators that represent health inequities resulting from socio-digital determinants. The methodological proposal prioritizes territories with greater social vulnerability, lower density of specialist doctors in specialized care, and lower internet connectivity, favoring a more equitable insertion of digital health actions throughout the country.
The model has the potential to induce the strengthening of regional governance, the expansion of installed capacity, and the consolidation of integrated care networks, with the incorporation of the macro-regional scale in inducing the transfer of resources, in line with the organization of HCNs, favoring digital transformation strategies that dialogue with the installed capacity, care flows, and concrete needs of the territories. Finally, the ICSD, as a guiding tool for resource allocation within the SUS Digital Program, is configured as a strategic instrument for the promotion of territorial justice, insofar as it contributes to the equitable access of the population to quality public services, to the reduction of socio-digital inequalities, and to the realization of the constitutional principles of universality and comprehensiveness of SUS.
By promoting regionalization, strengthening interstate relations, and prioritizing more vulnerable territories, the SUS Digital Program incorporates core principles of SUS and advances toward a more equitable, integrated public policy that promotes social justice.
References
- 1 Harvey D. Social justice and the city. Baltimore, MD: Blackwell; 1973.
- 2 Lévy J. Justice spatiale. In: Lévy J, Lussault M, éditeurs. Dictionnaire de la géographie et de l'espace des sociétés. Paris: Belin; 2003. p. 531-534.
- 3 Lima I. A complexidade da justiça territorial. Ensaios Geogr 2015; 4(7):5070.
- 4 World Health Organization (WHO). Global strategy on digital health 20202025. Geneva: WHO; 2021.
- 5 Brasil. Ministério da Saúde (MS). Portaria nº 3.232, de 1º de março de 2024. Altera a Portaria de Consolidação GM/MS nº 5, de 28 de setembro de 2017, para instituir o Programa SUS Digital. Diário Oficial União 2024; 2 mar.
- 6 Haddad AE, Barbosa S, Sellera PEG, D'Agostino M. Digital health: contributions from nursing. Rev Latino-Am Enferm 2024; 32:e4407.
- 7 Brasil. Ministério da Saúde (MS). Secretaria de Informação e Saúde Digital. Nota Técnica nº 9/2023DEMAS/SEIDIGI/MS. Estabelece o Índice de Critérios para Distribuição de Recursos Financeiros do Programa SUS Digital Brasil [Internet]. 2023 [acessado 2025 ago 3]. Disponível em: file:///C:/Users/luis.valdetaro/Downloads/Nota-Tecnica_9-2023-DEMAS-SEIDIGI.pdf
-
8 Instituto de Pesquisa Econômica Aplicada (Ipea). Atlas da vulnerabilidade social nos municípios brasileiros [Internet]. 2015 [acessado 2025 jun 16]. Disponível em: https://ivs.ipea.gov.br/
» https://ivs.ipea.gov.br - 9 Instituto Brasileiro de Geografia e Estatística (IBGE). Classificação e caracterização dos espaços rurais e urbanos do Brasil: uma primeira aproximação. Rio de Janeiro: IBGE; 2017.
- 10 Instituto Brasileiro de Geografia e Estatística (IBGE). Regiões de influência das cidades 2018: nota metodológica. Rio de Janeiro: IBGE; 2018.
-
11 Agência Nacional de Telecomunicações (ANATEL). Índice Brasileiro de Conectividade (IBC) 2022 [Internet]. 2022 [acessado 2025 jun 16]. Disponível em: https://informacoes.anatel.gov.br/paineis/meu-municipio/indice-brasileiro-de-conectividade
» https://informacoes.anatel.gov.br/paineis/meu-municipio/indice-brasileiro-de-conectividade -
12 Conselho Federal de Medicina (CFM). Demografia Médica no Brasil 2023 [Internet]. 2023 [acessado 2025 jun 16]. Disponível em: https://demografia.cfm.org.br/dashboard/
» https://demografia.cfm.org.br/dashboard -
13 Brasil. Ministério da Saúde (MS). SecretariaExecutiva. Departamento de Economia da Saúde, Investimentos e Desempenho. Sistema de Informações sobre Orçamentos Públicos em Saúde (SIOPS): banco de dados sobre orçamentos públicos em saúde [Internet]. 2022 [acessado 2025 jun 16]. Disponível em: https://www.gov.br/saude/pt-br/acesso-a-informacao/siops
» https://www.gov.br/saude/pt-br/acesso-a-informacao/siops - 14 Alves EPM. Estado digital: serviços digitais públicos e assimetrias federativas. Brasília: Ipea; 2025.
- 15 Instituto Brasileiro de Geografia e Estatística (IBGE). Proposta metodológica para classificação dos espaços do rural, do urbano e da natureza no Brasil. Rio de Janeiro: IBGE; 2023.
- 16 Souza AL, Damasco FS, Medeiros GBFPS, Garcia RC. Revisão metodológica da tipologia urbano-rural no Censo Demográfico 2022. Cien Saude Colet 2024; 29(11):e03062024.
- 17 Brasil. Ministério da Saúde (MS). Comissão Intergestores Tripartite. Resolução nº 23, de 17 de agosto de 2017. Estabelece diretrizes para os processos de regionalização, planejamento regional integrado e governança das redes de atenção à saúde no âmbito do SUS. Diário Oficial Uniao 2017; 18 ago.
- 18 Brasil. Ministério da Saúde (MS). Comissão Intergestores Tripartite. Resolução nº 37, de 22 de março de 2018. Dispõe sobre o processo de Planejamento Regional Integrado e a organização de macrorregiões de saúde. Diário Oficial Uniao 2018; 26 mar.
- 19 Brasil. Ministério da Saúde (MS). Portaria nº 4.279, de 30 de dezembro de 2010. Estabelece diretrizes para a organização da Rede de Atenção à Saúde no âmbito do Sistema Único de Saúde. Diário Oficial Uniao 2010; 31 dez.
-
20 Brasil. Ministério da Saúde (MS). Comissão Intergestores Tripartite. Pactuação do modelo de financiamento do Programa SUS Digital na 11ª Reunião Ordinária [Internet]. 2023 [acessado 2025 jun 16]. Disponível em: https://www.youtube.com/watch?v=GXGUMhvWg8g
» https://www.youtube.com/watch?v=GXGUMhvWg8g - 21 Brasil. Constituição (1988). Constituição da República Federativa do Brasil. Brasília: Senado Federal; 2018.
- 22 Brasil. Presidência da República. Lei Complementar nº 124, de 3 de janeiro de 2007. Institui, na forma do art. 43 da Constituição Federal, a Superintendência do Desenvolvimento da Amazônia - SUDAM, dispõe sobre sua organização administrativa e dá outras providências. Diário Oficial Uniao 2007; 4 jan.
- 23 United Nations Educational, Scientific and Cultural Organization (UNESCO). PanAmazonian region: biodiversity and cultural diversity. Paris: UNESCO; 2020.
- 24 Instituto do Homem e Meio Ambiente da Amazônia (Imazon). Amazônia 2030: bases para o desenvolvimento sustentável. Belém: Imazon; 2023.
-
25 Programa das Nações Unidas para o Meio Ambiente (PNUMA), Organização do Tratado de Cooperação Amazônica (OTCA). Perspectivas do meio ambiente na Amazônia: GEO Amazônia [Internet]. [acessado 2025 jun 16]. Disponível em: https://antigo.mma.gov.br/estruturas/PZEE/_arquivos/geoamaznia_28.pdf
» https://antigo.mma.gov.br/estruturas/PZEE/_arquivos/geoamaznia_28.pdf - 26 Instituto Brasileiro de Geografia e Estatística (IBGE). Censo Demográfico 2022: resultados gerais. Brasília: IBGE; 2022.
- 27 Instituto Socioambiental (ISA). Terras Indígenas fora da Amazônia Legal são as mais povoadas do país. São Paulo: ISA; 2023.
- 28 Rocha R, Camargo M, Falcão L, Silveira M, Thomazinho G. A saúde na Amazônia Legal: evolução recente e desafios em perspectiva comparada. São Paulo: FGV EAESP; 2021.
- 29 Brasil. Ministério da Integração Nacional (MIN). Política Nacional de Desenvolvimento Regional (PNDR). Brasília: MIN; 2011.
- 30 Instituto Brasileiro de Geografia e Estatística (IBGE). Semiárido brasileiro: mapas regionais. Rio de Janeiro: IBGE; 2024.
- 31 Superintendência Desenvolvimento Nordeste (Sudene). Resolução nº 176, de 2024. Dispõe sobre a delimitação do Semiárido Brasileiro. Diário Oficial da União 2024; 8 jan.
-
32 Instituto Nacional do Semiárido (INSA). O Semiárido Brasileiro [Internet]. 2023 [acessado 2025 jun 11]. Disponível em: https://www.gov.br/insa/pt-br/semiarido-brasileiro
» https://www.gov.br/insa/pt-br/semiarido-brasileiro -
33 Articulação Semiárido Brasileiro (ASA Brasil). Semiárido: indicadores sociais e características [Internet]. 2023 [acessado 2025 jun 16]. Disponível em: https://asabrasil.org.br/semiarido
» https://asabrasil.org.br/semiarido - 34 Centro Regional de Estudos para o Desenvolvimento da Sociedade da Informação (Cetic.br, NIC.br). Fronteiras da inclusão digital: dinâmicas sociais e políticas públicas de acesso à internet em pequenos municípios brasileiros. São Paulo: Cetic.br, NIC.br; 2022.
- 35 Brasil. Ministério da Saúde (MS). Portaria GM/MS nº 3.233, de 1º de março de 2024. Regulamenta a etapa 1: planejamento, referente ao Programa SUS Digital, de que trata o Anexo CVIII à Portaria de Consolidação GM/MS nº 5, de 28 de setembro de 2017, para o ano de 2024. Diário Oficial Uniao 2024; 1 mar.
-
Data availability statement
The data sources adopted in the research are indicated in the article’s body. Figures, tables and supplements available at: https://doi.org/10.48331/SCIELODATA.RYREUF.
The data sources adopted in the research are indicated in the article’s body. Figures, tables and supplements available at: https://doi.org/10.48331/SCIELODATA.RYREUF.

 Source: Technical Note No. 9/2023-DEMAS/SEIDIGI/MS.
 Source: Technical Note No. 9/2023-DEMAS/SEIDIGI/MS.
 Fonte: Censo Demográfico de 2022 e valores da portaria GM/MS nº 3.233, de 1º de março de 2024.