 Determination of genetic similarity of different eggplant genotypes via SSR molecular markers
ABSTRACT:
In this study, 65 eggplant genotypes including local and variaty candidate genotypes, commercial and wild genotypes used for molecular characterization. SSR markers were employed for genetic diversity assessment. Based on PIC and allele numbers, 28 simple sequence repeat (SSR) primers were selected for genetic diversity assessment. Genotypes have been scored based on SSR primers, similarity coefficients have been determined, dendrograms have been constructed, and PCA analysis has been performed. A total of 72 polymorphic markers were obtained from 28 primers, with 78.57% of the primers were polymorphic. Factor analyses based on PCA identified 13 distinct factor groups, representing 87.70% of the total variation. Genotype similarity ranged from 29% to 100%, genotypes grouped into 6 clusters at a 50% similarity level. Genotypes 16 and 17 were identified as the most closely related genotypes, exhibiting 100% similarity. They were followed by genotype pairs 61 and 62, 47 and 48, 25 and 28, and 1 and 23, all of which showed similarity coefficients of 90% or higher. Local eggplant genotypes showed genetic variation. It has been determined that the existing variation is important for genetic diversity and that the obtained data are suitable for use in breeding programs.
Key words:
Solanum melongena
; local genotype; germplasm; DNA marker; SSR
RESUMO:
Neste estudo, 65 genótipos, incluindo genótipos locais e candidatos a variedade, comerciais e genótipos selvagens, foram utilizados para a caracterização molecular de alguns genótipos de berinjela. E para realizar a caracterização molecular desses genótipos, marcadores de repetição de sequência simples (SSR) foram empregados para avaliação da diversidade genética. Além disso, com base no PIC e no número de alelos, 28 primers de repetição de SSR foram selecionados para avaliação da diversidade genética. Os genótipos também foram pontuados com base nos primers SSR, coeficientes de similaridade foram determinados, dendrogramas foram construídos e análises de ACP foram realizadas. Dessa forma, os resultados revelaram um total de 72 marcadores polimórficos foram obtidos a partir de 28 primers, com 78.57% dos primers considerados polimórficos. A análise fatorial baseada em PCA identificou 13 grupos distintos de fatores, representando 87,70% da variação total. A similaridade genotípica variou de 29% a 100%, genótipos agrupados em 6 grupos com um nível de similaridade de 50% e os Genótipos locais de berinjela apresentaram variação genética. Portanto, determinou-se que a variação existente é importante para a diversidade genética e que os dados obtidos são adequados para uso em programas de melhoramento.
Palavras-chave:
Solanum melongena
; genótipo local; germoplasma; marcador de DNA; SSR
INTRODUCTION
Eggplant (Solanum melongena L.) is a widely cultivated species in subtropical regions, both in open fields and under protected cultivation. Eggplant, which can be consumed fresh or dried, and also processed into pickles, roasted products, and jams, is a globally important vegetable species that ranks among the top cultivated vegetables in many countries due to its rich vitamin and mineral content (TAHER et al., 2017). According to FAO data for 2022, global eggplant production reached 59,346,227 tons, with China leading at 64.6% (38,318,000 tons), followed by India at 21.5% (12,765,000 tons) and Egypt at 2.4% (1,397,000 tons). Türkiye ranks fourth in global eggplant production with 1.3% (781,242 tons) (FAO, 2022). Within Türkiye, eggplant ranks seventh among cultivated vegetable species. In 2023, the total eggplant cultivation area in Türkiye was 166,619 hectares, with a total production of 817,591 tons.
The most commonly cultivated eggplant species worldwide is Solanum melongena L., also known as culinary eggplant. S. melongena differs from its wild relatives in fruit color and shape and exhibits significant genetic variation. This variation is further diversified through local genotypes. They are valuable genetic materials that contribute to diversity in crop production due to their high adaptation capabilities to different ecological conditions. These genetic materials serve as gene pools in breeding programs and include genotypes with high environmental adaptation, resistance to stress factors, and good yield and quality traits (AZHAR et al., 2009). With these characteristics, the “Diyarbakır local eggplant” is an important genetic material that can contribute to genetic diversity. It is typically black-purple in color, elongated (20-30 cm), and large (200-400 g). It is mainly cultivated in Diyarakır, Batman and Mardin in Sauth East Region in Türkiye. Diyarbakır ranks eighth in Türkiye’s eggplant-producing provinces with 24,960 tons (TUIK, 2023). The majority of the eggplants grown in this region -excluding commercial varieties- consist of local genotypes. However, eggplant fruits with non-uniform color and shape are frequently encountered in markets. Therefore, the collection, conservation, and preservation of local genetic resources, which are under threat of depletion or extinction, has become essential for the sustainability of plant production. Within this scope, Diyarbakır local eggplant genotypes have been collected and preserved through a project and doctoral study (ALAS, 2022). However, molecular characterization of these local genotypes has not yet been conducted. This study documented the Diyarbakır local eggplant genotypes and determined their genetic relationships.
Another factor contributing to genetic diversity in eggplant is “wild species” and this species are important sources of variation in eggplant breeding due to their resilience to stress conditions (MUTEGI et al., 2015). In the present study, certain wild eggplant species previously identified as tolerant to stress factors were also included in the trials, and their potential genetic relationships with local genotypes were investigated. Furthermore, hybrid eggplants can be developed using eggplant genotypes that exhibit a high similarity coefficient with wild relatives (DHATT et al., 2017). In this respect, determining the genetic relationships between wild species and cultivated eggplant is of great importance.
Genetic relationships can be determined through morphological or molecular characterization. However, for a successful breeding program, molecular characterization using molecular markers is considered a powerful and effective technique. Molecular markers have been characterized based on two fundamental principles: hybridization-based markers (RFLP: Restriction Fragment Length Polymorphism) and polymerase chain reaction (PCR)-based markers (SSR: Simple Sequence Repeats; RAPD: Random Amplified Polymorphic DNA; SCAR: Sequence Characterized Amplified Regions; AFLP: Amplified Fragment Length Polymorphism) (YORGANCILAR et al., 2015). Although, the RFLP marker system was predominantly used in the early stages of molecular studies, the discovery of PCR led to the widespread adoption of SSR markers due to their high reproducibility, multi-allelic nature, co-dominant inheritance, broad genome coverage, and ease of use. Their high polymorphism value makes SSR a preferred genetic marker in mapping, diversity studies, and population genetics (NUNOME et al., 2003). SSR markers have been successfully used in numerous studies conducted on various plant species (ZHOU et al., 2015; ZHANG et al., 2016; KARAKURT et al., 2020), including eggplant (NUNOME et al., 2009; ADENIJI et al., 2012; AHMED et al., 2019; AKHTHER et al., 2021), to assess genetic diversity.
This study determined the molecular characterization, similarities, and differences of eggplant wild relatives, along with local eggplant genotypes from Diyarbakır and other regionally adapted eggplant genetic resources. For this purpose, genetic diversity, distance, and variations within the germplasm were assessed using SSR markers. Beyond contributing to the conservation of genetic resources, this research also lays a foundation for breeding programs.
MATERIALS AND METHODS
The molecular characterization study of eggplant genotypes was conducted at Ege University Faculty of Agriculture utilizing the germination room and seedling greenhouse of the Department of Horticulture, as well as the Seed Technology Application and Research Center laboratory in Izmir/Türkiye.
Plant material
The study included a total of 65 genotypes as plant material, comprising 37 local eggplant genotypes collected from the Diyarbakır province, districts, and villages; one local Diyarbakır eggplant genotype obtained from the gene bank of the Aegean Agricultural Research Institute (ETAE); four commercial varieties; 14 genotype candidates (lines) from 3X-Tarım Co. (Isparta); and nine genotypes from different countries provided by the Asian Vegetable Research and Development Center (AVRDC) (Table 1).
Commercial varieties were included in the study as they are the most commonly preferred varieties in the region. Additionally, genotypes obtained from 3X-Tarım Co., which were identified as resistant to various stress conditions, and wild genotypes supplied by AVRDC were incorporated into the experiment to assess their similarities to local Diyarbakır eggplant varieties.
Seedling production
In the study, a fully automated germination room with a floor area of 20 m² was employed for seedling production. The room was equipped with racks for seed placement, and the germination process was carried out in a heated seedling greenhouse with a polycarbonate sidewall and polyethylene-covered roof, designed as a bitunnel structure.
15 seeds from each genotype were sown in 128-cell foam trays filled with peat (Klassman, TS1, Germany), with one seed per cell. The trays were moistened and covered with stretch film. The trays were kept under dark conditions in the germination chamber at a temperature of 22-24 °C and 85% relative humidity for 3 days. Following seed germination, the stretch film was removed, and the trays were transferred to the seedling production greenhouse, where the seedlings were maintained until they reached transplantable size (44 days after seed sowing). Irrigation was performed regularly through an overhead sprinkler system (boom system) within the greenhouse. Leaf samples for molecular characterization were collected when the seedlings developed 3-4 leaves.
DNA extractions
DNA extractions were performed on young leaves when the seedlings reached the 3-4 leaf stage. The collected samples were frozen in liquid nitrogen (-196 °C) and stored in a -80 °C freezer until the extraction procedure. For DNA extraction, leaf samples were disrupted using a Tissue Lyser, and the resulting homogenates were processed according to the protocol provided in the plant DNA extraction kit (DNeasy Plant Mini Kit, Qiagen) to isolate DNA from the genotypes. The quality of the extracted DNA was assessed using 1% agarose gel electrophoresis, and the samples were then diluted to a final DNA concentration of 20 ng µL-1.
SSR primer selection and PCR analysis
Simple Sequence Repeat (SSR) markers were utilized for his purpose. SSR markers were selected from the literature (NUNOME et al., 2009; DEMIR et al., 2010; TUMBILEN et al., 2011; HOQUE & KASHPIA, 2018) and from the DNA marker database for vegetables of the Institute of Vegetable and Floriculture Science (NARO, Japan) (VEGMARKS, 2021). Markers were evaluated based on Polymorphism Information Content (PIC) and allele number, and 28 SSR markers were selected for determining genetic diversity (Table 2).
The PCR mixture was modified from the specified literature, tested in different cocktail volumes, and it was decided to use a final PCR cocktail volume of 15 µL. The PCR mixture consisted of 2 μL genomic DNA, 0.75 μL forward primer, 0.75 μl reverse primer, 1.50 μL 10X buffer, 1.20 μL dNTPs, 1.80 μL MgCl2, 0.20 μL Taq polymerase, and 6.80 μL H2O.
The PCR process was carried out in a PTC-200 Peltier Thermal Cycler (MJ Research Inc., Watertown, Massachusetts, USA). The amplification conditions for PCR included an initial denaturation at 94 °C for 5 minutes, followed by 35 cycles of 94 °C for 40 seconds, 55-65 °C for 40 seconds, and 72 °C for 1 minute. After the final cycle, an extension step was performed at 72 °C for 10 minutes, followed by storage at 4 °C until use. To separate the amplicons obtained from PCR, gel electrophoresis was conducted using gels of different concentrations (1.5%, 2.0%, 2.5%) containing 0.003% RedSafe nucleic acid stain. Various voltage and time combinations were tested, and it was determined that the optimal conditions were 1.5% gel run at 90 watts for 1 hour. Gel images were captured under UV light and compared with the DNA marker (Fermantas 3204) loaded on the gel. Bands matching the marker were scored as “1” and those not matching were scored as “0”. The resulting scores were recorded in a Microsoft Office Excel file.
Data analysis
The polymorphism rates of the primers (%) were determined by dividing the number of polymorphic bands by the total number of bands and multiplying by 100. The Polymorphism Information Content (PIC) of the primers was calculated using the formula PIC = 1 - Σ Pi² (DE RIEK et al., 2001). According to this method, the total number of bands with the presence (1) or absence (0) of polymorphic bands was counted, and frequency values (Pi) were calculated for each band.
The scores generated by the genotypes for the SSR primers were analyzed using the NTSYS-PC software (2.2j, 1986-2006, Applied Biostatistics Inc., Steuket, New York, USA). The similarity coefficients of the genotypes were calculated using the Jaccard method, and the dendrograms were constructed using the UPGMA (Unweighted Pair Group Method with Arithmetic Mean) method, based on the arithmetic mean. After constructing the correlation matrix using the SIMINT (Similarity for Interval Data) module of the software, Principal Component Analysis (PCA) was performed.
RESULTS
In this study, molecular characterization was performed on a total of 65 genotypes, including local genotypes collected from the Diyarbakır region, genotype candidates and wild eggplant genotypes obtained from the gene bank, as well as commercially used genotypes in the region. A total of 28 primers were employed for the analysis, and based on the comparisons of the bands obtained from the scored primers, it was determined that most of the primers used were polymorphic.
Factor analyses based on PCA revealed that there were 13 factor groups with eigen values greater than 1, which together accounted for 87.70% of the total variation (r = 0.69). The resulting factor groups are presented in table 3.
The total number of bands for the primers ranged from 1 to 5, with a total of 78 bands, and an average of 2.79 bands per primer. The number of polymorphic bands ranged from 0 to 5, with an average of 2.57 polymorphic bands per primer. Out of the 28 primers, 6 did not yield polymorphic bands, while 22 primers showed polymorphism, resulting in a total of 72 polymorphic markers. The average polymorphism rate was 78.57%. The primers that produced the most polymorphic bands were emh11G09 and CSM44. The PIC values of the primers ranged from 0.73 to 0.93, with an average PIC value of 0.65 (Table 4).
Total number of bands, number of polymorphic bands, polymorphism rate, and polymorphism information content (PIC) for the 28 SSR primers.
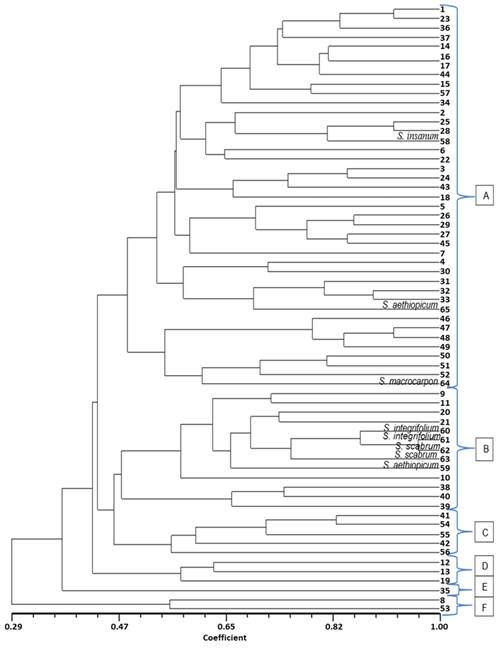
The UPGMA dendrogram showing the similarity between genotypes based on SSR markers is shown in figure 1. Upon examining this dendrogram, it can be observed that the similarity rate among all genotypes varies between 29% and 100%, with all genotypes grouped into 6 clusters at a 50% similarity level. The majority of the genotypes (genotypes 1, 2, 3, 4, 5, 6, 7, 14, 15, 16, 17, 18, 22, 23, 24, 25, 26, 27, 28, 29, 30, 31, 32, 33, 34, 36, 37, 43, 44, 45, 46, 47, 48, 49, 50, 51, 52, 57, 58, 64, and 65) were grouped under cluster A, while cluster B included 13 genotypes (9, 10, 11, 20, 21, 38, 39, 40, 59, 60, 61, 62, 63), cluster C included 5 genotypes (41, 42, 54, 55, 56), cluster D included 3 genotypes (12, 13, 19), cluster E contained 1 genotype (35), and cluster F contained 2 genotypes (8, 53).

Dendrogram showing the similarities between genotypes based on SSR markers (Genotypes not listed are attributed to the S. melongena species).
The genotypes 16 and 17 are closest to each other and exhibited 100% similarity. Following this, the genotypes with similarity coefficients of 90% or higher were genotype pairs 61 and 62, 47 and 48, 25 and 28, and 1 and 23. When examining the proximity of the wild genotypes from AVRDC to S. melongena, it was observed that they were mostly closely related to S. insanum (58), S. macrocarpon (64), and S. aethiopicum (65). The species S. integrifolium (60, 61) and S. scabrum (62, 63), which are closely related species, formed a separate group, showing proximity to only a few S. melongena genotypes.
In the molecular dendrogram, the same wild species (S. aethiopicum) collected from different countries were found to cluster into distinct groups (65-Yugoslavia: cluster A, 59-Philippines: cluster B). Furthermore, it was observed that the commercial cultivars Halep (43) Karası in cluster A and Aydın Siyahı (40) in cluster B were grouped together with wild species.
DISCUSSION
Eggplant is a vegetable species with wide genetic variation, encompassing local genotypes, commercial cultivars, and wild relatives. Genetic diversity and relatedness provide crucial information for eggplant variety identification and genetic improvement. Indeed, a greater genetic distance between genotypes indicates higher genetic diversity compared to a lower genetic distance (AHMED et al., 2019). Fundamentally, this value serves as an indicator of genetic differentiation. In the present study, 78.57% of the primers were polymorphic, demonstrating the genetic diversity within the tested eggplant germplasm. Various molecular studies on eggplant (PROHENS et al., 2005; MUÑOZ-FALCÓN et al., 2009; TUMBILEN et al., 2011; BOYACI et al., 2015) have also confirmed the genetic diversity among eggplant genotypes.
Various molecular marker techniques, including RAPD (SINGH et al., 2006; TIWARI et al., 2009), AFLP (PROHENS et al., 2005), ISSR (ISSHIKI et al., 2008; ALI et al., 2011), SRAP (LI et al., 2010), and SSR (NUNOME et al., 2003; MUÑOZ-FALCÓN et al., 2011), have been utilized for the molecular characterization of eggplant genotypes. Microsatellites (SSR) have been reported as widely preferred genetic markers in mapping, diversity studies, and population genetics due to their high polymorphism values (NUNOME et al., 2003) and have been successfully applied to assess genetic diversity in various plant species (ZHOU et al., 2015; ZHANG et al., 2016). SINGH et al. (2006) reported that the polymorphism observed among the studied eggplant species reflected high genetic diversity, with PIC values ranging from 0.05 to 0.92. In the present study, genetic similarity based on SSR data ranged from 0.29 to 1.00, with eggplant genotypes clustering into six groups at an average similarity rate of 50%. These findings revealed the potential of SSR markers in distinguishing between genetically close or distant genotypes. Similarly, DEMIR et al. (2010) conducted a molecular characterization study using SSR markers in eggplant genotypes and reported genetic similarity ranging from 0.15 to 1.00. ADENIJI et al. (2012) found that, in a dendrogram constructed using the UPGMA clustering method, similarity coefficients ranged from 0.45 to 1.00, with genotypes clustering into four groups at a similarity level of 0.59 and into seven groups at 0.71. VILANOVA et al. (2014) reported PIC values ranging from 0.07 to 0.77, with an average PIC value of 0.50, while NUNOME et al. (2009) reported an average PIC value of 0.27 for markers used in S. melongena. These results were found to be consistent with the genetic similarity values obtained in the present study.
In the molecular dendrogram, the wild species S. aethiopicum was clustered into two distinct groups. This indicated the presence of intraspecific genetic diversity and variation, as well as the influence of geographical isolation, evolutionary processes, and gene flow. It also suggested that the genetic material is not homogeneously distributed and may reflect admixture or potential contamination. Populations of the same species cultivated in different geographical regions may have undergone geographic adaptation and environmental selection processes, thereby developing distinct allelic combinations (TUMBILEN et al., 2011; MEYER et al., 2012; DEMPEWOLF et al., 2017;). Consequently, they may be assigned to different molecular clusters. Therefore, such differences should be taken into consideration in breeding programs and in the conservation of genetic resources. The genetic affinity between S. aethiopicum and S. melongena has been attributed to their equal chromosome numbers, the relative ease of hybridization between them, and the minimal degree of incompatibility observed (YU et al., 2023).
It was also observed that wild genotypes and commercial genotypes were grouped together. This indicated the presence of both intra- and interspecific genetic similarities, reflecting high levels of genetic relatedness and shared allelic diversity (TANKSLEY & MCCOUCH, 1997; DEMPEWOLF et al., 2017). It further suggested a dependency on certain genetic resources in breeding material, implying that the cultivars may have originated from a relatively narrow genetic base (TANKSLEY & MCCOUCH, 1997). Moreover, it indicates that wild genes may have been introgressed into commercial varieties, and that preserved or transferred wild alleles are still present within cultivated genotypes (PROHENS et al., 2005). This highlighted the significance of wild genotypes as a valuable source of genetic diversity and underlines their importance in breeding programs.
From the perspective of the marker set used, if wild and commercial genotypes are clustered together in the molecular dendrogram, this suggests that the markers employed may not possess sufficient discriminatory power, exhibit limited resolution, or target specific genomic regions, thereby failing to capture subtle genetic differences (POWELL et al., 1996; SEMAGN et al., 2006). The fact that the marker set was able to detect wild alleles still present in the genomes of cultivated varieties may provide breeders with insights into which commercial cultivars are genetically closer to wild species. Such information can be valuable for the introgression of specific target traits (e.g., stress tolerance, resistance). In breeding strategies aiming to exploit heterosis or to generate novel variation, genetically distant parents should be selected. If the marker set is unable to make such distinctions, its ability to guide crossing decisions is limited (TANKSLEY & MCCOUCH, 1997). However, relying solely on this marker set for parental selection can be risky. The incorporation of higher-resolution markers (e.g., SNP panels, GBS/RAD-seq) or markers targeting functional genomic regions would yield more reliable results for designing effective crossing strategies (POLAND & RIFE, 2012; SONAH et al., 2013).
In the present study, the high levels of polymorphism detected were also observed in the morphological characterization of similar genotypes conducted by ALAS (2022). According to the morphological characterization data, the dendrogram constructed revealed considerable genetic diversity among the evaluated genotypes, not only in terms of fruit shape, size, and color, but also regarding plant growth habit, leaf morphology, and yield traits (ALAS, 2022). These findings are consistent with the results reported by PROHENS et al. (2005), TUMBILEN et al. (2011), ADENIJI et al. (2012), and CAKIR et al. (2017). However, discrepancies were observed between the similarity groups derived from the morphological dendrogram and those obtained from the molecular dendrogram. As is well established, morphological characterization is a form of analysis that highlights phenotypic variation by employing qualitative and quantitative traits. By contrast, dendrograms generated from molecular characterization emphasize the similarity of genetic composition. Consequently, it has been reported that groups derived from morphological and molecular dendrograms may differ, and that molecular dendrograms can reveal clusters based on the geographic origin of genotypes (ODONG et al., 2011).
CONCLUSION
As a result of the molecular characterization of eggplant genotypes using SSR markers, the genetic distance among the genotypes studied was found to be variable, and the majority of the primers used were determined to be polymorphic. The high polymorphism rate reflected the genetic diversity of the germplasm under investigation and also indicated the presence of shared allelic diversity and genetic relatedness between wild species and commercial genotypes. The clustering of the same wild species into different groups highlighted the impact of geographical isolation and environmental adaptation on genetic structure, whereas the grouping of some wild and commercial genotypes together revealed both the narrow genetic base underlying the breeding process and the limited discriminatory power of the markers employed. The differences observed between the clustering patterns of molecular and morphological (ALAS, 2022) dendrograms of the same genotypes emphasized the necessity of integrating both characterizations in breeding studies. This finding is also significant for the efficient utilization of genetic resources. Although, SSR markers proved successful in detecting genetic similarities and differences both within and between species, the application of higher-resolution marker technologies (e.g., SNPs) in future studies will provide more reliable results for parental selection and the generation of novel variation, thereby contributing to the effective evaluation of genetic resources.
ACKNOWLEDGMENTS
We would like to express our gratitude to the Ege University Scientific Research Projects Coordination Unit for providing financial support for the project titled “Molecular Characterization of Diyarbakır Local Eggplant Genotypes” (Project No: FGA-2020-21770). Additionally, we extend our thanks to Research Assistant Dr. Tansel Kaygısız for her contributions to the molecular analyses.
REFERENCES
-
ADENIJI, O. et al. Molecular diversity among seven Solanum (eggplant and relatives) species assessed by simple sequence repeats (SSR) markers. African Journal of Biotechnology, v.11, p.15643-15653, 2012. Available from: <Available from: http://dx.doi.org/10.5897/AJB12.1206 >. Accessed: Nov. 20, 2022. doi: 10.5897/AJB12.1206.
» https://doi.org/10.5897/AJB12.1206.» http://dx.doi.org/10.5897/AJB12.1206 -
AHMED, F. et al. Molecular characterization of some brinjal genotypes (Solanum melongena L.) using simple sequence repeat (SSR) markers. African Journal of Agricultural Research, v.14, p.1980-1989, 2019. Available from: <Available from: https://doi.org/10.5897/AJAR2019.14449 >. Accessed: Nov. 22, 2022. doi: 10.5897/AJAR2019.14449.
» https://doi.org/10.5897/AJAR2019.14449.» https://doi.org/10.5897/AJAR2019.14449 -
AKHTHER, N. et al. Assessment of genetic diversity among sixty five brinjal genotypes using SSR markers. Bangladesh Journal of Nuclear Agriculture, v.35, p.71-83, 2021. Available from: <Available from: https://www.bjna.info/files/2956-BJNA-35%20(08)-2021.pdf >. Accessed: Oct. 01, 2024.
» https://www.bjna.info/files/2956-BJNA-35%20(08)-2021.pdf -
ALAS, E. Investigations on high temperature stress tolerance of Diyarbakır local eggplant genotypes, 2022. 273 p. Thesis (PhD), Institute of Natural and Applied Sciences, University of Ege, Izmir, Türkiye. Available from: <Available from: https://tez.yok.gov.tr/UlusalTezMerkezi/tezSorguSonucYeni.jsp >. Accessed: Oct. 01, 2024.
» https://tez.yok.gov.tr/UlusalTezMerkezi/tezSorguSonucYeni.jsp -
ALI, Z. et al. Molecular diversity analysis of eggplant (Solanum melongena) genetic resources. Genetic and Molecular Research, v.10, n.2, p.1141-1155, 2011. Available from: <Available from: https://doi.org/10.4238/vol10-2gmr1279 >. Accessed: Oct. 15, 2024. doi: 10.4238/vol10-2gmr1279.
» https://doi.org/10.4238/vol10-2gmr1279.» https://doi.org/10.4238/vol10-2gmr1279 -
AZHAR, F. M. et al. Genetic variability of heat tolerance, and its effect on yield and fibre quality traits in upland cotton (Gossypium hirsutum L.). Plant Breeding, v.128 n.4, p.356-362, 2009. Available from: <Available from: https://doi.org/10.1111/j.1439-0523.2008.01574.x >. Accessed: Dec. 02, 2024. doi: 10.1111/j.1439-0523.2008.01574.
» https://doi.org/10.1111/j.1439-0523.2008.01574.» https://doi.org/10.1111/j.1439-0523.2008.01574.x -
BOYACI, H. F. et al. Morphological and molecular characterization and relationships of Turkish local eggplant heirlooms. Notulae Botanicae Horti Agrobotanici Cluj-Napoca, v.43, n.1, p.100-107, 2015. Available from: <Available from: https://doi.org/10.15835/nbha4319773 >. Accessed: Nov. 20, 2024. doi: 10.15835/nbha4319773.
» https://doi.org/10.15835/nbha4319773.» https://doi.org/10.15835/nbha4319773 -
CAKIR, Z. et al. The morphological diversity and fruit characterization of Turkish eggplant (Solanum melongena L.) populations. Ekin Journal of Crop Breeding and Genetics, v.3 n.2, p.34-44, 2017. Available from: <Available from: https://doi.org/10.5555/20183368684 >. Accessed: Nov. 10, 2024. doi: 10.5555/20183368684.
» https://doi.org/10.5555/20183368684.» https://doi.org/10.5555/20183368684 -
DEMIR, K. et al. Genetic diversity of eggplant (Solanum melongena) germplasm from Turkey assessed by SSR and RAPD markers. Genetics and Molecular Research, v.9 n.3, p.1568-1576, 2010. Available from: <Available from: https://doi.org/10.4238/vol9-3gmr878 >. Accessed: Dec. 25, 2024. doi: 10.4238/vol9-3gmr878.
» https://doi.org/10.4238/vol9-3gmr878.» https://doi.org/10.4238/vol9-3gmr878 -
DEMPEWOLF, H. et al. Past and future use of wild relatives in crop breeding. Crop Science, v.57 n.3, p.1070-1082, 2017. Available from: <Available from: https://doi.org/10.2135/cropsci2016.10.0885 >. Accessed: Sept. 22, 2025. doi: 10.2135/cropsci2016.10.0885.
» https://doi.org/10.2135/cropsci2016.10.0885.» https://doi.org/10.2135/cropsci2016.10.0885 -
DE RIEK, J. et al. AFLP based alternatives for the assessment of distinctness, uniformity and stability of sugar beet varieties. Theoretical and Applied Genetics, v.103 n.8, p.1254-1265, 2001. Available from: <Available from: https://doi.org/10.1007/s001220100710 >. Accessed: Dec. 12, 2024. doi: 10.1007/s001220100710.
» https://doi.org/10.1007/s001220100710.» https://doi.org/10.1007/s001220100710 -
DHATT, A. S. et al. Morphological and molecular characterization of Solanum melongena and related species. Vegetable Science, v.44 n.1, p.1-11, 2017. Available from: <Available from: https://doi.org/10.61180/zrbfch14 >. Accessed: Nov. 21, 2024. doi: 10.61180/zrbfch14.
» https://doi.org/10.61180/zrbfch14.» https://doi.org/10.61180/zrbfch14 -
FAO. Food and Agriculture Organization of the United Nations, 2022. Available from: <Available from: https://www.fao.org/faostat/en/#home >. Accessed: Nov. 20, 2024.
» https://www.fao.org/faostat/en/#home -
HOQUE, M. E.; KASHPİA, T. Molecular characterization and DNA fingerprinting of some local eggplant genotypes and its wild relatives. International Journal of Environment, Agriculture and Biotechnology, v.3 n.5, p.1562-1570, 2018. Available from: <Available from: https://doi.org/10.22161/ijeab/3.5.1 >. Accessed: Dec. 16, 2024. doi: 10.22161/ijeab/3.5.1.
» https://doi.org/10.22161/ijeab/3.5.1.» https://doi.org/10.22161/ijeab/3.5.1 -
ISSHIKI, S. et al. ISSR variations in eggplant (Solanum melongena L.) and related Solanum species. Scientia Horticulturae, v.117, p.186-190, 2008. Available from: <Available from: https://doi.org/10.1016/j.scienta.2008.04.003 >. Accessed: Dec. 14, 2024. doi: 10.1016/j.scienta.2008.04.003.
» https://doi.org/10.1016/j.scienta.2008.04.003.» https://doi.org/10.1016/j.scienta.2008.04.003 -
KARAKURT, Y. et al. Biber (Capsicum annuum L.) genotiplerinin SSR markörleri ile genetik karakterizasyonu. Journal of Agriculture Faculty of Ege University, v.57, n.2, p.185-191, 2020. Available from: <Available from: https://doi.org/10.20289/zfdergi.614237 >. Accessed: Nov. 19, 2024. doi: 10.20289/zfdergi.614237.
» https://doi.org/10.20289/zfdergi.614237.» https://doi.org/10.20289/zfdergi.614237 -
LI, H. et al. Analysis of genetic variation in eggplant and related Solanum species using sequence-related amplified polymorphism markers. Scientia Horticulturae, v.125, n.1, p.19-24, 2010. Available from: <Available from: https://doi.org/10.1016/j.scienta.2010.02.023 >. Accessed: Oct. 28, 2024. doi: 10.1016/j.scienta.2010.02.023.
» https://doi.org/10.1016/j.scienta.2010.02.023.» https://doi.org/10.1016/j.scienta.2010.02.023 -
MEYER, R. et al. Patterns and processes in crop domestication: an historical review and quantitative analysis of 203 global food crops. New Phytologist, v.196 n.1, p.29-48, 2012. Available from: <Available from: https://doi.org/10.1111/j.1469-8137.2012.04253.x >. Accessed: Sept. 22, 2025. doi: 10.1111/j.1469-8137.2012.04253.x.
» https://doi.org/10.1111/j.1469-8137.2012.04253.x.» https://doi.org/10.1111/j.1469-8137.2012.04253.x -
MUÑOZ-FALCÓN, J. E. et al. Diversity in commercial varieties and landraces of black eggplants and implications for broadening the breeders’ gene pool. Annals of Applied Biology, v.154, p.453-465, 2009. Available from: <Available from: https://doi.org/10.1111/j.1744-7348.2009.00314.x >. Accessed: Dec. 28, 2024. doi: 10.1111/j.1744-7348.2009.00314.x.
» https://doi.org/10.1111/j.1744-7348.2009.00314.x.» https://doi.org/10.1111/j.1744-7348.2009.00314.x -
MUÑOZ-FALCÓN, J. E. et al. Diversity, relationships, and genetic fingerprinting of the Listada de Gandía eggplant landrace using genomic SSRs and EST-SSRs. Scientia Horticulturae, v.129, p.238-246, 2011. Available from: <Available from: https://doi.org/10.1016/j.scienta.2011.03.034 >. Accessed: Dec. 3, 2024. doi: 10.1016/j.scienta.2011.03.034.
» https://doi.org/10.1016/j.scienta.2011.03.034.» https://doi.org/10.1016/j.scienta.2011.03.034 -
MUTEGI, E. et al. Genetic diversity and population structure of wild/weedy eggplant (Solanum insanum; Solanaceae) in southern India: Implications for conservation. American Journal of Botany, v.102, p.140-148, 2015. Available from: <Available from: https://doi.org/10.3732/ajb.1400403 >. Accessed: Nov. 20, 2024. doi: 10.3732/ajb.1400403.
» https://doi.org/10.3732/ajb.1400403.» https://doi.org/10.3732/ajb.1400403 -
NUNOME, T. et al. Identification and characterization of microsatellites in eggplant. Plant Breeding, v.122, p.256-262, 2003. Available from: <Available from: https://doi.org/10.1046/j.1439-0523.2003.00816.x >. Accessed: Nov. 17, 2024. doi: 10.1046/j.1439-0523.2003.00816.x.
» https://doi.org/10.1046/j.1439-0523.2003.00816.x.» https://doi.org/10.1046/j.1439-0523.2003.00816.x -
NUNOME, T. et al. Development of SSR markers derived from SSR-enriched genomic library of eggplant (Solanum melongena L.). Theoretical and Applied Genetics, v.119, p.1143-1153, 2009. Available from: <Available from: https://doi.org/10.1007/s00122-009-1116-0 >. Accessed: Dec. 08, 2024. doi: 10.1007/s00122-009-1116-0.
» https://doi.org/10.1007/s00122-009-1116-0.» https://doi.org/10.1007/s00122-009-1116-0 -
ODONG, T. L. et al. Determination of genetic structure of germplasm collections: are traditional hierarchical clustering methods appropriate for molecular marker data?. Theoretical And Applied Genetics, v.123, n.2, p.195-205, 2011. Available from: <Available from: https://doi.org/10.1007/s00122-011-1576-x >. Accessed: Dec. 19, 2024. doi: 10.1007/s00122-011-1576-x.
» https://doi.org/10.1007/s00122-011-1576-x.» https://doi.org/10.1007/s00122-011-1576-x -
POLAND, J.; RIFE, T. Genotyping-by-sequencing for plant breeding and genetics. Plant Genome, v.5 n.3, p.92-102, 2012. Available from: <Available from: https://doi.org/10.3835/plantgenome2012.05.0005 >. Accessed: Sept. 22, 2025. doi: 10.3835/plantgenome2012.05.0005.
» https://doi.org/10.3835/plantgenome2012.05.0005.» https://doi.org/10.3835/plantgenome2012.05.0005 -
POWELL, W. et al. Polymorphism revealed by simple sequence repeats. Trends in Plant Science, v.1, n.7, p.215-222, 1996. Available from: <Available from: https://doi.org/10.1016/1360-1385(96)86898-1 >. Accessed: Sept. 22, 2025. doi: 10.1016/1360-1385(96)86898-1.
» https://doi.org/10.1016/1360-1385(96)86898-1.» https://doi.org/10.1016/1360-1385(96)86898-1 -
PROHENS, J. et al. Morphological and molecular variation in a collection of eggplants from a secondary center of diversity: implications for conservation and breeding. Journal of the American Society for Horticultural Science, v.130, p.54-63, 2005. Available from: <Available from: https://doi.org/10.21273/JASHS.130.1.54 >. Accessed: Oct. 17, 2024. doi: 10.21273/JASHS.130.1.54.
» https://doi.org/10.21273/JASHS.130.1.54.» https://doi.org/10.21273/JASHS.130.1.54 -
SEMAGN, K. et al. An overview of molecular marker methods for plants. African Journal of Biotechnology, v.5 n.25, p.2540-2568, 2006. Available from: <Available from: http://rbca.africarice.org› ajb5.25.2540-2568.pdf >. Accessed: Sept. 22, 2025.
» http://rbca.africarice.org› ajb5.25.2540-2568.pdf -
SINGH, A. K. et al. Genetic diversity within the genus Solanum (Solanaceae) as revealed by RAPD markers. Current Science, v.90 n.2, p.357-364, 2006. Available from: <Available from: https://www.jstor.org/stable/24089120 >. Accessed: Dec. 12, 2024.
» https://www.jstor.org/stable/24089120 -
SONAH, H. et al. An improved genotyping by sequencing (GBS) approach offering increased versatility and efficiency of SNP discovery and genotyping. PLoS ONE, v.8 n.1, p.e54603, 2013. Available from: <Available from: https://doi.org/10.1371/journal.pone.0054603 >. Accessed: Sept. 22, 2025. doi: 10.1371/journal.pone.0054603.
» https://doi.org/10.1371/journal.pone.0054603.» https://doi.org/10.1371/journal.pone.0054603 -
TAHER, D. et al. World Vegetable Center eggplant collection: origin, composition, seed dissemination and utilization in breeding. Frontiers in Plant Science, v.8, p.1484, 2017. Available from: <Available from: https://doi.org/10.3389/fpls.2017.01484 >. Accessed: Nov. 10, 2024. doi: 10.3389/fpls.2017.01484.
» https://doi.org/10.3389/fpls.2017.01484.» https://doi.org/10.3389/fpls.2017.01484 -
TANKSLEY, S. D.; MCCOUCH, S. R. Seed banks and molecular maps: unlocking genetic potential from the wild. Science, v.277 n.5329, p.1063-1066, 1997. Available from: <Available from: https://doi.org/10.1126/science.277.5329.1063 >. Accessed: Sept. 22, 2025. doi: 10.1126/science.277.5329.1063.
» https://doi.org/10.1126/science.277.5329.1063.» https://doi.org/10.1126/science.277.5329.1063 -
TIWARI, S. K. et al. Molecular characterization of brinjal (Solanum melongena L.) cultivars using RAPD and ISSR markers. Journal of Plant Biochemistry and Biotechnology, v.18, n.2, p.189-195, 2009. Available from: <Available from: https://doi.org/10.1007/BF03263318 >. Accessed: Oct. 15, 2024. doi: 10.1007/BF03263318.
» https://doi.org/10.1007/BF03263318.» https://doi.org/10.1007/BF03263318 -
TUIK, Turkish Statistical Institute, 2023. Available from: <Available from: https://www.tuik.gov.tr >. Accessed: Oct. 22, 2024.
» https://www.tuik.gov.tr -
TUMBILEN, Y. et al. Genetic diversity in Turkish eggplant (Solanum melongena) varieties as determined by morphological and molecular analyses. International Research Journal of Biotechnology, v.2 n.1, p.16-25, 2011. Available from: <Available from: https://api.semanticscholar.org/CorpusID:46672649 >. Accessed: Dec. 25, 2024.
» https://api.semanticscholar.org/CorpusID:46672649 -
VEGMARKS, A DNA marker database for vegetables. 2021. Available from: <Available from: https://vegmarks.nivot.affrc.go.jp/VegMarks/app/marker >. Accessed: Dec. 10, 2024.
» https://vegmarks.nivot.affrc.go.jp/VegMarks/app/marker -
VILANOVA, S. et al. Genetic diversity and relationships in local varieties of eggplant from different cultivar groups as assessed by genomic SSR markers. Notulae Botanicae Horti Agrobotanici Cluj-Napoca, v.42, p.59, 2014. Available from: <Available from: https://doi.org/10.15835/nbha4219414 >. Accessed: Nov. 10, 2024. doi: 10.15835/nbha4219414.
» https://doi.org/10.15835/nbha4219414.» https://doi.org/10.15835/nbha4219414 -
YORGANCILAR, M. et al. The usage of molecular markers in plant breeding. Journal of Bahri Dagdas Crop Research, v.4, n.2, p.1-12, 2015. Available from: <Available from: https://dergipark.org.tr/tr/download/article-file/253693 >. Accessed: Nov. 05, 2024.
» https://dergipark.org.tr/tr/download/article-file/253693 -
YU, N. et al. Genetic changes in F1 hybrids of the genetically divergent Solanum L., Solanum melongena L.× Solanum aethiopicum L Plant Growth Regulation, v.99 n.3, p.539-552, 2023. Available from: <Available from: https://doi.org/10.1007/s10725-022-00926-6 >. Accessed: Sept. 22, 2025. doi: 10.1007/s10725-022-00926-6.
» https://doi.org/10.1007/s10725-022-00926-6.» https://doi.org/10.1007/s10725-022-00926-6 -
ZHANG, Y. et al. Genetic variation, population structure and linkage disequilibrium in Switchgrass with ISSR, SCoT and EST-SSR markers. Hereditas, v.153, p.4, 2016. Available from: <Available from: https://doi.org/10.1186/s41065-016-0007-z >. Accessed: Nov. 6, 2024. doi: 10.1186/s41065-016-0007-z.
» https://doi.org/10.1186/s41065-016-0007-z.» https://doi.org/10.1186/s41065-016-0007-z -
ZHOU, R. et al. Genetic diversity of cultivated and wild tomatoes revealed by morphological traits and SSR markers. Genetics and Molecular Research, v.14, n.4, p.13868-13879, 2015. Available from: <Available from: https://doi.org/10.4238/2015.October.29.7 >. Accessed: Dec. 01, 2024. doi: 10.4238/2015.October.29.7.
» https://doi.org/10.4238/2015.October.29.7.» https://doi.org/10.4238/2015.October.29.7
Edited by
-
ASSOCIATE EDITOR:
Leandro Souza da Silva (0000-0002-1636-6643)
-
SCIENTIFIC EDITOR:
Carla Andréa Delatorre (0000-0002-1644-3813)
All data generated or analyzed during this study are included in this published.