| Gölaç et al.(12) |
Acoustic Analysis |
Acoustic Parameters Evaluated: |
| Aerodynamic Measurement: MPT |
Average Fundamental Frequency (F0) |
| Self-Perception Questionnaires: Voice Handicap Index-10 (VHI-10), Voice-Related Quality of Life (V-RQOL) |
Local Jitter |
| Auditory-Perceptual Evaluation: CAPE-V |
Local Shimmer |
|
Harmonic-to-Noise Ratio (HNR) |
| Cepstral Peak Prominence (CPP). |
| Methods and Tools Used: |
| Software: Acoustic analyses were performed using Praat software (version 6.0.17). |
| Voice Samples: collected through sustained phonation of the vowel /a/ and linked speech (third sentence of the CAPE-V protocol in Turkish). |
| Analyzed Segment: For perturbation measures (jitter, shimmer, and HNR), the middle segment of the vowel /a/ in the most stable part of phonation was used. For the CPP, the third sentence of the CAPE-V protocol was analyzed. |
| Korkmaz and Güven( 21) |
Acoustic analysis |
Fundamental Frequency (F0): The fundamental frequency, or pitch, was measured to verify the variation in voice tone, since unilateral paralysis can affect the symmetry of vocal cord movement and, consequently, the frequency of vocal emission. |
| Voice Handicap Index (VHI) assessment |
Jitter: refers to the variation in the fundamental frequency of the voice and can be used to assess the stability of vocal tone. Paralysis can cause fluctuations in tone, reflecting vocal irregularity. |
| Laryngoscopy: Direct laryngoscopy was performed to examine the vocal cords and identify unilateral paralysis. |
Shimmer: measures the variation in sound amplitude, indicating the regularity of vocal intensity. Vocal cord paralysis can affect the consistency of vocal production, altering the shimmer. |
| Aerodynamic measurement: MPT, using the s/z ratio. |
Vocal Quality Index: Parameters such as sound regularity (measured by jitter and shimmer) are frequently used to assess vocal quality. In the case of vocal paralysis, these parameters may be altered, reflecting compromised vocal quality. |
| Saki et al.(22) |
Auditory-Perceptual Evaluation: GRBAS |
Acoustic analysis was performed to evaluate parameters such as fundamental frequency (F0), intensity, and disturbances in voice frequency and amplitude, providing a more objective assessment of the alterations. |
| Bartl-Pokorny et al.(23) |
This study analyzed recordings of sustained vowels (/i:/, /e:/, /o:/, /u:/, and /a:/) produced by German-speaking participants. The research focused on 88 acoustic characteristics extracted from these recordings, without specifying traditional vocal assessment protocols such as maximum phonation duration or vocal intensity. Statistical analysis was performed using the Mann-Whitney U test and effect size calculations to identify significant differences between the participant groups. |
The acoustic analysis included the following parameters: |
| Fundamental frequency (F0): The average frequency of the voice, which can reflect changes in vocal control and vocal cord tension. |
| Harmonic-to-noise ratio (HNR): A measure that indicates the clarity of the voice. The lower the HNR ratio, the greater the presence of noise in the voice. |
| Mel's cepstral coefficients (MFCC): Spectral characteristics that help describe the acoustic content of the voice in a way that simulates human auditory perception. |
| Spectral slope: Reflects how energy is distributed across the frequencies of the vocal sound. |
| Vowel duration and number of sound segments per second: Indicators of the rhythm and fluency of vocal production. |
| Khoddami et al.(13) |
Voice Handicap Index (VHI): This index is a widely used tool to assess the impact of vocal dysfunction on individuals' quality of life. It helps measure the degree of discomfort and limitation that vocal problems cause in patients' daily lives. |
It does not mention whether it conducted acoustic analyses of the participants' voices. |
| Health-related quality of life assessment: Although the study does not provide specific details on the exact protocol used to measure quality of life, it is mentioned that quality of life assessment was an important part of the analysis, comparing patients recovered from COVID-19 with healthy subjects. |
| Saki et al.(29) |
Acoustic Evaluation of the Voice |
Evaluated Parameters: Jitter (%), Shimmer (%), MPT (seconds), HNR (dB). |
| Auditory-perceptual evaluation: CAPE-V |
Results: |
| Self-perception questionnaire: Vocal Fatigue Index |
Patients with COVID-19 presented higher Jitter, Shimmer, and lower HNR and MPT compared to the control group. |
| Prolonged voice use (after reading the text) exacerbated vocal irregularities in patients with COVID-19. |
| Correlations: |
| The acoustic parameters (Jitter, Shimmer, HNR) correlated significantly with vocal fatigue (voice tiredness and physical discomfort). |
| Aghadoost et al.(27) |
Auditory-perceptual evaluation: CAPE-V |
Frequency Disturbance (Jitter): Higher Fundamental Frequency (F0 high) |
| Self-perception questionnaire: Dysphonia Severity Index (DSI) |
| Tohidast et al.(24) |
Auditory-perceptual evaluation: GRBAS |
Not performed |
| Self-perception questionnaire: VTD (vocal tract discomfort) |
| Dassie-Leite et al.(25) |
Vocal Signs and Symptoms list (SSL), which investigates the presence or absence of 14 vocal signs or symptoms. A translation of the instrument into Brazilian Portuguese was used. Each symptom was addressed in relation to three distinct moments: before, during, and after COVID-19. |
Not performed |
| Asiaee et al.(19) |
Acoustic analysis |
A Praat script was used to extract the local values of jitter, shimmer, MPT, and the number of voice breaks. Measurements were performed using the default settings in Praat. Fundamental frequency, CPP, HNRs, and (H1-H2) were automatically extracted using VoiceSauce, a freeware for voice analysis. |
| The F0 measurement was performed using the standard VoiceSauce algorithm, namely STRAIGHT. In VoiceSauce, CPP is calculated using the algorithm proposed by Hillenbrand et al. HNR values are measured using a variable window of five pitch periods by Krom's algorithm. HNR05, HNR15, HNR25, and HNR35 measure HNR from 0-500 Hz, 0-1500 Hz, 0-2500 Hz, and 0-3500 Hz, respectively. This study used HNR35 (hereinafter HNR). |
| Finally, H1*-H2* was used for evaluation (H1-H2), which is H1-H2 corrected for the formant effect based on the algorithm proposed by Iseli et al. and used in VoiceSauce. |
| Helding et al.(9) |
Review of studies using acoustic and perceptual methods |
Not applicable |
| Aghaz et al.(11) |
The contexts do not provide specific vocal assessment protocols used in the studies. |
The contexts do not provide details about any acoustic analysis performed.. |
| Azzam et al.(26) |
Includes auditory-perceptual evaluation of voice and videolaryngoscopy examination. |
Not mentioned in the contexts provided. |
| Bueno et al.(10) |
Voice Handicap Index 10 (VHI-10) and the Voice-Related Quality of Life (VQOL) and MPT protocol |
Not specified in the contexts provided. |
| Shanem et al.(28) |
The Voice Handicap Index (VHI) was used to assess voice concerns. |
Not performed |
| Kuć and Michta(30) |
It included recordings of spontaneous speech, repetition of words and phrases, a monologue, and automated word sequences; perceptual assessment was conducted using the GRBAS scale. |
Not specified in the contexts provided. |
| Berti et al.(32) |
The recordings were made using SPIRA software based on three verbal tasks: sustained production of the vowel /a/, reading a sentence, and producing a rhyme. |
Conducted using PRAAT software, focusing on various acoustic parameters. |
| Eltelety and Nassar(20) |
A follow-up transcervical laryngeal ultrasound was performed to assess vocal fold mobility. |
Not specified |
| Rahul et al.(31) |
Perceptual assessment, self-reported results using the Voice Handicap Index (VHI-10), and acoustic analysis. |
The study revealed significant differences in acoustic parameters between the experimental and control groups. |

 COVID-19-related voice disorders: a scoping review
 Thumbnail
 Thumbnail
 Thumbnail
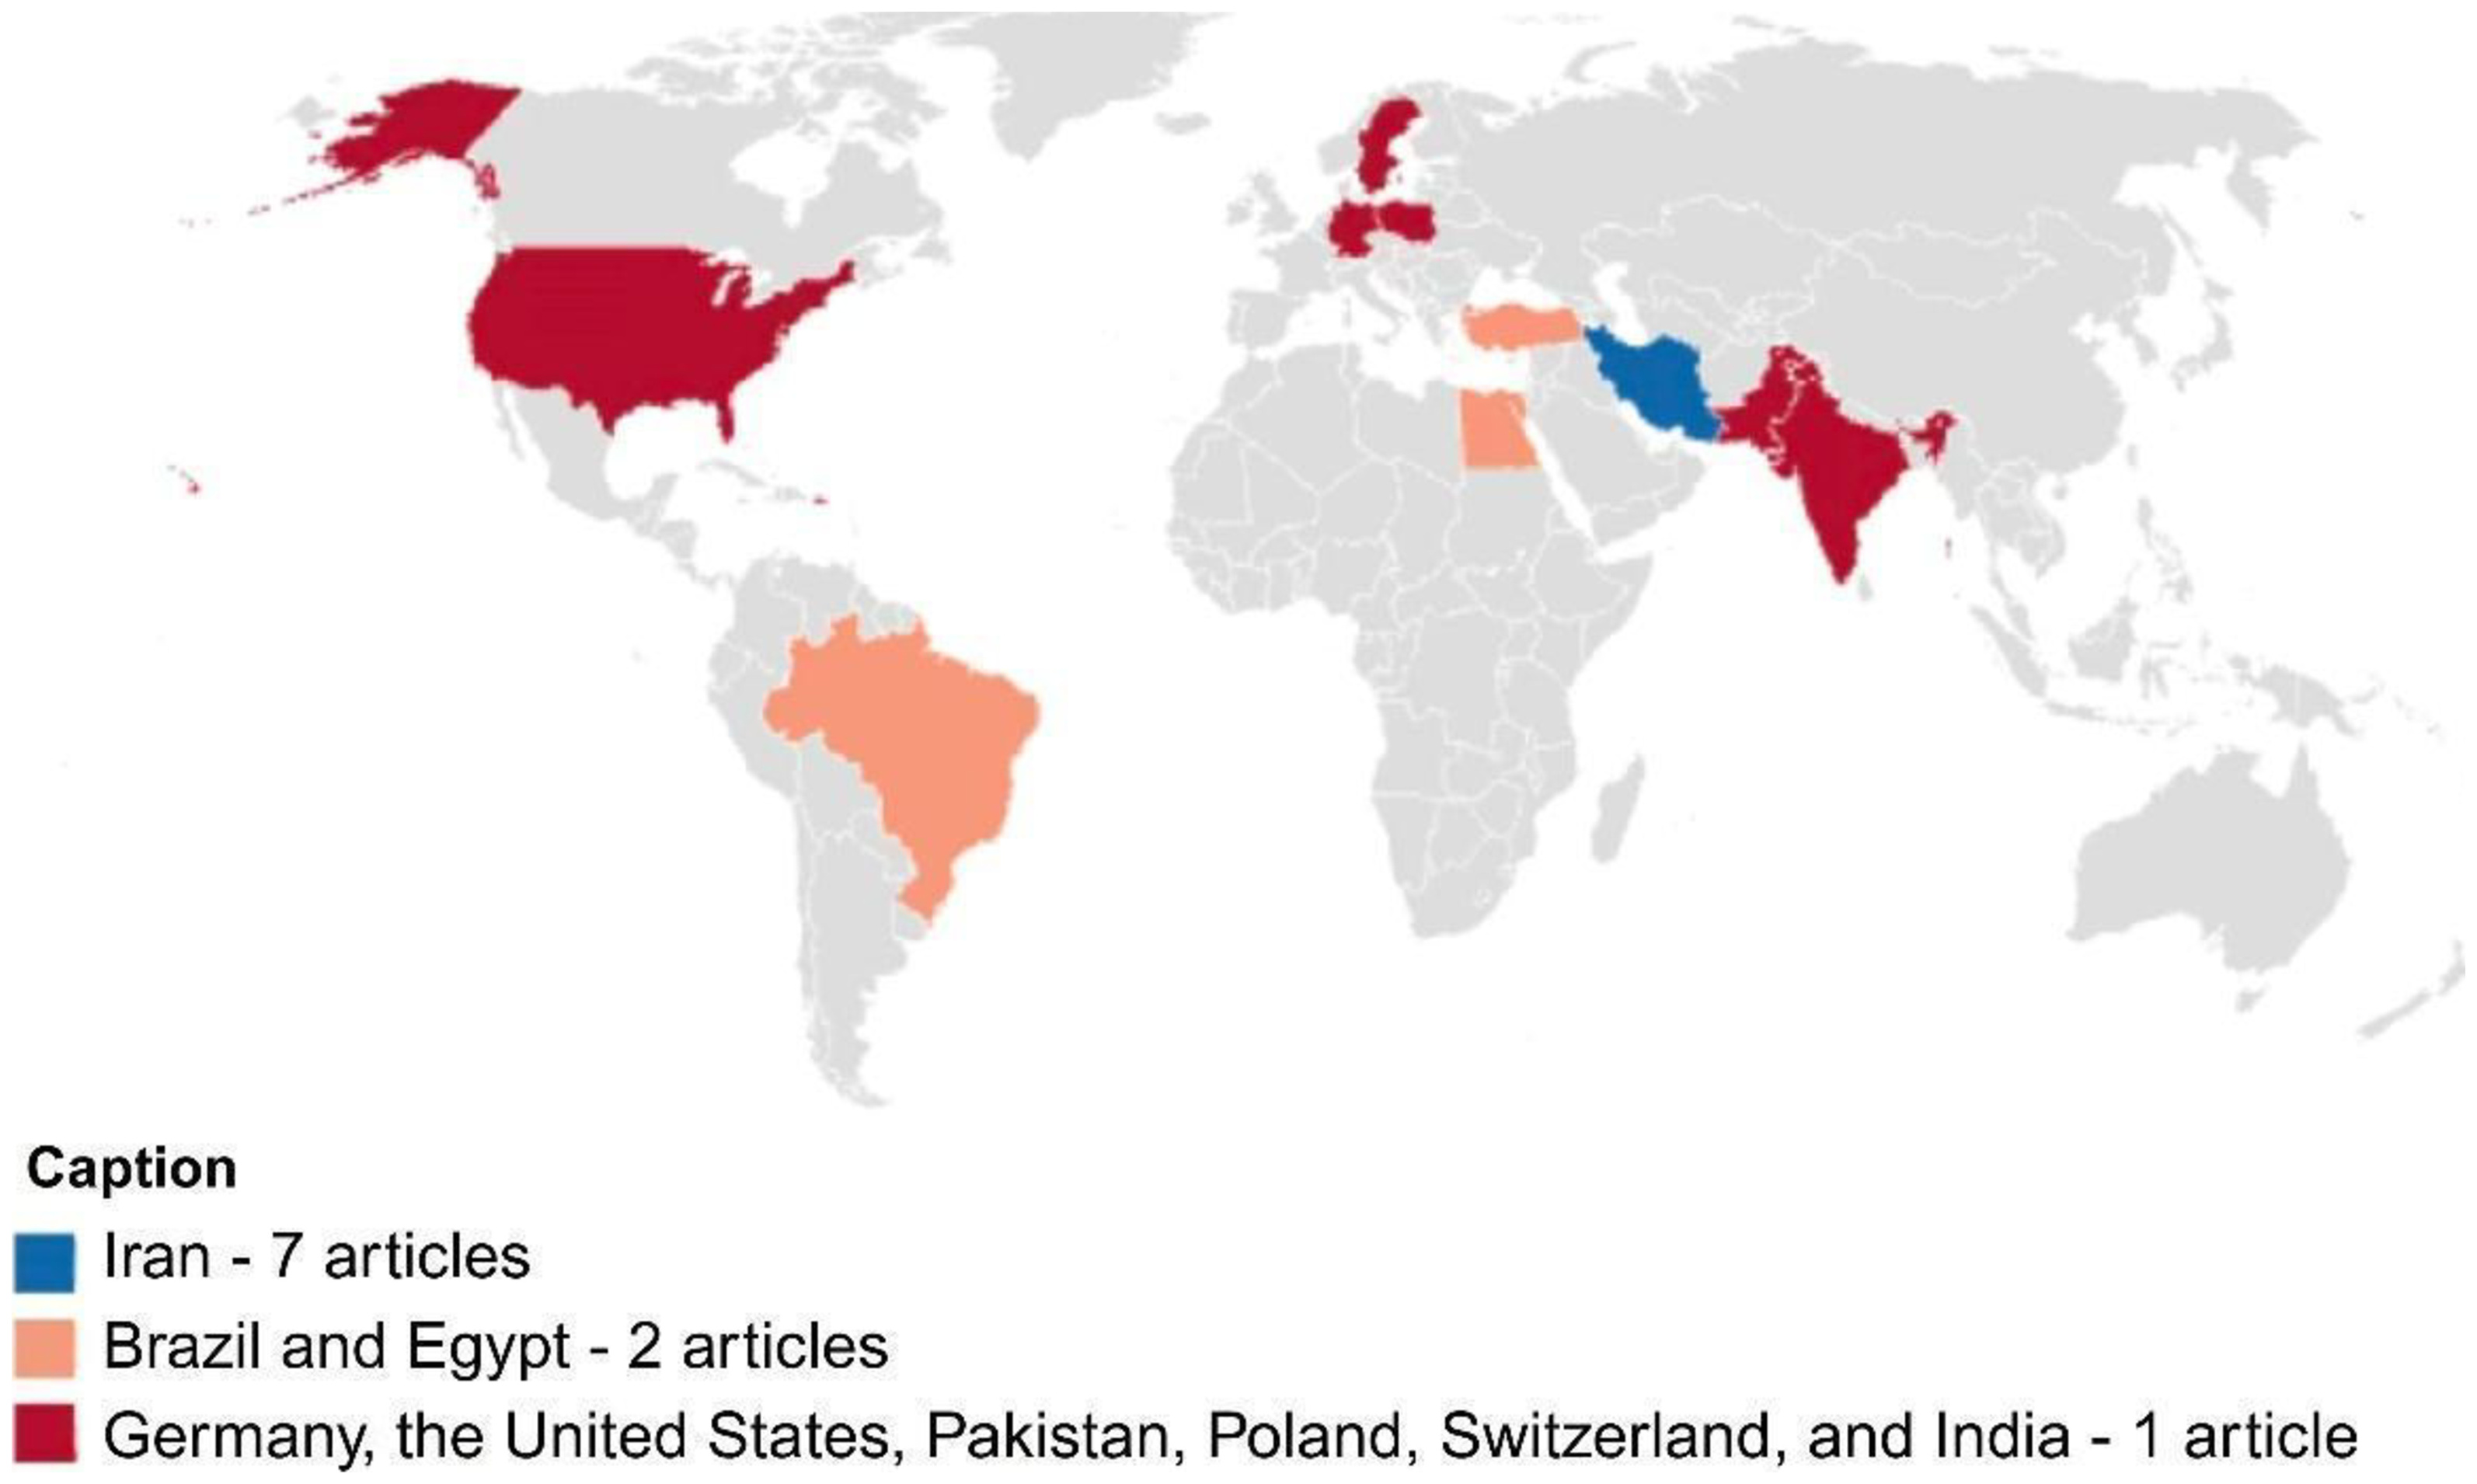 Caption: World map highlighting the nationality of the articles included in the scoping review. Each country is represented by a distinct color, according to the frequency of publications: Blue (Iran): 7 articles. Dark orange (Brazil and Egypt): 2 articles each. Red (Germany, the United States, Pakistan, Poland, Switzerland, and India): 1 article each
 Caption: The word cloud shows the main vocal symptoms reported in the analyzed studies, such as dysphonia, hoarseness, vocal fatigue, reduced maximum phonation time (MPT), and vocal fold paralysis
 Caption: The figure illustrates the most used questionnaires and protocols for assessing voice-related quality of life: VHI-10 (Voice Handicap Index-10), V-RQOL (Voice-Related Quality of Life), VFI (Vocal Fatigue Index), and VTD (Vocal Tract Discomfort Scale)