
 UAV-based spectral images using remote sensing and YOLOv8 in Eucalyptus saligna Sm. inventory
ABSTRACT
Accurate and low-cost tree inventories in forest plantations are essential for an effective production management. Stimulated by recent advancements in Unmanned Aerial Vehicle (UAV) imagery coupled with artificial intelligence, and by the interest in developing models capable of supporting decision-making on silvicultural and forest management, this study aimed to evaluate the performance of different vegetation indices in detecting Eucaliptus saligna individuals by using an improved deep learning model. The tree-individual detection model was created using the YOLOv8n algorithm using UAV RGB images and vegetation indices (VI) generated from the multispectral sensor onboard the UAV. Nine VIs were selected for training (65%) and testing (35%) the models. The proposed framework demonstrated that the MPRI, PSRI, and NDVI indices achieved an F1 score of 0.98 and a precision of 0.97 for detecting E. saligna individual trees six months after planting. Our study demonstrates the robustness of the proposed framework and recommends the application of the MPRI index in individual tree detection due to its efficient performance, cost-effectiveness, and simplicity, as it only utilizes regions of the visible spectrum.
Keywords
Artificial intelligence; Precision forestry; Individual tree detection
RESUMO
Inventários de árvores precisos e de baixo custo em plantações florestais são essenciais para o gerenciamento eficaz da produção. Estimulado por avanços recentes em imagens de Veículos Aéreos Não Tripulados (VANT) juntamente com inteligência artificial, e pelo interesse em desenvolver modelos capazes de apoiar a tomada de decisões sobre manejo silvicultural e florestal, este estudo teve como objetivo avaliar o desempenho de diferentes índices de vegetação na detecção de indivíduos de Eucaliptus saligna usando uma abordagem de modelo de aprendizado profundo aprimorado. O modelo de detecção de indivíduos de árvores foi criado usando o algoritmo YOLOv8n usando imagens RGB de VANT e índices de vegetação (IV) gerados pelo sensor multiespectral a bordo do VANT. Nove IVs foram selecionados para treinamento (65%) e teste (35%) dos modelos. A estrutura proposta demonstrou que os índices MPRI, PSRI e NDVI alcançaram uma pontuação F1 de 0,98 e precisão de 0,97 na detecção de árvores individuais de E. saligna seis meses após o plantio. Nosso estudo demonstra a robustez da estrutura proposta e recomenda a aplicação do índice MPRI na detecção de árvores individuais devido ao seu desempenho eficiente, baixo custo e simplicidade, pois utiliza apenas regiões do espectro visível.
Palavras-chave
Inteligência artificial; Silvicultura de precisão; Detecção individual de árvores
1 INTRODUCTION
Planted forests play a crucial role in the ecosystem conservation and the sustainable use of natural resources. They provide raw materials for industries such as pulp and paper, panels and plywood, charcoal, biofuels, and others. Additionally, they help preserve biodiversity, regulate climate, protect soil, and preserve water resources. The total global area of planted forests is approximately 290 million hectares (FAO, 2020), Eucalyptus sp. one of the most productive forest crops in the world (Elli et al., 2020).
Eucalyptus tree plantations in Brazil are the most productive ones on a global scale. It is the result of research in several important areas, such as nutrition, genetic improvement, climatology, combined with the high technology used in silvicultural treatments and the favorable climate (Duarte & Ribeiro, 2023; Faria et al., 2019). The average productivity of eucalyptus plantations in the country reaches 41 cubic meters per hectare (Vahl de Paula et al., 2020), covering over 7.6 million hectares planted, scattered across various regions of Brazil (IBÁ, 2023).
Silvicultural practices following the establishment of a forest stand typically involve manually counting individual trees through field surveys. This evaluation helps assess plant survival, determining aspects such as planting operation quality and the need for individual replacements. Additionally, in older stands, individual plants counting can provide important insights regarding the productive potential of the forest (Silva et al., 2023). However, these traditional manual survey techniques are primarily limited by their small spatial coverage and high labor, time and costs demanded.
In this regard, remote sensing (RS) technologies have the potential to complement ground surveys by expanding spatial coverage and providing real-time evaluation of planting efficiency. The use of UAV-based remote sensing for precision forestry allows analysis of the planted areas, offering valuable tools for forest management. UAV-based remote sensing offers advantages such as high spatial resolution, rapid data collection, minimal cloud and shadow interference, and cost reduction compared to commercial high-resolution satellite imagery (Eugenio et al., 2020).
In the recent years, UAV has been employed as an efficient tool to gather extensive information about forest plantations. Coupling UAV with RGB, multispectral, hyperspectral, thermal sensors, and other sensors like LiDAR has enabled researchers to estimate important parameters such as height, canopy coverage, tree diameter, and vegetation indices (Abdollahnejad & Panagiotidis, 2020; Kopacková-Strnadová et al., 2021; Malabad et al., 2022; Zhuo et al., 2022).
Advancements in UAV-remote sensing combined with Machine Learning (ML) have expanded the capability to scout crops for generating productivity estimates, assessing plant nutritional status, detecting pests and diseases, among other biophysical and structural parameters (Iost Filho et al., 2020; Wang et al., 2019; Zheng et al., 2018; Lafetá et al., 2018). Typically, traditional ML methods like Random Forests (RF) and Support Vector Machine (SVM) have been used in forest crops. However, models based on deep learning (DL), particularly Convolutional Neural Networks (CNN), have demonstrated superiority compared to these traditional methods across various applications (Kattenborn et al., 2021).
The primary advantage of CNN is its extremely high classification accuracy, described as one of the best DL algorithms for understanding image content, with excellent performance in segmentation, classification, detection, and data retrieval tasks (Kattenborn et al., 2021). For instance, Sandric et al. (2022) applied UAV-RGB images and the Mask R-CNN algorithm to detect five tree species. The model was used to detect and map each individual tree's morphometric properties and assess tree health based on Vegetation Index (VI) VARI and GLI. The overall accuracy of tree detection was over 70%, with the lowest value of 74% for plum trees and the highest value of 94% for almond trees. Chen et al. (2023) applied three DL algorithms (YOLOv5, Faster-RCNN, CenterNet) developed for object detection to identify trees with pine wilt disease in RGB images, among other approaches for tree detection as pest and weed detection (Jemaa et al., 2023; Zhang et al., 2023; Guo et al., 2023).
However, in tasks such as counting Eucalyptus seedlings in early stages of development, CNNs have been underscore. Therefore, considering the interest in developing models capable of supporting decision-making on forest measures and management of planted areas, our study aimed to evaluate the performance of different VI derived from UAV imagery in detecting E. saligna individuals using an enhanced DL model approach. Our hypothesis is that certain spectral indices can identify E. saligna trees in their early developmental stages, offering a valuable tool for forest scouting.
2 MATERIALS AND METHODS
2.1 Description of the study area
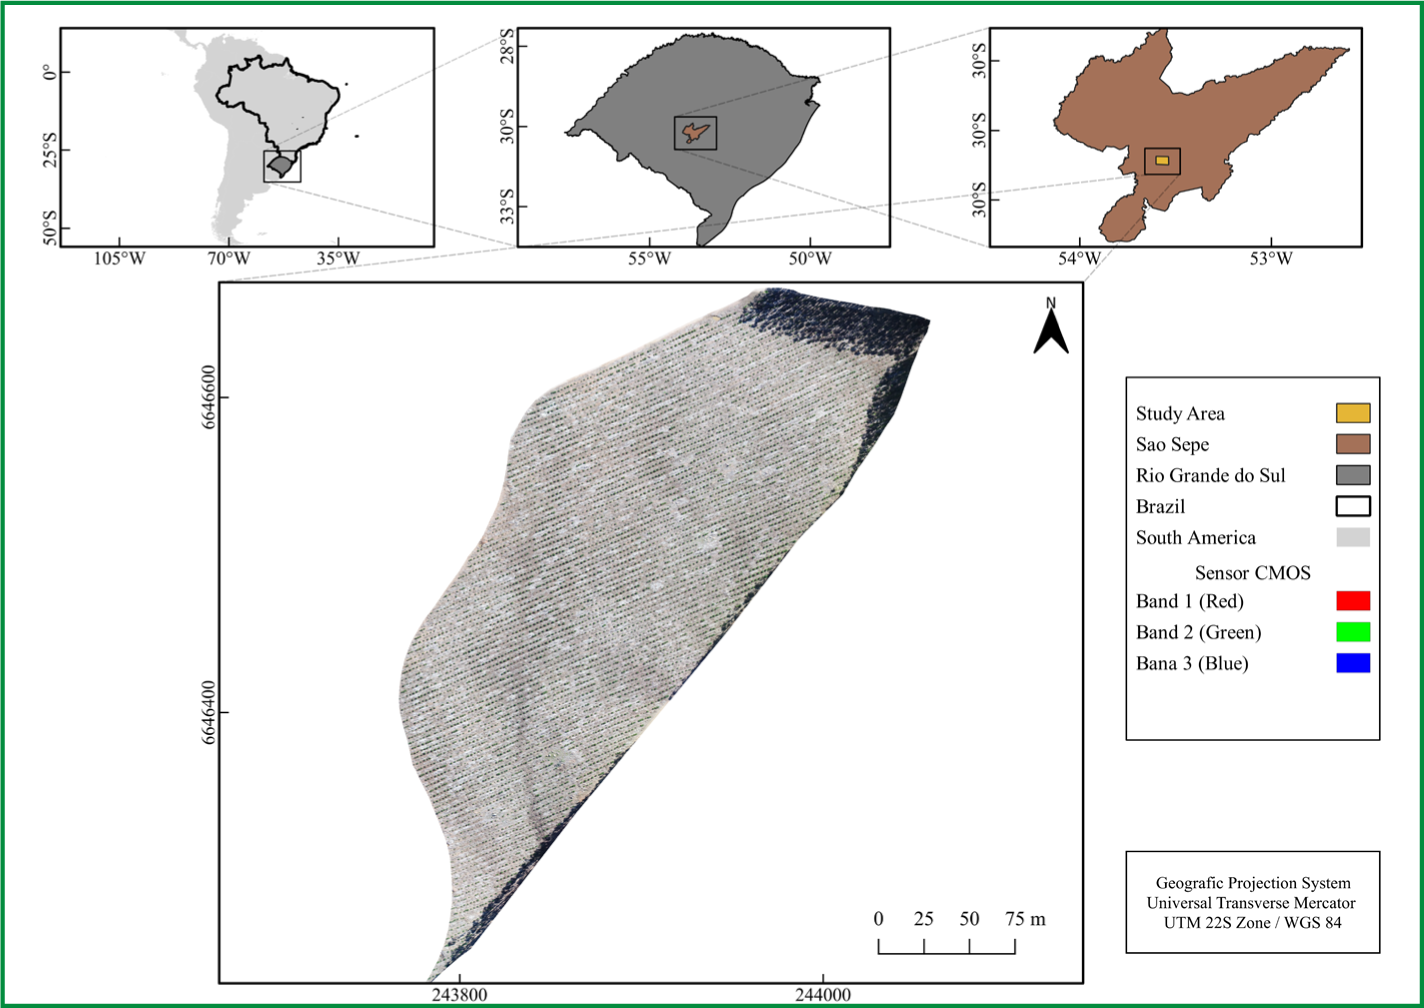
The study was conducted in a commercial plantation owned by Compañía Manufacturera de Papeles y Cartones Ltda. (CMPC), located in the municipality of Sao Sepé, in the state of Rio Grande do Sul, southern region of Brazil (Figure 1). The plot covers an area of 5.49 hectares and is dedicated to the cultivation of clonal seedlings of Eucalyptus saligna Smith, approximately six months old at the time of data acquisition. The seedlings were planted on March 24th, 2023, representing an area under forest reform.

The climate of the region is classified as humid subtropical (Cfa) according the Köppen classification system (Alvares et al., 2013), with an average annual temperature exceeding 18°C, and average rainfall reaching around 1650 mm per year (ANA, 2006). The soils are classified as Aluminic Red Argissolos (PVa) (EMBRAPA, 2018).
2.2 UAV Surveys
High-resolution aerial images were acquired using a Phantom 4 Advanced Plus® UAV platform equipped with a 19-megapixel CMOS sensor, which captures images in the spectral bands of visible light (Red, Green, and Blue - RGB). The UAV features a mechanical shutter and an 8.8 mm focal length (Shenzen DJI Sciences and Technologies (DJI), Shenzhen, China). Attached to the UAV was the Red Edge-MX® multispectral sensor (Mica Sense, 2015), integrated with the Downwelling Light Sensor (DLS2) radiometric correction system (Mica Sense, 2015).
The Red Edge-MX® sensor comprises five capture sensors and five integrated lenses in one body, whose specifications are described in Table 1. Thus, the images captured by this camera are composed of overlapping images so that aerial triangulation can be applied to estimate the image orientation parameter. Auxiliary data for radiometric correction and orthorectification (irradiance, sensor coordinates, and position) were synchronously captured for each image.
The aerial survey work was carried out on September 15th, 2023, with image capture starting at 10 am (Brazil Time; UTC-3). The drone flew at an altitude of 120 meters, capturing images with 70% frontal and 75% lateral overlap between adjacent strips. We used Precision Flight software version 2.4.2 to plan the flight path and control the UAV's movement and speed. We set the Ground Sample Distance (GSD) to 3 cm for RGB image and 9 cm for multispectral images, for consistent ground sampling during flight. A total of 61 RGB images were captured, and multispectral images were acquired simultaneously.
2.3 UAV Image Processing
The images were processed using Agisoft Metashape software (Agisoft, St. Petersburg, Russia) to generate orthoimages get from the two sensors used. For RGB processing, three main steps were employed: image alignment, point cloud densification, and orthoimage generation.
To align the images, an Automatic Aerial Triangulation (AAT) algorithm refined the exterior orientation of all 61 images to calculate direct georeferencing for each. Subsequently, Bundle Block Adjustment (BBA) automatically adjusted the relative 3D coordinate system using measured distances between the points. For point cloud densification, X, Y, Z positions, and color information were computed based on Automatic Tie Points (ATP) established during initial processing. In orthoimage generation, digital surface models (DSM) were generated and used as references for creating orthomosaics. Processing multispectral sensor images followed the same previous steps, with radiometric calibration performed before alignment, using a control panel and DSL2 sensor. Agisoft Metashape was also utilized to compute nine VI (Table 2) from the five orthomosaics generated by the multispectral sensor bands.
2.3.1 Vegetation Indices (VIs) calculation
Due to the spectral resolution of the camera used in this study, we chose to work with nine VIs which are correlated with plant biomass, vigor, chlorophyll/carotenoid content, water content, and greenness, as follows: Normalized Difference Vegetation Index (NDVI); Red-edge Normalized Difference Vegetation Index (NDRE); Modified Photochemical Reflectance Index (MPRI) (VIs used for approximations in biomass and photosynthetically active radiation); Canopy Chlorophyll Content Index (CCCI); Chlorophyll Index Red Edge (ClRedEdge); Chlorophyll Index Green (Clgreen); Chlorophyll vegetation index (CVI) (VIs for chlorophyll content estimation); Plant Senescence Reflectance Index (PSRI) (VI for carotenoids content estimation); Normalized Difference Water Index (NDWE) (VI for water and phytomass content estimation). In Table 2, the nomenclature, mathematical expression, and references of the Vis are described.
2.4 Data Preparation
Object detection using convolutional neural networks requires a large amount of labeled data as a prerequisite (Chen et al. 2023). Our dataset (VIs and RGB orthophotos) is derived from UAV images and has very high spatial resolution (a mean spatial resolution of 6 cm per pixel), making it highly suitable for manual visual labeling. To prepare the data for object detection, orthomosaics were subdivided into segments of dimensions 160 x 160 pixels using a regular grid. In total, 78 segments were created and systematically distributed to ensure representative coverage of E. saligna individuals through the entire mosaic area (Figure 2).

Example of distribution of segments created for training and testing the model in RGB composition
This approach aims to ensure that all present variations are adequately propagated for use as input to the YOLO detection network. After that, we performed manual annotation for patches, which involves manually locating our objects of interest (E. saligna) through bounding boxes using the VGG Image Annotator open-source software tool based on Python (Dutta & Zisserman, 2019). Subsequently, the segments created for the different datasets (VIs and RGB) were trained separately. The dataset was split, with 65% allocated for training and 35% for testing the model. Due to the small amount of filtered training data, the model can be easily adjusted during training. Therefore, in our study, horizontal inversion, vertical inversion, random rotation, and random cropping were used to enhance the images in the training set. The entire process of dataset preparation, training, prediction, and validation was conducted in Python 3.11.15.
2.5. YOLOv8 nano Implementation
The original You Only Look Once (YOLO) network was published in 2016 (Redmon & Farhadi, 2016), and it is a one-stage object detector. Its network architecture consists of three main components: the backbone, the neck, and the head. Since it's a supervised deep learning approach, it requires a substantial amount of labeled training data to learn the task. Since the initial release of YOLO, several refined network versions have been introduced, such as YOLOv2 (Redmon & Farhadi, 2018), YOLOv3 (Bochkovskiy et al., 2020), up to the latest version YOLOv8, developed by Ultralytics. As an advanced and state-of-the-art model, YOLOv8 builds upon the achievements of its predecessors, introducing new functionalities and improvements, resulting in high levels of performance, adaptability, and resource efficiency (Sikati & Nouaze, 2023).
There are five models of YOLOv8 for detection, segmentation, and classification. For this study, the YOLOv8 nano (YOLOv8n) model was selected because it has a smaller and faster network structure, suitable for training with smaller databases. YOLOv8n was pre-trained with the public COCO dataset (Lin et al., 2014), and as a backbone, improvements were made by introducing Ghost convolution modules and C2Focal modules. Additionally, a new Sig-IoU loss function for bounding box regression is used to replace the original CIoU loss (Ling et al. 2023). More detailed descriptions of YOLOv8 can be found at: https://docs.ultralytics.com/.
For the tree detection stage of E. saligna, we used the open-source software LabelImg (Tzutalin, 2015), and the model hyperparameters were adjusted to 1000 epochs, batch size of 20, and predictions parameterized with a confidence of 0.5 and an Intersection over Union (IoU) threshold of 0.5.
2.6 Evaluation Metrics
To evaluate the performance of our framework for detecting E. saligna trees, we used the following metrics:
Precision – P, in Equation (1), measures the total correct detections relative to the total (correct and incorrect detections):
Recall – R, in Equation (2), measures the total correct detections relative to the total of detected and undetected objects:
F1-Score, in Equation (3), which measures the balance between precision and recall; a high F1 value indicates high precision and recall, while a low F1 value indicates an imbalance between precision and recall:
In equations 1-3, Tp represents the number of true positives (i.e., trees correctly detected), Fp is the number of false positives (regions incorrectly detected as trees), and FN denotes the number of false negatives (number of missed trees). In a test image, a detection is considered correct if the overlap between the detected tree and the actual tree on the ground exceeds 50% (Jeema et al., 2023). The overlap between the detection and ground truth is calculated using the Intersection Over Union (IOU) metric. IOU = 1 indicates 100% overlap between the boxes, as shown in Equation (4):
Mean Average Precision (mAP), in Equation (5) calculates the average of the average precisions for all object classes and provides an overall model performance.
In Equation (4), B1 represents the ground truth bounding box, and B2 represents the predicted bounding box. In Equation (5), Q is the total size of the evaluation dataset, mj is the total number of true individuals in each image, and P(Rjk) the precision of the individual in the image. It's important to note that this metric does not account for false positives because detected individuals that do not exist in the ground truth frame are not counted in the equation. To enable model ranking, a scoring system was developed that normalizes metric values between 0 and 1, then sums positive metrics while penalizing error indicators in Equation (6).
where: CE = counting error in percentage values; IOU = average intersection over union in percentage values; mAP = mean average precision in percentage values; TP = True Positives in percentage values; FP = False Positives in percentage values; FN = False Negatives in percentage values; F1 Score = F1 Score metric.
2.6.1 Visual model validation metrics
Model performance evaluation was conducted by selecting four rectangular segments, each measuring 320 x 320 pixels, representing approximately 5% of the total study area. The purpose of this approach was to visually count E. saligna individuals in each segment to determine the accuracy rate of each model and obtain the necessary metrics for performance evaluation of the indices obtained. It's noteworthy that the coordinates used in the four segments were identical, eliminating any bias in the evaluations. This procedure was adopted to ensure an impartial and accurate analysis of the effectiveness of the models in identifying plants, contributing to a robust assessment of their performances.
3 RESULTS AND DISCUSSIONS
3.1 Model classification accuracy
In this study, the YOLOv8n target detection model was trained using a specifically labeled training set for individual E. saligna trees at 180 days post-planting. Subsequently, the trained target detection model was employed to analyze individual tree species across nine vegetation indices. The comparison of detection effects for the VIs and the RGB composition of the UAV is presented in Table 3, showing the final average precision (mAP). Notably, in the YOLOv8n network model, the NDVI and MPRI indices demonstrated the most effective classification and detection of E. saligna, while the RGB combination and the CVI and CCCI indices yielded the least favorable classification.
Comparison of mean average precision detection accuracy of E. saligna trees under different vegetation indices and RGB composition
3.2 Model Accuracy Evaluation
After the training phase, performance metrics were calculated from the models generated for each vegetation index and the RGB composition. The results are shown in Table 4 below. The NDVI and MPRI indices demonstrated superior performance, with individual counting errors of 1.69% and 2.33%, respectively. The true positive rate was 96% for both indices, demonstrating the accurate identification capability of the two models. Both indices showed high precision, recall, and F1 Score, underscoring their robust ability to identify individual trees. Additionally, the ranking of models based on the calculated Score emphasizes that models trained with the NDVI, MPRI, PSRI, and NDWI indices yielded the best results.
Comparison of detection accuracy indicators of E. saligna trees under YOLO v8n model detection
3.3 Model Performance Analysis
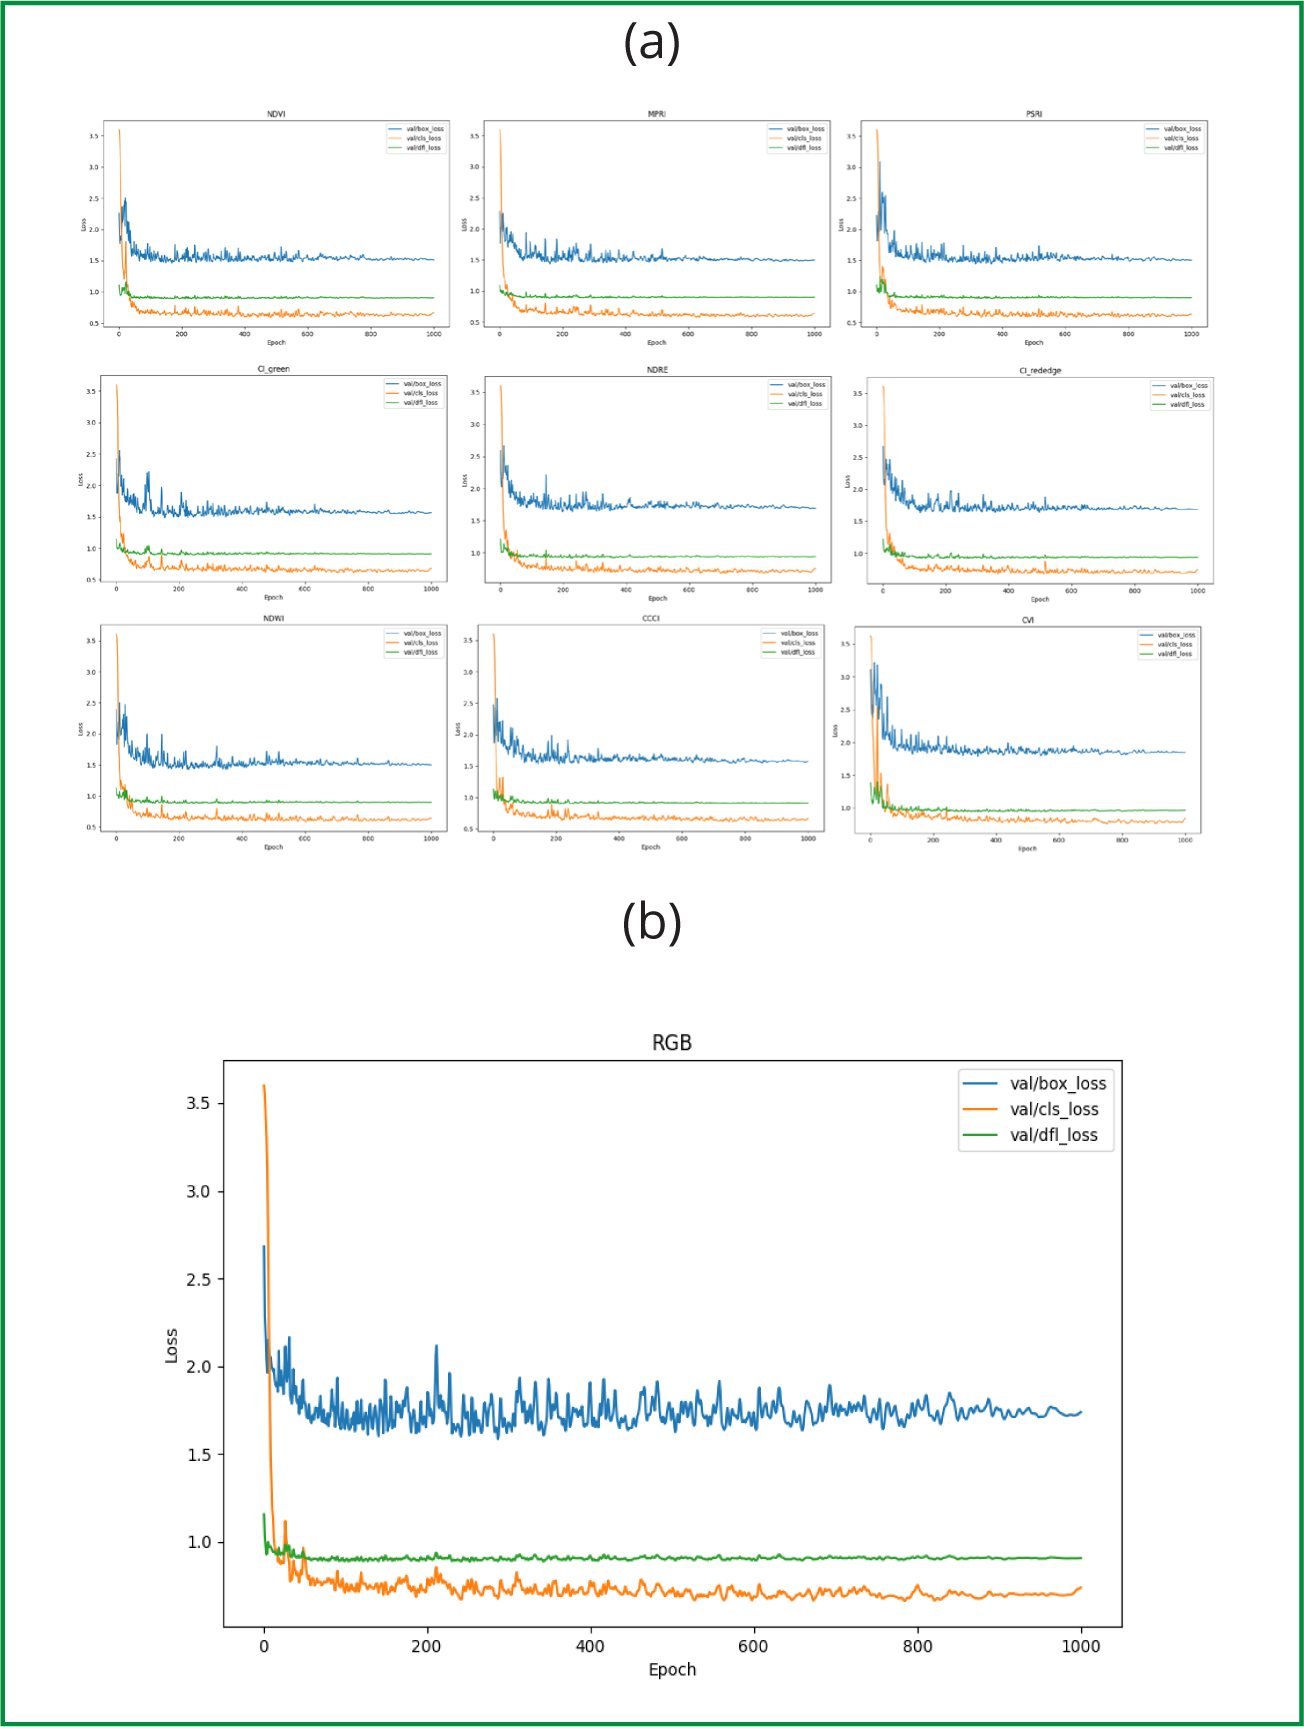
In object identification through DL, the loss function acts as an indicator that demonstrates the discrepancy between the model final prediction and the true values. This provides immediate awareness regarding training effectiveness, model stability, and the potential presence of overfitting (Ma et al. 2022; Xu et al. 2023). The model loss values for the Vis and RGB composition in this study are shown in Figure 3 (A and B). After 200 epochs, the model loss function gradually converges and stabilizes for all VIs and the RGB composition. This occurrence may be related to the learning rate settings and the model batch size. Accurately adjusting these hyperparameters is crucial to achieve the best performance during training and to avoid challenges such as sudden drops or stagnation in the loss function. Modifying these settings could, in theory, enhance the model convergence and stability throughout the training process.

Model loss curve in E. saligna trees for vegetation indices in (a) and for RGB composite in (b)
3.4 Visual model validation metrics
Visual analysis of the detection and counting of E. saligna individuals in the four segments created for the models trained from each VI and the RGB image of the UAV is shown in Figure 4. Similar to the training data, the NDVI, MPRI, and PSRI models respectively showed the best results, while models trained from the NDRE, CIRedEgde, RGB, and CVI indices encountered the greatest difficulties in detecting individuals.

Validation of detection models for E. saligna trees obtained with the YOLOv8n algorithm (Sampling in segment 1)
Remote sensing data accessibility provides various tools for forest inventory tasks in commercial plantations. The inventory, in the early tree stages of planting conducted by forestry specialists, requires improvements in high efficiency, speed, and accuracy. In this sense, UAVs can provide high-resolution real-time data, making them a primary data source in this task of early tree stages scouting.
Currently, DL main application to tree detection is focuses on the forest inventory of single or dominant tree species using UAV RGB images, with relatively few studies addressing individual tree segmentation (ITS) and tree-counting in the early stages of forest planting, in conjunction with VI. However, in our study, the YOLOv8 nano object detection model exhibited worthy precision and speed in detecting E. saligna trees at 180 days post-planting across different VIs.
In the training and validation dataset of the tested models, the NDVI, MPRI, and PSRI indices had the best performances. The mAP found for these VIs was like that obtained by Redmond et al. (2016), who tested the performance of the YOLO algorithm in detecting multiple objects in different datasets, and later by Jintasuttisak et al. (2022), who used YOLOv5 in palm tree detection using UAV images, achieving best results using the algorithm medium structure trained with RGB images. Furthermore, this study also reports results close to Precision and Recall Metrics, with values of 0.91 and 0.92, respectively.
Vegetation indices like NDVI, MPRI, and PSRI have been frequently used to tree scouting in a forest plantation and can provide satisfactory results in ITS and tree-counting. In Table 4, the results of E. saligna detection accuracy indicators are shown where the NDVI scores were the highest (3.17), followed by MPRI (2.93) and PSRI (2.67). These results can be explained by the specific spectral characteristics of the target and the index formula, which uses visible (red) and near-infrared (NIR) bands to highlight the vegetation in the scene.
In the visual analysis of E. saligna ITS and tree-counting in the four segments created for models trained from each VI and the RGB image, the best models obtained with NDVI, MPRI, and PSRI had over 95% True Positives, suggesting trustworthiness in tree-counting values and ITS in the field. The superiority of these models can be attributed to better distinction of chlorophyll present in E. saligna canopies compared to spontaneous vegetation and other no-target reflective materials present over the soil. These VIs can capture the spectral response caused by chlorophyll, providing greater capacity to distinguish plants from soil in the object detection process.
Huang et al. (2021), in a recent review on the use of NDVI in remote sensing, highlights that NDVI saturates after the plant canopy reaches a specific biomass area per individual. The authors emphasize that even when scouting very distinct targets such as a golf course and a mature deciduous forest, NDVI trends to show a consistent spectral response. The saturation factor of the index can be a problem in studies aiming to detect ITS in fields with widespread presence of spontaneous vegetation.
Barbosa et al. (2019), in a study on grass detection, reported MPRI as one of the most suitable VIs for evaluating vegetation variability and soil coverage, finding the best visual distinction of these attributes with RGB images. However, the authors emphasize the influence of shading on MPRI, which can lead to misinterpretations regarding the growth stages of the plants. The choice of the imaging time and the percentage of cloud cover at the time of the flight can affect the results. Despite these limitations, the MPRI presents potential for extensive use since it is based only on RGB bands in its formulation.
The model generated from the UAV's RGB image showed the highest number of false negatives. These errors can be attributed to the fact that the spectral response of eucalyptus individuals and emergent non-target vegetation within the RGB spectrum is similar. The lack of intrinsic characteristics that distinguish eucalyptus individuals from other types of vegetation present in the field ends up confusing the algorithm, which consequently fails to reach the minimum confidence level of 50% established as a threshold in the prediction accuracy parameters. Another factor that affects the accuracy of models trained with RGB images is shading since, in many cases, the coloration attributed to shadows closely resembles dark leaves, making the canopy of two individual plants appear to be a single canopy. This can lead to tree-counting error that is assuming as one individual where in fact there were two tree individuals (underestimation).
We emphasize that the choice of the DL network significantly influences its classification accuracy. The network model employed in this study is widely recognized as an excellent choice for target detection. Additionally, the YOLOv8 nano network is suitable for application when the dataset available is not extensive, while for most other DL algorithms a large dataset is required (Kattenborn et al., 2021).
In the study conducted by Choi et al. (2022), which focused on tree detection around streets, the YOLO v3 model was used to train 5,480 images up to a million times. The precision and recall indices achieved were 0.727 and 0.634, respectively. Xu et al. (2023) tested different combinations of multispectral bands to identify tree species in transmission lines, with the YOLO v4 and YOLO v7 models. The authors reported that the YOLO v7 model had better recognition accuracy and detection in ITS, by applying a combination of red, green, and blue bands, in relation to YOLO v4.
Similarly, Xi et al. (2022) conducted a comparison using the YOLO v3 model, evaluating various band combinations such as green and blue; NIR, red, green; and blue, red, and NIR. The study discovered that these combinations had satisfactory detection accuracy for single tree canopies in urban environments, with NIR, red, and green bands presenting the most effective detection indices.
Finally, we emphasize that the discrepancy in the best model and detection indices observed in the studies may be linked to the distinct target species and tree growth stage scattered in the different study areas, with variations in the reflective properties of trees at different wavelengths, which also had effects in the application of VIs.
Despite the satisfactory capacity for ITS and tree-counting presented by the models with higher detection accuracy indicators (Table 4), some aspects of the training process still need further improvement. The low number of images available for training and the use of the same area in the training and validation process hinder the accuracy in the final models. Even in the model that had the best performance (Table 4), the presence of False Positives and False Negatives can be observed, although it is in low proportions. It is also notable that there is a need for YOLO algorithm to be tested in different areas and soil types, percentages of spontaneous vegetation, plant vigor and nutrition status, as well as in other tree species.
Another important consideration is the occurrence of underestimation that needs to be reduced, which is when two or more plants are counted as a single plant. The occurrence of these undesirable results can be attributed to both the low number of samples (dataset), the need for improvement in data labeling, and shading present during the flight time. In addition, the YOLO algorithm has shown difficulty in differentiating canopies that are located nearest, a difficulty that was also encountered by the authors during the data labeling process in our study, demonstrating that it was not an intrinsic error of the algorithm but rather an effect of the dynamics of forest growth.
4 CONCLUSIONS
The main achievement of our work was the development of methodological procedures to detect E. saligna trees with accuracy in a commercial forest plantation using unmanned aerial vehicle-based remote sensing and learning machine, as tool forest management and inventory tasks. Based on the results obtained with the developed methodology, it was possible to accept the hypothesis that UAV-based images to generate vegetation indices combined with the YOLOv8n algorithm are efficient to identify E. saligna even in the early stage of the tree development.
The best models found in the training process also coincided with the best validation models, based on criteria, statistics, and graphical analysis. Furthermore, the NDVI, MPRI, and PSRI indices were the most consistent in detecting E. saligna individuals at six months of age.
Finally, we highlight the importance of further studies on the use of the MPRI index in precision forests. Although NDVI stands out in the final calculated score, the use of the NIR band in NDVI calculation requires the use of a more expensive sensor compared to MPRI, which only uses the red, green, and blue bands in its formulation. RGB sensors tend to have lower cost and therefore are more accessible when compared to sensors with higher spectral resolution bands. Thus, our study suggests MPRI as an efficient vegetation index to be used on a large-scale considering cost versus performance in models trained as the YOLOv8n algorithm.
REFERENCES
-
ABDOLLAHNEJAD, A.; PANAGIOTIDIS, D. Tree species classification and health status assessment for a mixed broadleaf-conifer forest with UAS multispectral imaging. Remote Sensing, v. 12, n. 22, p. 3722, 2020. DOI: https://doi.org/10.3390/rs12223722
» https://doi.org/10.3390/rs12223722 -
ALVARES, C. A. et al Köppen’s climate classification map for Brazil. Meteorologische Zeitschrift, v. 22, n. 6, p. 711–728, 2013. DOI: https://doi.org/10.1127/0941-2948/2013/0507
» https://doi.org/10.1127/0941-2948/2013/0507 -
BARBOSA, B. et al RGB vegetation indices applied to grass monitoring: a qualitative analysis. Agricultural Research, v. 17, n. 2, p. 349–357, 2019. DOI: https://doi.org/10.15159/ar.19.119
» https://doi.org/10.15159/ar.19.119 - BARNES, E. M. et al Coincident detection of crop water stress, nitrogen status and canopy density using ground based multispectral data. In: Proceedings of the fifth international conference on precision agriculture, Bloomington, MN, USA 2000.
-
BOCHKOVSKIY, A.; WANG, C.-Y.; LIAO, H.-Y.M. YOLOv4: Optimal Speed and Accuracy of Object Detection. arXiv, 2020. Available at: https://arxiv.org/abs/2004.10934
» https://arxiv.org/abs/2004.10934 -
CHEN, Y. et al An efficient approach to monitoring pine wilt disease severity based on random sampling plots and UAV imagery. Ecological Indicators, v. 156, p. 111215, 2023. DOI: https://doi.org/10.1016/j.ecolind.2023.111215
» https://doi.org/10.1016/j.ecolind.2023.111215 -
CHOI, K. et al An automatic approach for tree species detection and profile estimation of urban street trees using deep learning and Google Street view images. ISPRS Journal of Photogrammetry and Remote Sensing, v. 190, p. 165-180, 2022. DOI: https://doi.org/10.1016/j.isprsjprs.2022.06.004
» https://doi.org/10.1016/j.isprsjprs.2022.06.004 -
DUARTE, Marciel Lelis; RIBEIRO, Aristides. Influência do El Niño e La Niña na produtividade de plantios de Eucalipto em distintas regiões no Brasil. Ciência Florestal, v. 33, p. e61334, 2023. DOI: https://doi.org/10.5902/1980509861334
» https://doi.org/10.5902/1980509861334 - DUTTA, A.; ZISSERMAN, A. The VIA annotation software for images, audio and video. In: Proceedings of the 27th ACM international conference on multimedia. Anais... 2019. p. 2276-2279.
-
EUGENIO, F. C. et al Estimation of soybean yield from machine learning techniques and multispectral rpas imagery. Remote Sensing Applications: Society and Environment, v. 20, p. 100397, nov. 2020. DOI: https://doi.org/10.1016/j.rsase.2020.100397
» https://doi.org/10.1016/j.rsase.2020.100397 -
FAO. Global Forest Resources Assessment 2020. 2020. DOI: https://doi.org/10.4060/ca9825en
» https://doi.org/10.4060/ca9825en -
GITELSON, A. A. et al Remote estimation of leaf area index and green leaf biomass in maize canopies. Geophysical Research Letters, v. 30, n. 5, 2003. DOI: https://doi.org/10.1029/2002gl016450
» https://doi.org/10.1029/2002gl016450 -
GITELSON, A. A.; GRITZ, Y.; MERZLYAK, M. N. Relationships between leaf chlorophyll content and spectral reflectance and algorithms for non-destructive chlorophyll assessment in higher plant leaves. Journal of Plant Physiology, v. 160, n. 3, p. 271–282, 2003. DOI: https://doi.org/10.1078/0176-1617-00887
» https://doi.org/10.1078/0176-1617-00887 - GONÇALVES, H.; EMBRAPA SOLOS. Sistema brasileiro de classificação de solos Embrapa, 2018.
-
GUO, B. et al Detection of the Grassland Weed Phlomoides umbrosa Using Multi-Source Imagery and an Improved YOLOv8 Network. Agronomy, v. 13, n. 12, p. 3001, 2023. DOI: https://doi.org/10.3390/agronomy13123001
» https://doi.org/10.3390/agronomy13123001 -
HUANG, S. et al A commentary review on the use of normalized difference vegetation index (NDVI) in the era of popular remote sensing. Journal of Forestry Research, v. 32, n. 1, p. 1–6, 2020. DOI: https://doi.org/10.1007/s11676-020-01155-1
» https://doi.org/10.1007/s11676-020-01155-1 -
INSTITUTO BRASILEIRO DE ÁRVORES. IBÁ. Relatório Anual Available at: https://iba.org/datafiles/publicacoes/relatorios/relatorio-anual-iba2022-compactado.pdf Accessed in: 2022.
» https://iba.org/datafiles/publicacoes/relatorios/relatorio-anual-iba2022-compactado.pdf -
IOST FILHO, F. H. et al Drones: innovative technology for use in precision pest management. Journal of Economic Entomology, v. 113, n. 1, p. 1–25, 8 fev. 2020. DOI: https://doi.org/10.1093/jee/toz268
» https://doi.org/10.1093/jee/toz268 -
JEMAA, H. et al UAV-based computer vision system for orchard apple tree detection and health assessment. Remote Sensing, v. 15, n. 14, p. 3558, 2023. DOI: https://doi.org/10.3390/rs151435587
» https://doi.org/10.3390/rs151435587 -
JINTASUTTISAK, T.; EDIRISINGHE, E.; ELBATTAY, A. Deep neural network-based date palm tree detection in drone imagery. Computers and Electronics in Agriculture, v. 192, p. 106560, 2022. DOI: https://doi.org/10.1016/j.compag.2021.106560
» https://doi.org/10.1016/j.compag.2021.106560 -
JOSEPH, R. et al You Only Look Once: Unified, Real-Time Object Detection. arXiv (Cornell University), 2016. DOI: https://doi.org/10.48550/arxiv.1506.02640
» https://doi.org/10.48550/arxiv.1506.02640 -
KATTENBORN, T. et al Review on Convolutional Neural Networks (CNN) in vegetation remote sensing. ISPRS Journal of Photogrammetry and Remote Sensing, v. 173, p. 24-49, 2021. DOI: https://doi.org/10.1016/j.isprsjprs.2020.12.010
» https://doi.org/10.1016/j.isprsjprs.2020.12.010 -
KOPACKOVÁ-STRNADOVÁ, V. et al Canopy top, height and photosynthetic pigment estimation using parrot sequoia multispectral imagery and the unmanned aerial vehicle (UAV). Remote Sensing, v. 13, p. 705, 2021. DOI: https://doi.org/10.3390/rs13040705
» https://doi.org/10.3390/rs13040705 -
LAFETÁ, Bruno Oliveira et al Eficiência de utilização de macronutrientes em eucalipto por método não destrutivo estimados por redes neurais artificiais. Ciência Florestal, v. 28, n. 2, p. 613-623, 2018. DOI: http://dx.doi.org/10.5902/1980509832049
» http://dx.doi.org/10.5902/1980509832049 -
LIN, T. Y. et al Microsoft coco: Common objects in context. In: Computer Vision–ECCV 2014: 13th European Conference, Zurich, Switzerland, September 6-12, 2014, Proceedings, Part V. Anais... Springer International Publishing, 2014. p. 740-755. DOI: https://doi.org/10.1007/978-3-319-10602-1_48
» https://doi.org/10.1007/978-3-319-10602-1_48 -
LING, Q.; ISA, N. A. M.; ASAARI, M. S. M. Precise Detection for Dense PCB Components Based on Modified YOLOv8. IEEE Access, v. 11, p. 116545-116560, 2023. DOI: 10.1109/ACCESS.2023.3325885.
» https://doi.org/10.1109/ACCESS.2023.3325885 -
MA, Y. K. et al Object detection of individual mangrove based on improved YOLOv5. Laser Optoelectron. Prog, v. 59, p. 436-446, 2022. DOI: 10.3788/LOP202259.1828003.
» https://doi.org/10.3788/LOP202259.1828003 -
MALABAD, A. M. et al A combined approach utilizing UAV 3d imaging methods, in-situ measurements, and laboratory experiments to assess water evaporation and trace element uptake by tree species growing in a red gypsum landfill. Journal of Hazardous Materials, v. 425, p. 127977, 2022. DOI: 10.1016/j.jhazmat.2021.127977.
» https://doi.org/10.1016/j.jhazmat.2021.127977 -
MCFEETERS, S. K. The use of the Normalized Difference Water Index (NDWI) in the delineation of open water features. International Journal of Remote Sensing, v. 17, n. 7, p. 1425–1432, 1996. DOI: https://doi.org/10.1080/01431169608948714
» https://doi.org/10.1080/01431169608948714 - MERZLYAK, M. N. et al Non-destructive optical detection of pigment changes during leaf senescence and fruit ripening. Physiologia Plantarum, v. 106, n. 1, p. 135–141, 199
-
MICA SENSE. MicaSense RedEdge™ 3 multispectral camera user manual. Seattle: MicaSense, 2015. 33 p. Rev 06, October 2015. Available at: https://support.micasense.com/hc/en-us/articles/215261448-RedEdge-User-Manual-PDF-Download Accessed in: 28th Nov. 2019.
» https://support.micasense.com/hc/en-us/articles/215261448-RedEdge-User-Manual-PDF-Download - REDMON, J.; FARHADI, A. YOLO9000: Better, Faster, Stronger. arXiv, 2016, arXiv:1612.08242.
- REDMON, Joseph; FARHADI, Ali. Yolov3: An incremental improvement. arXiv preprint arXiv:1804.02767, 2018.
-
ROUSE, R.; HAAS, J.; DEERING, D. Monitoring vegetation systems in the great plains with erts Available at: https://ntrs.nasa.gov/api/citations/19740022614/downloads/19740022614.pdf
» https://ntrs.nasa.gov/api/citations/19740022614/downloads/19740022614.pdf -
ŞANDRIC, I., et al Tree's detection & health's assessment from ultra-high resolution UAV imagery and deep learning. Geocarto International, v. 37, n. 25, p. 10459-10479, 2022. https://doi.org/10.1080/10106049.2022.2036824
» https://doi.org/10.1080/10106049.2022.2036824 -
SIKATI, J.; NOUAZE, J. C. YOLO-NPK: A Deep Lightweight Network for Lettuce Nutrient Deficiency Classification Based on Improved YOLOv8 Nano. Engineering Proceedings, v. 58, n. 1, p. 31, 2023. DOI: https://doi.org/10.3390/ecsa-10-16256
» https://doi.org/10.3390/ecsa-10-16256 -
TANNURE FARIA, Júlio Cézar et al Manejo da densidade de plantas durante a produção de mudas em viveiro.Ciência Florestal, v. 29, n. 3, 2019. DOI: https://doi.org/10.5902/1980509830030
» https://doi.org/10.5902/1980509830030 -
TZUTALIN. LabelImg. Git code, 2015. Available at: https://github.com/tzutalin/labelImg
» https://github.com/tzutalin/labelImg -
VAHL DE PAULA, B.; SQUIZANI ARRUDA, W.; ETIENNE PARENT, L.; FRANK DE ARAUJO, E.; BRUNETTO, G. Nutrient diagnosis of Eucalyptus at the factor-specific level using machine learning and compositional methods. Plants, v. 9, n. 8, p. 1049, 2020. DOI: https://doi.org/10.3390/plants9081049
» https://doi.org/10.3390/plants9081049 - VINCINI, M.; FRAZZI, E.; D’ALESSIO, P. Comparison of narrow-band and broad-band vegetation indices for canopy chlorophyll density estimation in sugar beet. In: Precision agriculture'07 Wageningen Academic, 2007. p. 189-196.
-
WANG, F., et al Rice yield estimation using parcel-level relative spectral variables from UAV-based hyperspectral imagery. Frontiers in Plant Science, v. 10, p. 453, 2019. DOI: https://doi.org/10.3389/fpls.2019.00453
» https://doi.org/10.3389/fpls.2019.00453 -
XIANGSHU, X. I.; KAI, X. I. A.; YINHUI, Y. A. N. G.; XIAOCHEN, D. U.; HAILIN, F. E. N. G. Urban individual tree crown detection research using multispectral image dimensionality reduction with deep learning. National Remote Sensing Bulletin, v. 26, n. 4, p. 711-721, 2022. DOI: https://dx.doi.org/10.11834/jrs.20220163
» https://dx.doi.org/10.11834/jrs.20220163 -
XU, S.; WANG, R.; SHI, W.; WANG, X. Classification of tree species in transmission line corridors based on YOLO v7. Forests, v. 15, n. 1, p. 61, 2023. DOI: https://doi.org/10.3390/f15010061
» https://doi.org/10.3390/f15010061 -
YANG, Z.; WILLIS, P.; MUELLER, R. Impact of band-ratio enhanced AWIFS image to crop classification accuracy Available at: https://www.asprs.org/a/publications/proceedings/pecora17/0041.pdf Accessed in: 15th May 2024.
» https://www.asprs.org/a/publications/proceedings/pecora17/0041.pdf -
ZHANG, L.; ZHAO, C.; FENG, Y.; LI, D. Pests identification of ip102 by yolov5 embedded with the novel lightweight module. Agronomy, v. 13, n. 6, p. 1583, 2023. DOI: https://doi.org/10.3390/agronomy13061583
» https://doi.org/10.3390/agronomy13061583 -
ZHENG, H., et al Evaluation of rgb, color-infrared and multispectral images acquired from unmanned aerial systems for the estimation of nitrogen accumulation in rice. Remote Sensing, v. 10, n. 6, 2018. DOI: https://doi.org/10.3390/rs10060824
» https://doi.org/10.3390/rs10060824 -
ZHUO, W.; WU, N.; SHI, R.; WANG, Z. UAV mapping of the chlorophyll content in a tidal flat wetland using a combination of spectral and frequency indices. Remote Sensing, v. 14, 827, 2022. DOI: 10.3390/rs14040827.
» https://doi.org/10.3390/rs14040827

 Source: Authors (2025)
 Source: Authors (2025)
 Source: Authors (2025)
 Source: Authors (2025)