
 Efficiency and costs of different sampling methods in an inventory of a Terra Firme Forest, Pará state, Brazil
ABSTRACT
A forest inventory conducted at Caculé farm, located in Paragominas, Para state (PA), Brazil, aimed to compare the efficiency and costs of different sampling methods (simple random sampling, unstratified cluster sampling, and post-stratified cluster sampling) in a terra firme forest. The farm covers a total area of 8,637 hectares, divided into an equidistant grid of 700-meter coordinates. Within this grid, 47 sampling units (SUs) were randomly selected. The analysis considered four different approaches: simple random cluster sampling (T1); simple random sampling by subunit (T2); by cluster (T3), and post-stratified cluster sampling (T4). For each sampling method, traditional parametric estimators were used to obtain estimates of production per hectare. T4 required prior data analysis to identify the existing strata (cluster analysis). The estimated average production (m3) per hectare was 154.99 m3, with a deviation ranging from ±5.33 to 36.54 m3.ha-1. The sampling error showed little variation (4.67 to 6.92%). T2 and T4 exhibited the smallest errors. The sampling sufficiency for the pre-defined error showed high variation (14 to 43 SUs), with T4 being the best treatment. The fixed cost per sampling unit (SU) was $269.22. Compared to the other approaches, T4 was the most efficient in terms of time, resources and effort required to achieve 10% precision, thereby reducing forest inventory costs.
Keywords
Multivariate analysis; Paragominas; Post-stratification; Cost estimate
RESUMO
O inventário florestal na Fazenda Caculé, localizada em Paragominas-PA, teve como objetivo comparar a eficiência e custos de diferentes processos de amostragem (simples ao acaso, conglomerado sem estratificação e conglomerado com pós-estratificação) em uma floresta de terra firme. A fazenda, com uma área total de 8.637 hectares, foi dividida em um grid com coordenadas equidistantes de 700 metros. Neste grid, foram selecionadas aleatoriamente 47 unidades amostrais (UAs). A análise considerou quatro tratamentos diferentes: simples ao acaso por conglomerado (T1); simples ao acaso por subunidade (T2); por conglomerado (T3) e pós-estratificado por conglomerado (T4). Para cada processo de amostragem foram utilizados os estimadores paramétricos tradicionais para obtenção das estimativas de produção por hectare. O T4 exigiu uma análise prévia dos dados a fim de identificar os estratos existentes (análise de agrupamento). Na estimativa da produção (m3) por hectare a média foi de 154,9855 m3, com desvio variando de ±5,33 a 36,54 m3.ha-1. O erro de amostragem teve pouca variação, 4,67% a 6,92%. T2 e T4 apresentaram os menores erros. A suficiência amostral para o erro pré-definido apresentou alta variação (14 a 43 UAs), sendo T4 o melhor tratamento. O custo fixo por Unidade Amostral (UA) foi de $269,22. Em comparação com os demais tratamentos, T4 foi o mais eficiente em termos de tempo, recursos e esforço necessários para atingir a precisão de 10%, o que reduz os custos do inventário florestal.
Palavras-chave
Análise multivariada; Paragominas; Pós-estratificada; Estimativa de custos
1 INTRODUCTION
Forest inventories can be classified in various ways: according to their objectives, scope, data collection method in the field, temporal approach to the population, and the level of detail in the results (Péllico Netto; Brena, 1997). Knowledge of forest inventories is essential for decision making in sustainable management planning, aiming to ensure the continuity of any activity and preserve it for future generations (Augustynczik et al., 2013).
Forest inventories can also be used to assess other functions, such as recreational purposes, watershed exploration, wildlife, and other potential uses of forest ecosystems. For forest management purposes, inventories should be planned so that various structural forest parameters and their interrelationships can be interpreted, in order to support the definition of silvicultural treatments and other ecological and economic use operations, through the sustainable and continuous production of the forest’s direct and indirect benefits for society (Queiroz, 2012).
The inventory is a tool that can ensure the success of a business when the goal of a producer is to establish a forest management system focused on sustainable product yields. To that end, the sampling system used in forest inventories enables accurate estimates and an efficient economic assessment of the sampling units (SUs) for the population under study (Reis et al., 2022). According to Oliveira et al. (2014), the optimal plot size can vary depending on the sampling methods, which are influenced by tree clustering and survey costs.
The sampling methodology must have a scientific bias specific to the region’s conditions, provide information with an acceptable level of precision, and minimize costs (Husch, 1971). Thus, coordinating the application of the most suitable sampling method for each situation is crucial for a sustainable management system (Conte, 1997). Among the sampling methods with equal probability of selection for sampling units, the following stand out: simple random sampling, stratified random sampling, multistage sampling, and multiphase sampling (Soares; Paula Neto; Souza, 2012).
Traditionally, forest stands are stratified based mainly on information such as age, species, provenance, administrative regions, typology, topographic conditions, stage of development, stem density or diameter classes, site index, and the characteristics of interest (volume, weight, etc.) (Sanquetta et al., 2014). In the context of native forests, stratification often presents challenges in defining the basis for stratification, which reflects the behavior of the variable of interest, and in delineating and defining stratified areas (Alvarenga, 2012). The qualitative and quantitative assessment of different forest attributes during a survey can enable stratification after the conclusion of fieldwork (Batista; Couto; Silva Filho, 2014). This procedure is known as post-stratification.
Post-stratification consists of dividing the data into strata after collection, allowing for the identification of their variability and delineation. Analysis of variance (ANOVA) is used to determine whether there is a significant difference between the means of the strata. If such a difference exists, stratified sampling offers advantages in terms of cost and inventory precision when compared to simple random sampling (Péllico Netto; Brena, 1997).
Multivariate analyses have been widely applied in the forestry sector, since they enable a quick and reliable study of the relationships among variables of interest, and their interrelationships. According to Gerhardt et al. (2001), multivariate analysis is a set of statistical techniques that deals with data involving measurements of numerous variables simultaneously. Multivariate analysis can substantially enhance the potential response of forest inventories, increasing the possibilities for better use and conservation of tropical forests (Queiroz, 2021).
As such, the efficiency of different sampling methods was compared (simple random – by cluster and by subunit, unstratified cluster, and post-stratified cluster) in a forest inventory in a terra firme forest, located at the Caculé farm, Paragominas, Para state, Brazil (PA), using multivariate statistics to estimate forest production.
2 MATERIALS AND METHODS
2.1 Study Area
The municipality of Paragominas is situated along the Belém-Brasília highway (BR-010), 320 km from Belém, the capital of Pará state. It covers an area of 1.93 million hectares (1.5% of the surface area of Pará) and has a population of 115,838 inhabitants (IBGE, 2022; Pinto et al., 2009).
The study was conducted at the Caculé farm (03°20’59.53” South and 48°16'27.64” West (Figure 1)), which belongs to the Keilla Florestal Group, and is located on Highway 010, Km 1,564. The farm has a total area of 28,277.00 hectares, 22,744.76 ha of which are designated as legal reserve (80%), and 5,532.24 ha allocated for alternative land use (20%). The property also includes 995.11 ha of consolidated areas (3.5%) and 2,255.42 ha of permanent preservation areas (7.9%), and is part of the Sustainable Forest Management Plan (PMFS in Portuguese) of the Rio Capim complex, where logging activities began in the year 2000.

2.2 Data Collection
The sampling procedure for the forest inventory (FI) was conducted using clusters, as proposed by Péllico Netto and Brena (1997). The area covered by this survey comprises 8,637 hectares. An equidistant grid of geographic coordinates (700 meters apart) was applied, subdividing the area into 176.3 blocks. From these, 47 were randomly selected for the establishment and measurement of SUs. The sampling intensity for the survey was obtained by the ratio between the study area (8,637.00 ha) and the number of SUs (47), resulting in 183.77 hectares per cluster.
At the center of each selected block, a primary unit (cluster) was established in the shape of a Maltese Cross, consisting of four rectangular secondary units (subunits), measuring 10 by 250 meters, oriented using a compass along the cardinal directions (North, South, East, and West), and numbered from 1 to 4 (Figure 2).
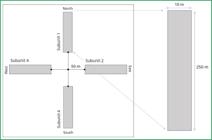
The geographic coordinates of the central point of each SU were recorded using a GPSMAP 64sc (Garmin) GNSS (Global Navigation Satellite System) navigation receiver, and the ends marked with wooden stakes to facilitate visualization of the subunit boundaries in the field (Figure 2). Clusters whose primary units intersected permanent preservation areas were relocated outside these protected zones.
The study involved measuring stem diameter (d) ≥ 10 cm for tree and palm populations (except acaulescent palms), taken at 1.30 meters above ground level. Botanical identification was performed in the field using scientific collections from virtual herbaria (e.g. Herbário Virtual Reflora). The species list obtained was corrected and updated based on the most recent taxonomic classifications, using the Flora do Brasil 2020 website (http://reflora.jbrj.gov.br/). No botanical specimens were incorporated into an herbarium. Commercial height (hc) was also estimated using the angle overlap method, and the diameter at 1.30 m (d) was measured for all individuals within the SUs. Individuals whose diameter measurements were estimated due to obstacles preventing direct measurement (such as buttresses) were identified in the field data sheets. Dendrometric variables (hc and d) and their measurement/estimation methodologies were identified according to the guidelines proposed by Machado and Figueiredo Filho (2014).
2.3 Data Analysis
The volume (m3) of standing trees was the variable of interest considered in the forest inventory analyses, estimated using the Schumacher-Hall volume equation, as shown below:
where: d = stem diameter measured at 1.30 m above ground (cm); hc = commercial height (m).
The above equation was fitted to the Sustainable Forest Management Plan (PMFS) of the Rio Capim complex, which includes five neighboring properties, one of which is the farm studied here. To that end, 1,130 whole commercial logs were distributed into diameter classes, with 1,030 logs used for model fitting, and 100 for validating the selected equation.
For data analysis, three forest inventory methods were considered, distributed across four treatments (Table 1). Initially, a descriptive analysis of the population was conducted. Next, the inventory precision was calculated, and finally, the production estimate was determined. The traditional analysis methods were based on Péllico Netto & Brena (1997), Soares, Paula Neto & Souza (2012), and Sanquetta et al. (2014).
Treatments of the different sampling methods employed in a forest inventory of a terra firme forest, Caculé farm, Paragominas-PA
Unlike the other treatments, T4 required preliminary data analysis to identify potential existing strata, based on the variable of interest (volume per hectare, vol.ha-1). To that end, cluster analysis, an unsupervised learning technique, was used to infer the hierarchical clustering of the SUs, as described by Ferreira et al. (2020).
Based on the original forest inventory data, the following variables were calculated for each SU for use in the cluster analysis: volume per hectare in m3 (vol.ha-1); basal area in m2 (G); maximum stem diameter in cm (d_max); maximum volume in m3 (vol_max); and maximum commercial height in meters (hc_max). The basal area (G) is defined as the sum of all cross-sectional areas of the trees within an SU. To better understand the distribution behavior of the variables, normality (Shapiro-Wilk) and correlation (Spearman) tests were conducted using the native R functions “shapiro.test” and “cor.test”, respectively. Data non-normality at a 99% confidence level was found for the variables d_max (p = 0.00001), vol_max (p = 0.00000), and hc_max (p = 0.00000). Next, data standardization was performed (Equation 2), since the variables were on different scales:
In where: Yi = value of the variable for the sampling unit; Y̅ = arithmetic mean of the variable Y; Sd = standard deviation of the mean
The optimal number of clusters (strata) was determined using the k-means algorithm, which defined four strata, based on testing and validation. Analysis of variance (ANOVA) was applied to determine whether significant differences existed between the mean volume/SU across these strata. A significant difference was found with the formation of four strata. Subsequently, to construct the SU dendrogram, distances and similarities between data pairs were calculated using Euclidean distance and Ward’s linkage method, respectively. Once the strata were defined, the SUs were separated accordingly to carry out forest inventory analysis for treatment T4, following the stratified sampling methodology described by Péllico Netto and Brena (1997).
2.4 Cost Estimate per Sampling Unit
The cost calculation (C) was carried out in line with the methodology of Péllico Netto and Brena (1997):
where: C0 = Fixed cost; Ca = Variable cost
Fixed costs exist in every sampling method, encompassing expenses related to administration, planning, data processing, result analysis, and report preparation. The variable cost (Ca) refers to the field survey cost and consists of two main components:
where: C1n = Average cost of transportation between units; C2n = Average cost of measuring the units
The total cost function can be expressed as:
or
The fixed and variable costs were recorded with their respective values from the forest inventory in the study area, along with the list of quantities and prices of the materials and equipment used. The reference variables were time (60 days, including 45 days of fieldwork and 15 days in the office); distance (the round-trip distance to the study area was 600 km, plus an average of 20 km traveled per day); and base year (2021), with a minimum monthly wage in Brazil of R$1,100.00 (or $203.70) and an average commercial dollar exchange rate of R$5.40 (IPEA, 2025).
2.5 Definition of the best sampling process
The best sampling method was defined based on the ranking of precision statistics, arranged according to their efficiency. A weight of 1 was assigned to the most efficient process, 2 to the second most efficient, and so on. The following statistics were considered: standard deviation; inventory precision for a 95% probability (p); sampling sufficiency for a 10% predefined error with p = 95%; and total sampling cost.
2.6 Statistical Programs and Packages
The database preparation for forest inventory analysis and the costs for each treatment were determined using Microsoft Excel. All statistical analyses were conducted in R software, version 4.2 (R Core Team, 2022).
3 RESULTS AND DISCUSSIONS
3.1 Forest inventory by treatment
The correlation between the variables used in multivariate analysis revealed two positive correlations: volume per hectare (vol.ha-1) and basal area (G, in m2), maximum diameter (d_max) and maximum volume (vol_max). By contrast, maximum commercial height (hc_max) showed no significant correlation with any of the other variables (Table 2). Oliveira et al. (2005) developed volume equations for forest fragments in the Zona da Mata Mineira, Viçosa, Minas Gerais state (MG), and found similar results, reporting a positive correlation between basal area per hectare and volume-related variables.
Correlation between variables used in cluster analysis, collected from 47 sampling units, each 1 hectare in size, in terra firme forest, Caculé farm, Paragominas-PA
The dendrogram, which clustered SUs into homogeneous or stock classes according to similarity in tree structure or shape, was classified using a cut-offline (phenon line) (Medeiros, 2008; Vicini, 2005), and validated by analysis of variance (ANOVA, p = 0.0000002). Consequently, the SUs were classified into four volume stock classes.
The dendrogram displayed dissimilarity on the y-axis (percentage), with values ranging from zero (maximum similarity) to approximately 15 (minimum dissimilarity), and the SUs on the x-axis (Figure 3). Four strata were formed (E1, E2, E3, E4): stratum E1 with 21 SUs and an area of 3,859.09 ha; stratum E2 with 3 SUs and an area of 551.30 ha; stratum E3 with 5 SUs and an area of 918.83 ha; and stratum E4 with 18 SUs and an area of 3,307.79 ha. The area of each stratum was calculated by multiplying the number of SUs by the sampling intensity of the survey (183.77 ha).
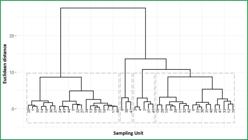
Clustering of 47 sampling units (1 ha each), obtained based on Euclidean distance and Ward’s method, from data collected in a forest inventory conducted in a terra firme forest, Caculé farm, Paragominas, Pará
Simple random sampling by subunit (T2) and post-stratified sampling (T4) exhibited the smallest sampling errors, with comparable values. Conversely, treatments T1 and T3 registered the highest errors (Table 3). Barbosa et al. (2017) assessed a forest formation in the center-north of Minas Gerais, and found similar results for 58 SUs, where post-stratified sampling was the best method, and simple random sampling the worst. All treatments had sampling errors below 10%, a value considered acceptable according to Sanquetta et al. (2014). This value, derived from two random variables (mean and error of the inventory) can positively or negatively impact production estimates, if fluctuations are considered (Alvarenga, 2012).
Comparison of estimates obtained in different sampling processes and post-stratification in a terra firme forest inventory, Caculé farm, Paragominas-PA
3.2 Forest Inventory Costs
The installation of 47 SUs over 60 working days cost $12,653.55 (Table 4). Labor was the most significant expense category, accounting for 53.81% of the total field activity costs, totaling $6,808.97. The remaining costs, in descending order were vehicle and fuel at 23.80% ($3,011.11); food expenses at 12.04% ($1,523.15); and materials and equipment at 10.36% ($1,310.32) (Tables 4 and 5).
List of equipment and consumable materials used in the terra firme forest inventory, Caculé farm, Paragominas-PA
Andrade et al. (2015) reported similar findings in a non-timber forest management area in the Tapajós National Forest, Belterra/PA, where the installation and measurement of 204 plots incurred a total cost of $17,925.19, with labor accounting for 79.94% ($14,328.70). The remaining costs were for the team's field meals (14.32% or $2,566.34), medicines (1.19% or $212.65), and consumables (4.56% or $817.50). It is important to note that costs related to medicine or medical assistance were not considered in the present study due to the proximity of the study area to the Rio Capim farm camp, which belongs to the same commercial group and has a fully equipped infirmary.
In an inventory of clonal Eucalyptus plantations in southern Bahia state, Binoti et al. (2012) used 982 plots with a sampling intensity of one plot (600 m2) every six hectares, incurring a total cost of $27,878.90. Labor accounted for 75.50% ($21,047.20), team meals 9.96% ($2,776.70), and transport 14.55% ($4,055.00).
For a clearer understanding of the cost distribution per SU, fixed and variable costs were calculated separately, resulting in a total cost per SU of $269.22 (Table 6).
Average total cost per sample unit in 47 sampling points, each 1 hectare in size, in a terra firme forest, Caculé farm, Paragominas-PA
Based on the total cost per SU ($269.22), the variable cost per SU was $96.48. With the fixed and variable costs calculated, the total costs per treatment were obtained. Treatment T4 had the lowest cost ($3,769.14) (Table 7). The main difference between the costs per treatment lies in the sampling sufficiency, meaning that a lower number of SUs in the survey results in a less costly sampling method. Generally, the fixed cost accounted for the largest portion of the total cost (64.17%)."
Sampling sufficiency, fixed, variable, and total costs by treatment, considering 1 ha of sample area, in a forest inventory of 8,637 ha in a terra firme forest, Caculé farm, Paragominas-PA
3.3 Selection of the best treatment
The results indicated that post-stratified sampling (T4) achieved the best ranking among the four treatments studied, due to its superior precision statistics (Table 8). By contrast, simple random cluster sampling (T1) obtained the poorest results, with a total of 13 points. Simple random sampling by subunit (T2) and cluster sampling (T3) were intermediate, with 11 and 8 points, respectively.
Barbosa et al. (2017) reported similar findings in 1,696.79 hectares of semi-deciduous seasonal forest in the central-north region of MG, where post-stratification exhibited the best statistics compared to the other methods, proving to be an efficient alternative for obtaining precise estimates.
Effective stratification results in lower variance in mean and estimated values, compared to a simple random sample of similar size. The principle of stratification is to reduce the variance of the mean and total, thereby reducing the sampling error when compared to simple random sampling (Queiroz, 2012). In a study of 110 systematically allocated 0.75-hectare sampling units in upland forest in the Tapajós National Forest/PA, Vieira (2020) found similar results when analyzing the forest inventory with three timber use classes. Simple random sampling (6.65% error) and post-stratification (2.08% error) demonstrated that post-stratification methods were more efficient, resulting in significant increases in inventory precision.
4 CONCLUSIONS
The post-stratified sampling process, using clustered SUs, was one of the most efficient and cost-effective approaches in this study, thereby justifying its recommendation for inventories conducted in areas and forest typologies similar to those investigated here.
ACKNOWLEDGMENTS
To the KEILLA FLORESTAL group for providing the data and volume equation.
REFERENCES
- ALVARENGA, L. H. V. Imagens de alta resolução e geoestatística na estratificação da fisionomia cerrado para inventários florestais 2012. 91 f. Dissertação (Mestrado em Engenharia Florestal) – Universidade Federal de Lavras, Lavras, 2012.
- ALVARENGA, L. H. V.; MELLO, J. M. de; GUEDES, I. C. de L.; SCOLFORO, J. R. S. Desempenho da estratificação em um fragmento de Cerrado Stricto Sensu utilizando interpolador geoestatístico. Cerne, lavras, v. 18, n. 4, p. 675-681, 2012.
- ANDRADE, D.F.; GAMA, J.R.V.; MELO, L.O.; RUSCHEL, A.R. Inventário florestal de grandes áreas na Floresta Nacional do Tapajós, Pará, Amazônia, Brasil. Biota Amazônia, Macapá, v. 5, n. 1, p. 109-115, 2015.
- AUGUSTYNCZIK, A. L. D.; COCHARAN, S. A.; FIGUEIREDO FILHO, A.; PÉLLICO NETTO, S. Avaliação do tamanho de parcelas e de intensidade de amostragem em inventários florestais. Scientia Forestalis, Piracicaba, v. 41, n. 99, p. 361-368, 2013.
- BATISTA, J. L F.; COUTO, H. T. Z. do; SILVA FILHO, D. F. da. Quantificação de recursos florestais 1.ed. São Paulo: Oficina de Textos, 2014.
- BARBOSA, G. P.; NOGUEIRA, G. S.; OLIVEIRA, M. L. R. de; MACHADO, E. L. M.; CASTRO, R. V. O.; DUTRA, G. C. Pós-estratificação em inventário florestal da vegetação árborea-arbustiva. Scientia Forestalis, Piracicaba, v. 45, n. 155, p. 445-453, 2017.
- BINOTI, D. H. B.; BINOTI, M. L. M.S.; LEITE, H. G.; SILVA, A. Redução dos custos em inventário de povoamentos equiâneos. Revista Brasileira de Ciências Agrárias, Recife, v. 8, n. 1, p.125-129, 2012.
-
CONTE, R. Manejo do palmiteiro em Santa Catarina Relatório de Conclusão do Curso de Agronomia, Florianópolis, 1997. Available at: https://repositorio.ufsc.br/handle/123456789/117676 Accessed in: 16 May 2022.
» https://repositorio.ufsc.br/handle/123456789/117676 - FERREIRA, R. R. M.; PAIM, F. A. P.; RODRIGUES, V. G. S.; CASTRO, G. S. A. Análise de cluster não supervisionado em R: agrupamento hierárquico (Documentos 133) Campinas: Embrapa Territorial, 2020.
-
GERHARDT, E. J.; FINGER, C. A. G.; LONGHI, S. J.; SCHUMACHER, M. V. Contribuição da análise multivariada na classificação de sítios em povoamentos de Araucaria angustifolia (Bert.) O. ktze., baseada nos fatores físicos e morfológicos do solo e no conteúdo de nutrientes da serapilheira. Ciência Florestal, Santa Maria, v. 11, n. 2, p. 41-57, 2001. DOI 10.5902/198050981653. Available at: https://doi.org/10.5902/198050981653
» https://doi.org/10.5902/198050981653» https://doi.org/10.5902/198050981653 - HUSCH, B. Planning a Forest Inventory FAo Forest Products, rome, 1971.
-
INSTITUTO BRASILEIRO DE GEOGRAFIA E ESTATíSTICA (IBGE). Cidades e Estados. Available at: https://www.ibge.gov.br/busca.html?searchword=popula%C3%A7%C3%A3o+paragominas Accessed in: 16 May 2022.
» https://www.ibge.gov.br/busca.html?searchword=popula%C3%A7%C3%A3o+paragominas -
INSTITUTO DE PESQUISA ECONôMICA APLICADA (IPEA). Taxa de câmbio comercial (R$ para US$) para compra Available at: http://www.ipeadata.gov.br/Default.aspx Accessed in: 20 Feb. 2025
» http://www.ipeadata.gov.br/Default.aspx - MACHADO, S. do A.; FIGUEIREDO FILHO, A. Dendrometria 2. Ed. Guarapuava: UNICENTRO, 2014.
- MEDEIROS, R. M. Estratificação volumétrica e crescimento em uma floresta ombrófila densa, município de Almeirim, Estado do Pará 2008. 87 f. Dissertação (Mestrado em Ciência Florestal) – Universidade Federal de Viçosa, Viçosa, 2008.
- OLIVEIRA, M. M. de; HIGUCHI, N.; CELES, C. H.; HIGUCHI, F. G. Tamanho e formas de parcelas para inventários florestais de espécies arbóreas na Amazônia Central. Ciência Florestal, v. 24, n. 3, p. 645–653, 2014.
- OLIVEIRA, M.L.R.; SOARES, C.P.B.; SOUZA, C.P.B.; LEITE, H.G. Equações de volume de povoamento para fragmentos florestais naturais do município de Viçosa, Minas Gerais. Revista Árvore, Viçosa, v.29, n.2, p.213-225, 2005.
- PÉLLICO NETTO, S.; BRENA, D. A. Inventário florestal Curitiba: [s.n.], 1997.
- PEREIRA, P.V.; RAMOS, J.E.S.; PEREIRA, M.M.; SCHMIDT, V. Planejamento da exploração florestal: um estudo na amazônia brasileira. Brazilian Journal of Development, Curitiba, v. 5, n. 10, p. 18376-18403, 2019.
-
PINTO, A.; AMARAL, P.; JUNIOR, C. S.; VERÍSSIMO, A.; SALOMÃO, R.; GOMES, G.; BALIEIRO, C. Diagnóstico Socioeconômico e Florestal do município de Paragominas Relatório Técnico: Instituto do Homem e Meio Ambiente da Amazônia – Imazon, Belém – PA, 2009. Available at: https://imazon.org.br/PDFimazon/Portugues/outros/iagnostico-socioeconomico-e-florestal-do.pdf Accessed in: 15 May 2022.
» https://imazon.org.br/PDFimazon/Portugues/outros/iagnostico-socioeconomico-e-florestal-do.pdf - QUEIROZ, W. T. Análise Multivariada em Inventário Florestal Contínuo 1 ed. Belo Horizonte: Poisson, 2021.
- QUEIROZ, W.T. Amostragem em inventário florestal Belém: Universidade Federal Rural da Amazônia - UFRA, 2012.
-
R Core Team (2022). R: A language and environment for statistical computing R Foundation for Statistical Computing, Vienna, Austria. Available at: https://www.R-project.org/
» https://www.R-project.org/ -
REIS, A. A.; RIBEIRO, A.; MAYRINCK, R. C.; MELLO, J. M.; BATISTA, A. P. B.; FERRAZ FILHO, A. C. Temporal stability of stratifications using different dendrometric variables and geostatistical interpolation. Ciência Florestal, Santa Maria, v. 32, n. 1, p. 102-121, 2022. DOI 10.5902/1980509843274. Available at: https://doi.org/10.5902/1980509843274
» https://doi.org/10.5902/1980509843274» https://doi.org/10.5902/1980509843274 - SANQUETTA, C. R.; CORTE, A.P.D.; RODRIGUES, A.L.; WATZLAWICK, L.F.; Inventários Florestais: planejamento e execução 3 ed. Curitiba: Multi-graphic, 2014.
-
SEMAS. Instrução normativa n°5 de 10/09/2015. Diário Oficial do Estado 32969 dia 11 de setembro de 2015. Available at: https://www.legisweb.com.br/legislacao/?id=303363
» https://www.legisweb.com.br/legislacao/?id=303363 - SOARES, C. P. B.; PAULA NETO. F.; SOUZA, A. L. Dendrometria e inventário florestal 2. Ed. Viçosa: UFV, 2012.
- VICINI, L. Análise multivariada da teoria à prática Santa Maria: Universidade Federal de Santa Maria -UFSM, 2005.
- VIEIRA, D.S. Pós-estratificação e seleção de parcelas para fiscalização de inventários florestais na Amazônia 2020. 194 f. Tese (Doutorado em Ciência Florestal) - Universidade Federal dos Vales do Jequitinhonha e Mucuri, Diamantina, 2020.

 Source: Authors (2025)
 Source: Authors (2025)
 Source: Authors (2025)