
 Diversity, structure and ecology of a tree-shrub community established in a fire-excluded forest-grassland ecotone in southern Brazil
Changes in the disturbance regime seem to be decisive factors in the occurrence of vegetation changes along the border of forest-grassland ecotones. In order to understand the organization of a woody plant community during the natural forest expansion process, the floristic, structural and ecological aspects of a tree-shrub community established in a grassland remnant under fire exclusion for 18 years (1999-2017) were assessed. The results demonstrated that, despite the richness observed, few species became abundant in the community, evident in the high concentration of importance values and relatively low Shanonn diversity and Pielou’s evenness indices. In general, the floristic composition was balanced in terms of dispersal syndromes and ecological groups, with a slight predominance of zoochoric and non-pioneer species. Structural analysis of the community indicated the formation of regenerative stock associated with continuous recruitment flow. In regard to phytogeographic distribution, the predominance of species shared with the Cerrado ecological domain demonstrated the importance of this biome in shaping the landscape of the study area. The results of this study provide knowledge on the vegetation dynamics of forest-grassland mosaics in the Campos Gerais region of Paraná state, Brazil.
Keywords
Grassland; Araucaria forest; Forest expansion
 Thumbnail
 Thumbnail
 Thumbnail
 Thumbnail
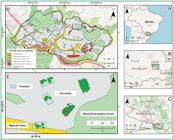
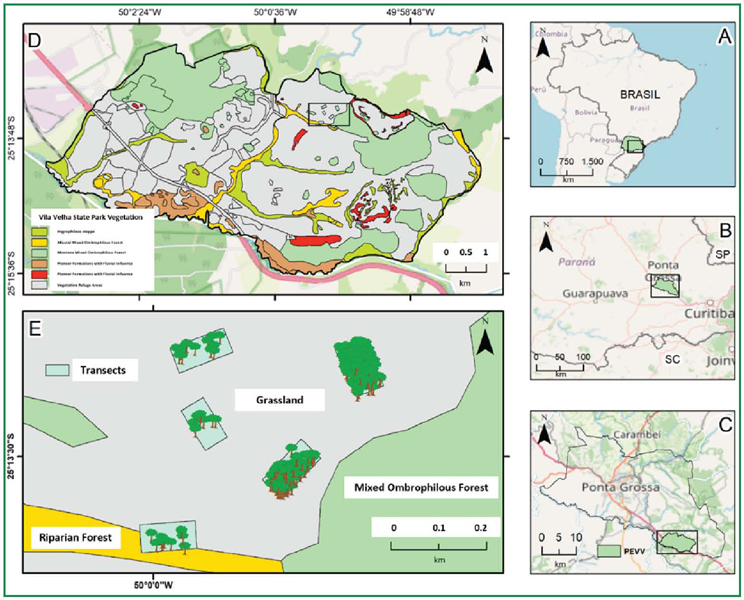 Source: Authors (2022), based on data from the Paraná Environmental Institute -
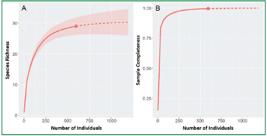
 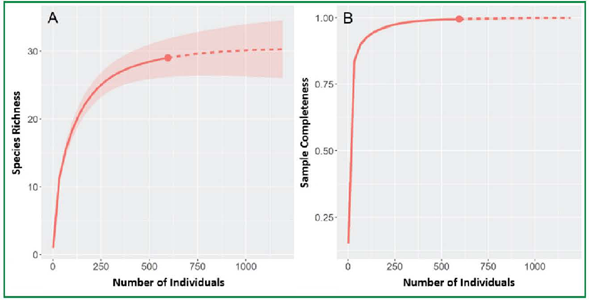 Source: Authors (2023)In where: The shaded area around the lines represents the 95% confidence intervals generated by the bootstrap method with 999 repetitions. Extrapolations were performed until the number of individuals was equivalent to twice the sampling effort. Hill number (q = 0).
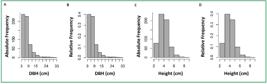
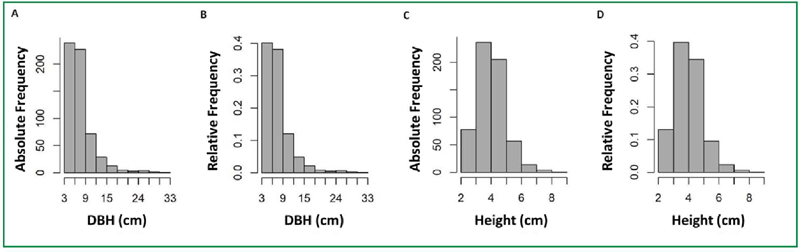 Source: Authors (2023)In where: DBH = Diameter at Breast Height; cm = centimeter.
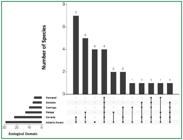
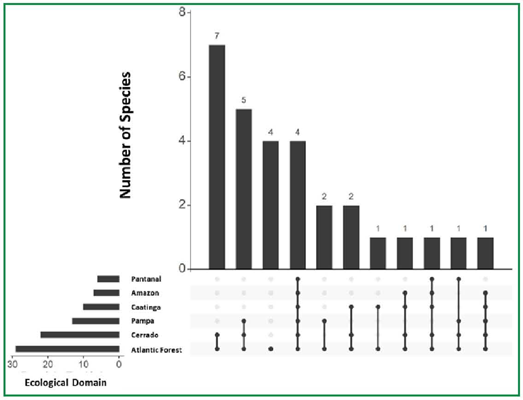 Source: Authors (2023)In where: The lower bar graph represents the total number of species that occurred in each ecological domain, and the upper bar graph the number of species shared between the different ecological domains at each intersection. The connected dots in the lower graph indicate which ecological domains are considered at each intersection.