 Genetic variability, heritability, and trait associations in gladiolus (Gladiolus grandiflorus L.) genotypes
Abstract
This study evaluated genetic variability, heritability, genetic advance and trait associations among gladiolus genotypes at ICAR-IARI, New Delhi, India, from 2022 to 2024. The study implemented a randomized block design with three replications. ANOVA revealed highly significant differences among genotypes, with genotypic effects most contributing to the total variance. Phenotypic variation exceeded genotypic variation, although environmental influence was minimal. High heritability coupled with high genetic advance was observed for cormel weight per hill (94.56%, 206.55%), cormel number per hill (91.73%, 189.62%), plant height (87.39%, 41.23%), spike length, and rachis length, indicating additive gene action and scope for direct selection. Correlation and PCA analyses confirmed strong associations among key traits and clear genotype differentiation, with G. callianthus being distinct. Promising genotypes included Rose Supreme, Chirag, Snow Princess and Dhanvantri. These findings provide a foundation for targeted breeding to develop improved cultivars with enhanced yield and floral quality and guide future research.
Keywords:
Gladiolus; PCA-Biplot; diversity; correlation; genetic advance
INTRODUCTION
Gladiolus × grandiflorus L., commonly known as sword lily, is one of the most important cut flowers worldwide and is often referred to as the “queen of bulbous plants” due to its attractive spikes and wide adaptability (Singh et al. 2024). The ancient name for gladiolus, xiphium, was derived from the Greek word xiphos, meaning sword. The Gladiolus genus belongs to the family Iridaceae, sub-family Ixioideae, tribe Ixieae, and sub-tribe Gladiolines (Hiremath et al. 2023). Around 260 species of gladiolus are reported globally, primarily distributed across Eastern, Western and Southern Africa with 12 species originating from Mediterranean region (Singh and Sisodia 2017). The crop is extensively cultivated across temperate and subtropical regions, ranking fifth in the global cut flower trade in terms of production and marketing. Gladiolus is grown under diverse agro-climatic conditions in India, with major production concentrated in states such as West Bengal, Uttar Pradesh, Chhattisgarh, Karnataka, and Himachal Pradesh.
Flower patterns, floral colours, and flowering behaviour of cultivated species vary greatly due to decades of interspecific hybridization and selection. New cultivars with novel floret colours, extended vase life, and improved tolerance to biotic and abiotic stresses are released each year to meet consumer preferences. While exotic cultivars are prized for their long spikes, larger florets, and unique colours, Indian genotypes often excel in corm multiplication, early sprouting, and adaptability (Balaram et al. 2009). Although numerous gladiolus genotypes have been developed and released in India through direct selection or hybridization with exotic cultivars, their performance has often been inconsistent across environments. This variation highlights the need for systematic evaluation and characterization of existing germplasm to identify genotypes with stable and superior performance under specific agro-climatic conditions (Kumar et al. 2019).
Parameters such as genotypic and phenotypic coefficients of variation (GCV and PCV), heritability, and genetic advance provide reliable insights into the magnitude and nature of genetic control and are widely applied in ornamental crop improvement (Chandra et al. 2023). Successful genetic improvement depends on quantifying the proportions of phenotypic variance that are genetic and the expected gain from selection (Sharma et al. 2023). High heritability combined with high genetic advance is particularly important, as it suggests additive gene action and greater potential for direct selection, whereas high heritability with low genetic advance suggests non-additive action and therefore limited response for selection. Furthermore, correlation analysis and multivariate approaches such as principal component analysis (PCA) help in identifying interrelationships among traits, key contributors to variability, and opportunities for indirect selection (Bhardwaj et al. 2025). Characterization and evaluation of germplasm also facilitate identifying superior genotypes and developing diverse parental lines for hybridization. Given the heterozygous nature, rising demand for high-quality cut flowers and the increasing importance of gladiolus in both domestic and export markets, genetic characterization of existing germplasm is essential to strengthen breeding pipelines. Understanding variability, heritability, and trait associations not only aids in selecting superior genotypes but also accelerates the development of novel cultivars with desirable commercial attributes.
Although several previous studies (Hiremath et al. 2023, Nazir et al. 2023, Kumar et al. 2024, Kumari and Singh 2024, Vinutha et al. 2024, Jadhav et al. 2025) have reported genetic variability in gladiolus, most were limited by small germplasm sets, single-season evaluations and limited trait study. The present study assessed 50 diverse genotypes consisting of both local and exotic collection for vegetative, floral and corm related traits using genetic parameters, correlation, and PCA analyses to identify key traits and superior genotypes. The findings provide actionable insights for selecting and breeding stable, high-performing cultivars under varied growing conditions.
MATERIAL AND METHODS
Experimental site and plant material
The experiment was conducted over two years (2022-2024) at the Research farm, Division of Floriculture and Landscaping, ICAR-IARI, New Delhi (lat 28° 40ꞌ N, long 77° 12ꞌ E, and alt 228.16 m asl), which has a semi-arid, subtropical climate. The weather remained favourable during the gladiolus growing season (October to April), with mean temperatures ranging from 11.4 °C to 28.1 °C. Relative humidity varied between 50% to 79%. The cool, dry winter conditions were ideal for uniform pant growth, flowering, and reliable expression of morphological traits. Uniform sized corms of 50 different genotypes of gladiolus procured from the ICAR-IARI Division of Floriculture and Landscaping were used (Figure 1). The crop was raised following standard practice procedures. Healthy corms measuring 5-6 cm in diameter were planted in October at a spacing of 45 × 15 cm and a depth of 6-8 cm in plots of 1 m². Well-decomposed farmyard manure (FYM) was incorporated into the soil at 300 q ha⁻¹ during field preparation. Chemical fertilizers were applied following the general recommendation per hectare of 120 kg N, 100 kg P, and 100 kg K. Half of the nitrogen and the full dose of phosphorus and potassium were applied as a basal dressing before planting, while the remaining nitrogen was top-dressed during earthing-up, approximately 45 days after planting. Corms were harvested 6-7 months after planting, once the foliage had dried and turned brown. The experiment was implemented in a randomized block design (RBD) with three replications. Observations were recorded on three tagged plants per genotype in each replication and averaged to obtain a mean value per replication for statistical analysis.

Data collection
Data was recorded for different vegetative parameters including: number of plants per hill (PPH), number of leaves per plant (LPP), plant height (PH) in cm, leaf length (LL) in cm and leaf width (LW) in cm. Plant height was measured from the base to tip of the plant and similar to leaf length where the 2nd leaf from the plant base was selected. Leaf width was measured at the mid part of same leaf. Flowering parameters such as days to spike emergence (DTS), days to colour show stage (DTC), days to floret opening (DTFF) and days to 50% plants flowering (D50F) was calculated from the day of sowing. Floret diameter (FD) was taken in cm as the average of N-S and E-W direction, while floret length (FL) was taken in cm from the base to tip of the floret. Total florets present (TF) on the spike and florets open at a time (FOT) were counted. Flowering duration (FLD) was calculated in days as the difference between days to last floret withering and first floret opening. Spike length (SL) was measured in cm from the 2nd leaf to the tip of the last floret, spike diameter (SD) was measured in mm using vernier callipers at the base, rachis length (RL) was measured in cm from the base of the 1st floret to the tip of the last floret, and internodal length (IL) was measured in cm as the difference between the base of the 1st and 2nd floret. Corm parameters like corm number per hill (CN) and cormel number per hill (CLN) were counted, cormel weight per hill (CLW) was measured in g and average corm weight per hill (CW) was measured in g using a scale and average corm diameter (CD) was measured in mm using vernier callipers in the N-S and E-W directions.
Statistical analysis
Data recorded over two years on various phenotypic parameters were subjected to combined analysis of variance (ANOVA) using WindoStat version 8.0, considering the effects of genotype, year, and genotype × year (G × Y) interaction. Genetic parameters including genotypic and phenotypic variances, genotypic and phenotypic coefficients of variation (GCV and PCV), heritability in the broad sense, and genetic advance were estimated using R version 4.2.0 with the ‘metan’ package. Principal component analysis (PCA) was performed using the ‘FactoMineR’ and ‘factoextra’ packages to explore multivariate relationships among traits. Pearson’s correlation coefficients were computed and visualized using the ‘corrplot’ package.
Estimation of variance and genetic parameters
The total variance was partitioned into its components for better understanding of variability. Genotypic and phenotypic variances were estimated as per Pennsylvania State College (1953):
Genotypic variance: (1)
Phenotypic variance: (2)
Error variance: (3)
In which: = Mean squares of treatments, = Mean squares of error and r = number of replications.
The genotypic and phenotypic coefficient of variation were computed using the formula of Burton and DeVane (1953):
(4)
(5)
In which: and represent the genotypic and phenotypic standard deviations, respectively, and  is the general mean. The values were subsequently classified according to Sivasubramanian and Madhavamenon (1973) as: low (<10%), moderate (10-20%), and high (>20%).
Broad-sense heritability () was estimated following Lush (1940):
(6)
Heritability estimates were classified according to Johnson et al. (1955) as: low (<30%), medium (30-60%), and high (>60%).
Genetic advance (GA) under selection was calculated using the formula of Johnson et al. (1955): (7)
In which = 2.06 is the selection differential at 5% selection intensity.
Genetic advance as percentage of mean (GAM) was computed as:
(8)
The GAM values were classified (Johnson et al. 1955) as: low (<10%), moderate (10-20%), and high (>20%).
RESULTS AND DISCUSSION
Analysis of variance (ANOVA)
The ANOVA across years indicated highly significant differences (p ˂ 0.001) among gladiolus genotypes for all morphological traits, suggesting that the observed variation was primarily due to genotypic differences (Table 1). The combined ANOVA further confirmed this, with genotype effects contributing the most to the total variance. Although the Year × Genotype interaction was significant for several traits, its contribution was negligible, indicating stability of genotypic performance across years. In contrast, year effects were significant for the number of plants per hill, spike length, and spike diameter, with the highest contributions for the number of plants per hill and spike length (Table 2). Similar trends have been reported in gladiolus (Chandra et al. 2023, Jadhav et al. 2025).
Genetic parameters
Table 3 presents the pooled variability, heritability, and genetic advance across both years. Phenotypic variance (PV) was consistently higher than genotypic variance (GV), while environmental variance (EV) was minimal, indicating that most observed variation was genetic in nature. The highest PV and GV were recorded for cormel number per hill (948.53 and 947.30, respectively), followed by plant height (134.05 and 132.95), whereas the lowest values were observed for the number of leaves per plant (0.39 and 0.14). Similarly, phenotypic coefficient of variation (PCV) was slightly higher than genotypic coefficient of variation (GCV) for all traits, although the difference was small, confirming low environmental influence. The highest GCV and PCV values were observed for cormel weight per hill (100.37 and 100.27), followed by cormel number per hill (82.49 and 82.44), while the lowest were recorded for days to floret opening (5.52 and 5.45). Traits with high GCV and PCV values (>20%) included the number of plants per hill, flowering duration, rachis length, cormel number per hill, cormel weight per hill, corm number per hill, and corm diameter. Moderate variability was noted for plant height, leaf traits, floret traits, spike length, spike diameter, internodal length, and corm weight, while low variability was observed for number of leaves per plant and flowering time-related traits. Traits with higher magnitude of genetic variability can be relied upon for further improvement. Nazir et al. (2023) also reported lower GCV and PCV values for flowering time related traits, and high values for cormel number. These patterns in which PV and PCV exceeded GV and GCV with minimal environmental influence are consistent with earlier reports in alstroemeria (Garg et al. 2024), carnation (Sharma et al. 2023) and passion fruit (Rodrigues et al. 2023).
Heritability is the transmissibility of characteristics from generation to generation. Broad-sense heritability is the proportion of total phenotypic variance that is due to genetic variance. It was high (>60%) for all traits except the number of leaves per plant (36%), which showed moderate heritability (30-60%). The highest heritability (100%) was recorded for cormel number per hill and cormel weight per hill; Nazir et al. (2023) similarly observed the highest heritability of 98.60% for number of cormels. High heritability suggests strong potential for genetic improvement (Chandra et al. 2023) and additionally suggests less environmental influence on the trait expression, which can also be confirmed by correlating the respective values. Thus, selections based on traits with high heritability are reliable. In contrast, low heritability indicates a greater influence of the environment, making selection based on such traits less effective and unreliable. Heritability alone does not provide a complete picture of the potential for genetic improvement; therefore, it is often considered alongside genetic advance (GA), which estimates the expected improvement in a trait through selection based on the phenotypic performance. GA was the highest for cormel number per hill (63.40), followed by plant height (23.75), and lowest for the number of leaves per plant (0.77), number of plants per hill (1.13), and corm number per hill (1.13).
GA is often expressed as a percentage of the trait mean to compare across traits, known as the genetic advance as a percentage of mean (GAM), which was highest for cormel weight per hill (206.55%), followed by cormel number per hill (169.82%), and lowest for number of leaves per plant (10.46%). A similarly high GAM for cormel number was reported by Nazir et al. (2023). GAM was high (>20%) for all traits except the number of leaves per plant and flowering time-related traits, which showed medium GAM (10-20%). The combination of high heritability and high GAM for most traits indicates a predominance of additive gene action, making direct selection effective. Similar variations for genetic parameters were also observed by Chandra et al. (2023), Giri and Parveen (2023), Singh et al. (2023), and Kumari and Singh (2024) in gladiolus, Santos et al. (2024) in cowpea, Rodrigues et al. (2023) in passion fruit, and Santos et al. (2023) in sweet potato.
Pearson’s correlation (r)
The correlation matrix (Figure 2) revealed several significant associations, which measures the degree of relationship between traits. A perfect positive correlation (r = 1.00) was observed between the number of plants per hill and corm number per hill. Other highly significant (p ˂ 0.001) and strong positive correlations (r = 0.75-1.00) were found between plant height and spike length (r = 0.96) and rachis length (r = 0.84). Similar positive and significant correlations were observed between: plant height, rachis length and spike length by Kumar et al. (2024); days to spike emergence and days to colour show (r = 0.85), days to floret opening (r = 0.75), and days to 50% flowering (r = 0.75); days to colour show and days to floret opening (r = 0.98), days to 50% flowering (r = 0.89); total florets present with flowering duration (r = 0.89), florets open at a time (r = 0.80), and rachis length (r = 0.78); florets open at a time with flowering duration (r = 0.72); rachis length with spike length (r = 0.82) and flowering duration (r = 0.78); and corm diameter with corm weight (r = 0.96). It is evident that taller plants produce longer spikes, thereby resulting in longer rachis and larger corm size results in heavier corms. Overall, the analysis highlighted several positive interrelationships among morphological, floral, and corm traits. These relationships are valuable for indirect selection, as improvement in one trait may lead to simultaneous gains in correlated traits. The results align with previous findings in gladiolus (Hiremath et al. 2023, Singh et al. 2023, Vinutha et al. 2023, Nazarbeigi et al. 2024).

Correlation matrix among the morphological traits of gladiolus genotypes (Significant codes: *** P<0.001; ** P<0.01; * P<0.05).
Principal component analysis (PCA)
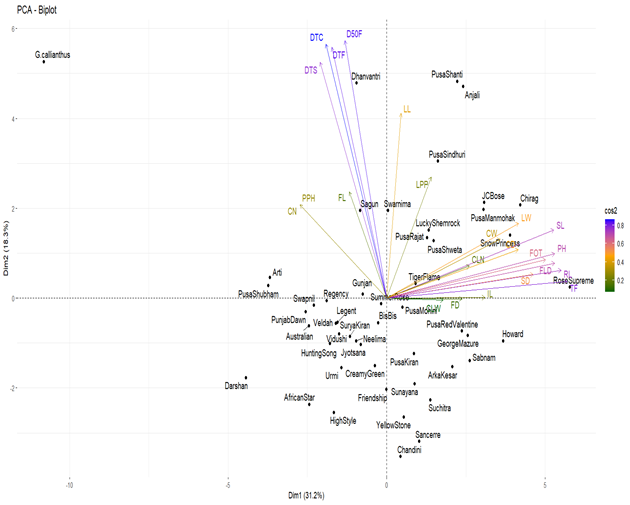
The PCA results further revealed substantial variation among genotypes. The scree plot (Figure 3) indicated that the first 10 principal components explained 91.60% of the total variance, with the first two (Dim1: 31.20%; Dim2: 18.30%) accounting for 49.50% higher than reported by Hiremath et al. (2023). These were therefore considered for biplot analysis (Figure 4). Traits in the biplot are represented as vectors, in which arrows show the increase direction and vector length indicates contribution. Genotypes are represented as dots, with Gladiolus callianthus appearing highly distinct and positioned far from all others, reflecting its species-level divergence (Bhusaraddi et al. 2025). Genotypes with similar trait profiles clustered closely, while vector angles reflected trait relationships: smaller angles denoted strong positive correlations, right angles no relationship, and opposite directions negative correlations. These observations were consistent with correlation results; for example, the number of plants per hill and number of corms per hill were in perfect correlation, hence both vectors are overlapped in PCA. Traits such as days to spike emergence, days to colour show, days to floret opening, and days to 50% flowering contributed most to Dim1, whereas spike length, plant height, rachis length, and total florets present were major contributors to Dim2.

Scree plot depicting percentage of principal component variances in terms of components in gladiolus

As noted by Pavithra et al. (2023), traits with vectors parallel to a principal axis more strongly contributed to that component. Genotype-trait associations were also evident; for example, ‘Rose Supreme’ showed a strong association with total florets present, consistent with its superior performance. Based on PCA, genotypes such as Chirag, Snow Princess, Dhanvantri, Pusa Manmohak, Pusa Shweta, Anjali, Pusa Shanti, Pusa Sindhuri, Pusa Rajat emerged as better performing candidates. The PCA results aligned well with correlation analysis, as vector directions and genotype groupings reflected the observed trait interrelationships. Overall, PCA effectively captured genotype differentiation and trait clustering, providing valuable insights for indirect selection in gladiolus improvement (Ahmed and Dhatt 2022, Nazarbeigi et al. 2024).
CONCLUSION
The present study revealed significant genetic variability among gladiolus genotypes for all the morphological traits evaluated. Genotypic effects were the major contributors to the observed variance, with minimal influence of year and genotype × year interaction, highlighting the stability of trait expression. High heritability estimates coupled with high genetic advance as a percentage of mean for key traits such as cormel number per hill, cormel weight per hill, plant height, spike length, and rachis length indicate the predominance of additive gene action, making these traits highly amenable to direct selection. Strong positive correlations among traits of economic importance, such as plant height with spike length and rachis length, or corm diameter with corm weight, further strengthen opportunities for indirect selection in breeding programs. Multivariate analyses, validated trait associations and revealed clear genotype differentiation, particularly the distinctness of G. callianthus and the superior floral traits of Rose Supreme. Other promising genotypes are Chirag, Pusa Manmohak, Dhanvantri, Snow Princess, Anjali, Pusa Shanti and Pusa Sindhuri.
Overall, the study provides valuable insights into the genetic basis of morphological variability in gladiolus. The identification of stable, heritable and positively correlated traits lays the foundation for developing improved cultivars. Future breeding efforts should focus on exploiting the identified variability through strategic hybridization among divergent and superior genotypes, followed by selection. Incorporating molecular tools alongside phenotypic selection could further enhance breeding efficiency and accelerate development of high performing gladiolus varieties.
ACKNOWLEDGMENTS
The authors acknowledge ICAR-IARI, New Delhi for providing facilities and Division of Floriculture & Landscaping, ICAR-IARI, New Delhi.
Data Availability
The datasets generated and/or analyzed during the current research are available from the corresponding author upon reasonable request.
REFERENCES
- Ahmed Z, Dhatt KK2022 Genetic diversity in gladiolus (Gladiolus hybridus) by cluster and principal component analysisSKUAST Journal of Research 24:199-205
- Balaram MV, Janakiram T, Vasantha K2009 Performance of Indian and exotic gladiolus genotypesJournal of Ornamental Horticulture 12:95-100
- Bhardwaj R, Sharma P, Dhiman SR, Dogra RK, Sharma A, Kumar M2025 Genetic variability and association studies in gladiolusPlant Archives 25:1756-1762
- Burton GW, DeVane DE1953 Estimating heritability in tall fescue (Festuca arundinacea) from replicated clonal materialAgronomy Journal 45:478-481
- Bhusaraddi P, Sumathi M, Jayanthi PDM, Bharti TU2025 Exploring floral morphology and scent profile of Gladiolus murielae: A wild crop relative for fragrance introgressionSouth African Journal of Botany 182:46-55
- Chandra A, Malik S, Kumar M, Kumar S, Awasthi M2023 Assessing genetic variability, heritability and genetic advance for morphological traits in different gladiolus (Gladiolus grandiflorus L.) genotypesInternational Journal of Environment and Climate Change 13:1479-1486
- Garg A, Kashyap B, Dhiman SR, Dogra RK2024 Genetic studies on alstroemeria germplasm under sub-temperate conditions of western HimalayasGenetic Resources and Crop Evolution 71:2065-2075
- Giri PA, Parveen S2023 Assessment of variability, heritability and genetic advance in 31 genotypes of gladiolus (Gladiolus grandifloras L.)Environment and Ecology 41:3077-3081
- Hiremath VM, Singh KP, Swaroop K, Anand P2023 Phenotypic characterization and diversity analysis of a collection of gladiolus cultivars in India using morpho-physiological traitsIndian Journal of Plant Genetic Resources 36:265-279
- Jadhav PR, Jagtap AY, Gadge AD, Solanke AU, Pagariya MC, Kadam GB, Prasad KV, Kawar PG2025 Agro-morphological characterization and SRAP-based genetic diversity analysis of Gladiolus hybridus L. cultivarsGenetic Resources and Crop Evolution 72:6181-6203
- Johnson HW, Robinson HF, Comstock RE1955 Estimates of genetic and environmental variability in soybeansAgronomy Journal 47:314-318
- Kumar A, Kumar A, Kumar A2019 Genetic variability, heritability, genetic advance and genetic divergence for yield and its contributing traits in gladiolus (Gladiolus grandiflorus L.)International Journal of Current Microbiology and Applied Sciences 8:689-701
- Kumar R, Singh AK, Tomar KS, Kumar H, Kumar A, Maheshwari A2024 Genetic variability and association studies of marketable traits in gladiolus (Gladiolus hybridus)The Indian Journal of Agricultural Sciences 94:399-403
- Kumari P, Singh D2024 Variability, heritability, genetic advance in gladiolus (Gladiolus grandiflora L.)Annals of Agricultural Research 44:507-509
- Lush JL1940 Intro-site correlation and regression of off spring on corn as a method of estimating heritability of charactersAmerican Society of Animal Production 33:293-301
- Nazarbeigi M, Roein Z, Sabouri A2024 Evaluating diversity and molecular association analysis in wild Iranian gladiolusOrnamental Horticulture 30:e242813
- Nazir M, Dogra S, Pandey RK, Kashyap S, Laishram N, Singh A, Shah AH2023 Study of heritability and genetic variability among yield and biochemical characters of gladiolus (Gladiolus grandiflorus L.)The Pharma Innovation 12:4949-4952
- Pavithra S, Sarkar A, Roy SK, Bhattacharya PM2023 Principal component analysis and genetic correlation studies in Lens culinaris MedikElectronic Journal of Plant Breeding 14:1198
- Pennsylvania State College1953 Qualitative inheritance in grasses. In Burton GW (ed) Proceedings of the 6th international grassland congress. The Congress, Old Main, pp. 17-23
- Rodrigues CA, Vieira HD, Souza RD, Mendes DS, Viana AP2023 Genetic gain in Passiflora seed traits from recurrent selection among full-sib familiesCrop Breeding and Applied Biotechnology 23:e44302319
- Santos SPD, Araújo MDS, Aragão WFLD, Damasceno-Silva KJ, Rocha MDM2024 Genetic analysis of yield component traits in cowpea [Vigna unguiculata (L.) Walp.]Crop Breeding and Applied Biotechnology 24:e46432413
- Santos VDS, Fukuda WMG, Oliveira LAD, Pereira MEC, Nuti MR, Carvalho JLVD, Pereira HD2023 Genetic parameters considering traits of importance for cassava biofortificationCrop Breeding and Applied Biotechnology 23:e447923211
- Sharma P, Sharma P, Dhiman SR, Dogra RK, Sharma A, Rana N2023 Variability and association studies among carnation mutants (Dianthus caryophyllus L.) in Northwestern HimalayasGenetic Resources and Crop Evolution 70:1939-1955
- Singh AK, Sisodia A2017 Textbook of floriculture and landscaping. New India Publishing Agency, New Delhi, 350p.
- Singh N, Rana TS, Datta SK, Cardarelli M, Dobránszki J2024 Biotechnology advances in gladiolus: a reviewThe Journal of Horticultural Science and Biotechnology 100:314-328
- Singh V, Singh D, Wesley J2023 Study of evaluation of genetic variability of gladiolus cultivars under agro-climatic conditions of Prayagraj, IndiaInternational Journal of Plant and Soil Science 35:327-335
- Sivasubramanian S, Madhavamenon M1973 Heterosis and inbreeding depression in riceMadras Agriculture Journal 60:13-39
- Vinutha DB, Patil SR, Seetharamu GK, Kumar PP, Mahesh YS, Waseem MA, Thilak JC2024 Genetic variability and character association in gladiolus (Gladiolus grandiflora L.)The Pharma Innovation Journal 12:2788-2793