 Nonlinear models to characterize cumulative gas production using the in vitro technique in Brachiaria grass silage harvested at three cutting ages
Abstract
The Brazilian ruminant production system, which relies on native or cultivated pastures, underscores the importance of silage for feed preservation in the tropical regions. This study aimed to evaluate different mathematical models for cumulative in vitro gas production in Brachiaria decumbens grass silages at three distinct cutting ages (56, 84, and 112 d). The in vitro gas production technique provided information on fermentation kinetics, were analyzed using mathematical models. The methodology included statistical tests to evaluate normality, independence, and heteroscedasticity of the residuals, as well as the application of various criteria for model selection. The results indicated that models such as Logistic, von Bertalanffy, Gompertz, Richards, Brody, and France were appropriate, but the France and Brody models provided the best overall fit. Based on the adopted criteria, the Brody model was found to be the most suitable for describing cumulative gas production across all cutting ages of Brachiaria grass. Cumulative gas production was highest at 56 days of growth, with the Brody model indicating superior production capacity during this period (191.14 mL/g dry matter). In conclusion, an appropriate choice of mathematical model is important for the accurate representation of gas production kinetics in Brachiaria grass silage.
Keywords:
fermentation; tropical forage; model selection.
Resumo
O sistema de produção de ruminantes no Brasil, que se baseia em pastagens nativas ou cultivadas, ressalta a importância da silagem para a conservação do alimento nas regiões tropicais. Este estudo teve como objetivo avaliar diferentes modelos matemáticos para a produção cumulativa de gás in vitro em silagens de capim Brachiaria decumbens em três idades de corte distintas (56, 84 e 112 dias). A técnica de produção de gás in vitro forneceu informações sobre a cinética da fermentação, que foram analisadas utilizando modelos matemáticos. A metodologia incluiu testes estatísticos para avaliar a normalidade, independência e heterocedasticidade dos resíduos, bem como, a aplicação de diversos critérios para a seleção do modelo. Os resultados indicaram que modelos como o Logístico, von Bertalanffy, Gompertz, Richards, Brody e France foram adequados, mas os modelos de France e Brody apresentaram o melhor ajuste geral. Com base nos critérios adotados, o modelo de Brody foi considerado o mais adequado para descrever a produção cumulativa de gás em todas as idades de corte do capim Brachiaria. A produção cumulativa de gás foi maior aos 56 dias de crescimento, com o modelo de Brody indicando capacidade de produção superior durante esse período (191,14 mL/g de matéria seca). Em conclusão, a escolha adequada do modelo matemático é importante para a representação precisa da cinética de produção de gás na silagem de gramíneas do tipo Brachiaria.
Palavras-chave:
fermentação; forragem tropical; seleção de modelos.
1. Introduction
The Brazilian ruminant production system is predominantly based on the use of native or cultivated pastures, which often experience frequent water stress, leading to seasonal fluctuations in forage availability (1). During periods of forage scarcity, it is essential to rely on alternative feed sources, with silage being a crucial tool for preserving unconventional grasses including species of the genus Brachiaria (2).
The in vitro gas production technique has emerged as a valuable tool for analyzing the fermentation kinetics of soluble, structural, and nonstructural feed components (2). Thus, it is possible to measure the ruminal digestion rate coupled with gas production and feed fermentation using in vitro gas production (3). However, these complex data must be interpreted using mathematical models that provide a simplified representation of the phenomenon under study (4).
Nonlinear mathematical models provide a more refined interpretation of the investigated phenomena by using various parameters with biological relevance (5). Thus, by fitting gas production to a nonlinear mathematical model, crucial information such as the gas production rate, colonization time, and asymptotic gas production can be obtained (6). Several authors (1, 2, 7, 8) have proposed various models that offer improved fit to gas production data, including the Gompertz (9) and Logistic and modified Logistic models (10), among others.
In this context, the present study aimed to evaluate the applicability of different mathematical models for fitting the cumulative gas-production kinetics of in vitro gases in Brachiaria decumbens grass silages at three distinct cutting ages.
2. Material and methods
2.1 Data
Data on cumulative gas production from Brachiaria grass silages at three cutting ages were used, as shown in Table 1.
Cumulative gas production (mL/g) of dry matter after 6, 12, 24, 48, and 96 hours for Brachiaria decumbens grass silages harvested at 56, 84, and 112 days of growth.
Ciência Animal Brasileira | Brazilian Animal Science, v.27, 81693E, 2026.
2.2 Residual analysis
The Shapiro-Wilk test (11) was used to assess normality, the Durbin-Watson test (12) was used to test independence, and the Breusch-Pagan test (13) was used to examine heteroscedasticity of the residuals.
2.3 Evaluated nonlinear models
The cumulative gas production of B. decumbens grass silages was fitted using the mathematical models presented in Table 2.
2.4 Criteria for model selection
The adopted criteria to verify the quality of fit were:
The residual mean square (RMS) was calculated by dividing the sum of the squared residuals by the degrees of freedom of the residual n - p, that is:
This statistic represents the mean of the squared differences between the actual values (yi) and predicted values in the model (), where n is the number of observations and p is the number of parameters used.
The mean absolute deviation (MAD) was obtained from the mean of the distances between each data point and the sample mean, defined as the mean of the absolute differences between the actual values (yi) and predicted values in the model () divided by n (number of observations), obtained using the following formula:
The information criterion (AIC) (14) and Bayesian information criterion (BIC) (15) are used to compare competing models and to increase the likelihood of selecting the model that best approximates the underlying data-generating process. In both cases, lower values indicate a better fit, and they are defined by:
The mean absolute percentage error (MAPE) quantifies the average magnitude of prediction error expressed as a percentage of the actual values, calculated as the mean of the absolute percentage differences between the predicted and actual values using the following formula:
Where, yi is the actual value, is the predicted value, and n is the number of observations.
Penalizing adaptive likelihood (PAL) is a model-selection approach that introduces an adaptive penalty into the likelihood function, thereby discouraging overfitting and guiding the estimation of appropriate model complexity:
Where rn and pn are the generalized likelihood ratios, n is the number of parameters, and is the largest number of parameters among the models considered.
A residual distribution plot was used to visualize the quality of the fit provided by each function and to assess whether the residuals exhibited patterns indicative of model misfit.
3. Results
Table 3 summarizes the parameter estimates for each model, accompanied by the evaluation criteria presented in Table 4, which together identify the model that best represents the average cumulative gas production curve observed during the 56-day experimental period.
Parameter estimates for cumulative gas production (mL/g) over the 56‑day period, where A represents the potentially degradable fraction, B the potentially degradable fraction under microbiota action without colonization time, and K the degradation rate constant.
Selection criteria used to identify the most appropriate nonlinear model of cumulative gas production (mL/g) over the 56‑day period.
All models exhibited normality of residuals (p > 0.05) according to the Shapiro-Wilk test. According to the Durbin-Watson test, all models had independent residuals. Regarding the Breusch-Pagan test, the Von Bertalanffy model (p = 0.0289) and Gompertz model (p = 0.041) showed evidence of heteroscedasticity; whereas the remaining models exhibited homoscedastic residuals (p > 0.05) for the 56-day cut.
Parameter estimates (Table 3) were all significant (p < 0.05) for the Brody and Von Bertalanffy models, indicating that these models adequately describe the average cumulative gas growth curve for the 56-day cut. In the France, Logistic, Logistic Modified, and Santos models, only parameter A was significant (p < 0.05). For the Gompertz and Richards models, parameters A and K were significant (p < 0.05) and B was marginally significant (p < 0.1). However, in the Figueiredo model, none of the parameters reached statistical significance (p > 0.1).
R2 indicates the proportion of total variability in the response variable (cumulative gas volume) explained by the explanatory variable (time in hours) and was similar among the models (Table 4). R2 values were consistently high (above 0.97), indicating strong agreement between the observed data and the model predictions. As shown in Figure 1, which includes the cumulative gas production curves from time up to 96 hours, had a mean of 91.83 mL/g and ranged from approximately 6.91 to 182.12 mL/g, corresponding to the fitted equations of the respective models for the 56-day cut.

However, the France model had the lowest Mean Absolute Deviation (MAD) value (Table 4), indicating the best-fit according to this criterion, followed by the Figueiredo and Brody models. Examining the sum of the Residual Mean Square (RMS) of the four models analyzed, the Richards model showed the best fit for growth estimates (Table 4). RMS serves as an indicator of fit quality because it is directly related to the variance of the residual errors; higher RMS values reflect greater error variability and therefore lower model adequacy.
For the Akaike Information Criteria (AIC) and Bayesian Information Criteria (BIC), the France model showed the best fit with values of 37.66 and 35.70, respectively (Table 4). The Brody model performed performed best according to the PAL metric. The Mean Absolute Percentage Error (MAPE), was negative for all models evaluated for Brachiaria grass silage at the 56-day cut. Furthermore, the France model had the lowest MAPE baseline, indicating predictions closest to zero error.
Table 5 presents the parameters for each model and the criteria used to evaluate the model that best described the mean cumulative gas growth curve for the 84-day cut. All models exhibited normality of residuals (p > 0,05), according to the Shapiro-Wilk test showed independent residuals based on the Durbin-Watson test. In relation to the Breusch-Pagan test, only France model (p = 0,04867) showed evidence of heteroscedasticity while other models exhibited homoscedastic residuals (p > 0,05).
Parameter estimates for cumulative gas production (mL/g) over the 84‑day period, where A represents the potentially degradable fraction, B the potentially degradable fraction degraded by microbiota without colonization time, and K the degradation rate constant.
The R2 values were similar among the models (Table 6), all showing high values (> 0.98); however, the Santos (2018) model exhibited a markedly lower R2 (0.76). Overall, the models demonstrated adequate agreement with the observed data as shown in Figure 2, which represents the cumulative gas production curves up to 96 hours, with an average of 77.628 mL/g, and ranged from approximately 6.56 to 167.80 mL/g, corresponding to the fitted equations of the respective models for the 84-day cut.
Selection criteria used to identify the most appropriate nonlinear model of cumulative gas production (mL/g) over the 84‑day period.

However, the France model had the lowest MAD value (Table 6), indicating the best fit according to this criterion, followed by the Richards and Figueiredo models. Examining the sum of the Residual Mean Square (RMS) of the four models analyzed, the Richards model showed the best fit for gas-accumulation estimates (Table 6).
For the Akaike Information Criteria (AIC) and Bayesian Information Criteria (BIC), France model again demonstrated the best fit, with values of 32.91 and 30.95, respectively (Table 6). In terms of PAL, France, Richards, and Brody models performed best. The MAPE was negative for all models evaluated for Brachiaria grass silage at the 84-day cut . Furthermore, the France model had the lowest MAPE baseline, indicating predictions closest to zero error.
Table 7 presents the parameter estimates for each model and the criteria used to evaluate the model that best represents the data. All models exhibited normality of residuals (p>0,05), according to the Shapiro-Wilk test and showed independent residuals based on the DurbinWatson test. In relation to the Breusch-Pagan test, exhibited homoscedastic residuals (p>0,05) for the 112-day cutoff.
Parameter estimates for cumulative gas production (mL/g) over the 112‑day period, where A represents the potentially degradable fraction, B the potentially degradable fraction degraded by microbiota without colonization time and K the degradation rate constant
The R2 values were similar among the models (Table 8), all showing high values (> 0.98); however, the Santos (2018) model exhibited a substantially lower R2 (0.76). Overall, the models demonstrated adequate agreement with the observed data, as shown in Figure 3, which includes the cumulative gas production curves up to 96 hours. These curves had a mean of 81.416 mL/g and ranged from approximately 8.43 to 165.17 mL/g, corresponding to the fitted equations of the respective models for the 112-day cut.
Selection criteria used to identify the most appropriate nonlinear model of cumulative gas production (mL/g) over the 112‑day period.

However, the France model had the lowest MAD value (Table 8), indicating the best fit according to this criterion, followed by the Brody and Figueiredo models. Examining the sum of the Residual Mean Square (RMS) of the four models analyzed, the France and Brody models showed the best fit for gas-accumulation estimates (Table 8). For the Akaike information criterion (AIC) and Bayesian information criterion (BIC), France model again demonstrated the best fit, with values of 32.91 and 30.95, respectively (Table 8). In terms of PAL, the models France, Richards, and Brody performed the best. The MAPE was negative for all models evaluated for Brachiaria grass silage at the 112-day cut.
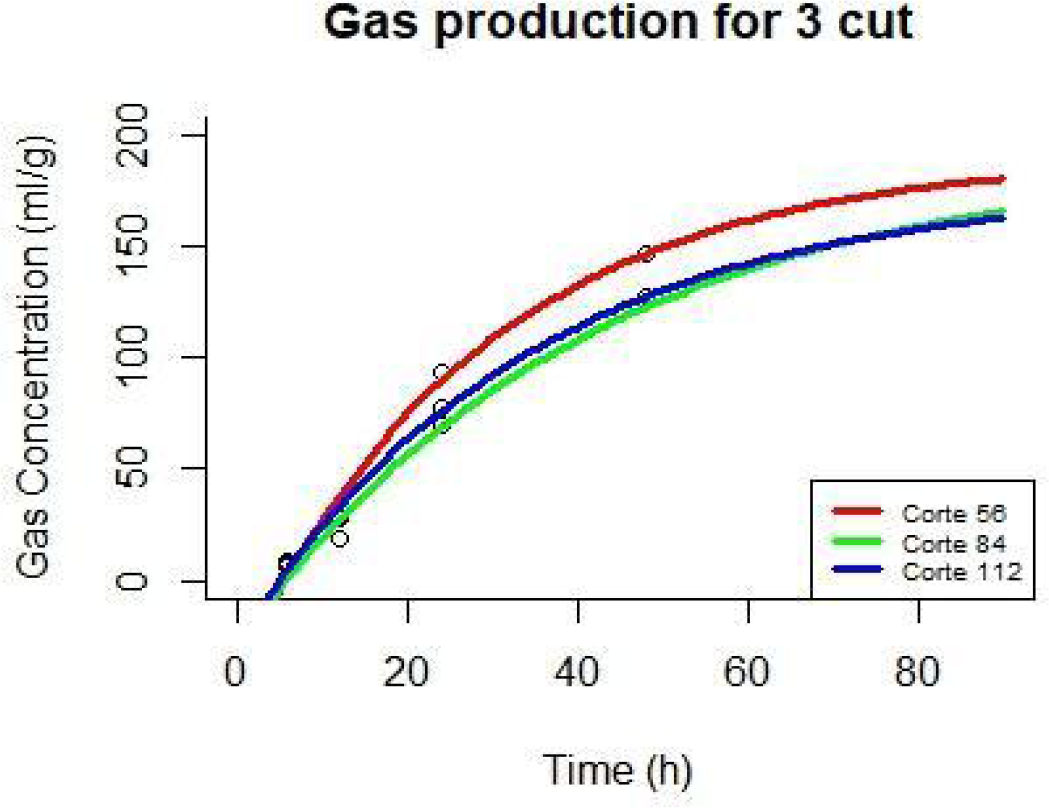
Given the high determination coefficients obtained and the 5% significance level of the parameters, the Brody model (Figure 4) can be considered well-suited to all cuts of Brachiaria grass, as supported by the model equation and the corresponding R2 values presented in Table 9.
Equations generated by regression analysis for the Brody model applied to cumulative gas production data from Brachiaria decumbens grass silages harvested at 56, 84, and 112 days of growth.

Cumulative gas production curves (mL/g) for the 56-, 84-, and 112-day cutting ages over time (hours), based on observed data and fitted using the Brody model
4. Discussion
Models applied to ruminal digestion kinetics provide a straightforward interpretation of the phenomena under study using parameters with biological meaning (6). Numerous models have been proposed and tested across different substrates (4, 16, 17), each based on distinct assumptions and and mathematical approaches, and each describing changes in the system as a function of incubation time(3). Nevertheless, models with varying mathematical structures may yield different results for the same gasproduction curve, as previously observed.
At the 56‑day harvest, the differences among the model parameters were less pronounced than those observed at 84 and 112 days. However, the indices clearly show that Santos (2018) model produced results that were distinct from the other models. Although the Richards model appeared visually different in the plotted curves, the indices did not reveal this distinction as clearly they did for the Santos (2018) model.
Based on the R2 criterion, the models showed comparable performance after 56 d. However, at 84 and 112 d, the Santos (2018) model performed markedly worse than the others, indicating that it is not a suitable option under this criterion. A similar situation occurred with the RMS, where the Santos (2018) model consistently produced discrepant values across all harvests whereas the Logistic and Modified Logistic models also showed higher RMS values relative to the remaining models.
Across all the evaluated criteria, Santos (2018) model consistently yielded inferior performance, demonstrating that it is not suitable for this dataset. This becomes even more evident when the combined function plots are considered. Although the R2 values of the Logistic and Modified Logistic models were comparable, they did not did not show equivalent performance across the remaining criteria.
Multiple indices were applied to ensure a more rigorous evaluation as it was necessary to verify whether they provided consistent information. According to Mello (4), a negative MAPE indicates an underestimation of the predicted parameters. All models presented negative values, suggesting that the parameter values were underestimated in every case. The main difference lies in the absolute magnitude of these values, with smaller values reflecting a better fit.
It is important to note that the Brody model produced the best overall fit. Despite its simple mathematical formulation, it was able to describe the gas-production dynamics more effectively. Based on the Brody model, the material harvested at 56 days exhibited the highest gas production capacity (191.14 mL/g of dry matter), followed by silages from grass harvested at 84 and 112 days, with 189.12 mL/g and 178.12 mL/g of dry matter, respectively. Castro (18) reported that the effective degradation of dry matter decreased with advancing plant age in Tanzanian grass silages produced at 42 and 126 days. Similarly, Silva (19) observed that gas production declined with increasing maturity of elephant grass harvested at 60 and 90 d.
The results indicate that the effective degradability of dry matter declined with advancing age in Brachiaria grass (2) and elephant grass silages (20). This trend may be explained by the strong correlation between gas production and dry matter degradability as demonstrated by Ribeiro et al. (21) in Andropogon grass silages of different ages. Therefore, as the cutting age increased, the silage decomposition capacity decreased owing to an increase in the stem-to-leaf ratio, which in turn increased the proportions of cellulose, hemicellulose, and lignin, thereby reducing the fraction of potentially digestible nutrients such as soluble carbohydrates and proteins, ultimately leading to a marked decline in digestibility. Additionally, material losses during silo fermentation further reduce gas production compared to fresh forage. The greatest gas production capacity in vitro was observed at a cutting age of 56 days, reflecting a higher proportion of soluble carbohydrates in the cellular content and, consequently, greater substrate availability for ruminal microorganism.
Therefore, cutting the B. decumbens grass at this stage is recommended for optimal ensiling performance.
5. Conclusion
Considering all selection criteria based on the parameters, the Brody model showed the best overall fit to the cumulative gas production curves of B. decumbens silages harvested at 56, 84, and 112 days of growth. The Santos 2018, Logistic, and Modified Logistic models did not adequately represent the data and are therefore not recommended for this type of silage.
Generative AI use statement
No Generative Artificial Intelligence tools were used in the preparation of this manuscript.
Data availability statement
The complete dataset supporting the results of this study was published in the article itself and in the repository: https://hdl.handle.net/1843/BUOS-98LFGY.
References
-
1 Pereira-Flores ME, Justino F, Rodrigues JM, et al. Seasonal climate impact on Brazilian pasture (Brachiaria brizantha cv. Marandu): growth rate, CO efflux, and irrigation strategies. Theor. appl. climatol. 2023;151. Available from: https://doi.org/10.1007/s00704-022-04295-y
» https://doi.org/10.1007/s00704-022-04295-y -
2 Magalhães, FA. Produção acumulada de gases pela técnica in vitro da silagem do capim Brachiaria decumbens em diferentes idades de corte. [Tese] Belo Horizonte (MG): Doutorado em Zootecnia, Escola de Veterinária, Universidade Federal de Minas Gerais; 2013 [citado em 23 de março de 2013]. Available from: https://hdl.handle.net/1843/BUOS-98LFGY
» https://hdl.handle.net/1843/BUOS-98LFGY -
3 Assis JR, Fernandes GA, Mousquer CJ, et al. Modelos matemáticos aplicados à cinética de digestão ruminal e produção de gás in vitro In: Galati RL, Queiroz MFS. Inovações na nutrição animal: desafios da produção de qualidade. 1st ed. Guarujá: Científica Digital; 2021. p. 164-179. Available from: https://doi.org/10.37885/210404121
» https://doi.org/10.37885/210404121 -
4 Mello R, Magalhães ALR, Breda FC, Regazzi AJ. Modelos para ajuste da produção de gases em silagens de girassol e milho. Pesq. agropec. bras. 2008;2. Available from: https://doi.org/10.1590/S0100-204X2008000200016
» https://doi.org/10.1590/S0100-204X2008000200016 -
5 Santos ALP, Moreira GR, Brito CCR, et al. Method to generate growth and degrowth models obtained from differential equations applied to agrarian sciences. Semina: Ciênc. agr. 2018;39. Available from: https://doi.org/10.5433/16790359.2018v39n6p2659
» https://doi.org/10.5433/16790359.2018v39n6p2659 -
6 Emiliano PC, Vivanco MJ, Menezes FS. Information criteria: How do they behave in different models? Comput. stat. and dat. anal. 2014;69. Available from: https://doi.org/10.1016/j.csda.2013.07.032
» https://doi.org/10.1016/j.csda.2013.07.032 -
7 Santos ALP, Brito CCR, Moreira GR, et al. New model of evaluation of sunflower and corn silages by the in vitro gas production technique. Semina: ciênc. agr. 2020;41. Available from: https://doi.org/10.5433/1679-0359.2020v41n4p1373
» https://doi.org/10.5433/1679-0359.2020v41n4p1373 -
8 Figueiredo MPS, Moreira GR, Brito CCR, et at. Method to generate growth and degrowth models obtained from existing models compositions applied to animal sciences - the athens-canadian chicken growth case. Livest. sci. 2023;269. Available from: https://doi.org/10.1016/j.livsci.2023.105162
» https://doi.org/10.1016/j.livsci.2023.105162 - 9 Laird AK. Dynamics of relative growth. Growth. 1965;29.
-
10 Schofield P, Pitt RE, Pell AN. Kinetics of fiber digestion from in vitro gas production. J. anim. sci. 1994;72. Available from: doi: https://doi.org/10.2527/1994.72112980x
» https://doi.org/10.2527/1994.72112980x -
11 Shapiro SS, Wilk MB. An analysis of variance test for normality (complete samples), Biometrika. 1965;52. Available from: https://doi.org/10.1093/biomet/52.3-4.591
» https://doi.org/10.1093/biomet/52.3-4.591 - 12 Morettin PA, Toloi CMC. Análise de séries temporais. 2nd ed. São Paulo: Blucher; 2006. 564p. Português.
- 13 Breusch AR, Pagan TS. A simple test for heteroscedasticity and random coefficient variation. Econometrica. 1979;47.
-
14 Akaike H. A new look at the statistical model identification. IEEE Transact. Autom. Cont. 1974;19. Available from: https://doi.org/10.1109/TAC.1974.1100705
» https://doi.org/10.1109/TAC.1974.1100705 -
15 Schwarz G. Estimating the dimension of a model. Ann. Statist. 1978;6. Available from: https://doi.org/10.1214/aos/1176344136
» https://doi.org/10.1214/aos/1176344136 -
16 França AFS, Silva ANR, Oliveira LG, et al. In vitro gas production from pearl millet cultivars under nitrogen levels, Rev. bras. saúde prod. anim. 2024;25. Available from: https://doi.org/10.1590/s1519-994020230034
» https://doi.org/10.1590/s1519-994020230034 -
17 Uçkardes F, Efe E. Investigation o the usability of some mathematical models in in vitro gas production techniques Slovak j. anim sci. 2014;47. Available from: https://office.sjas-journal.org/index.php/sjas/article/view/231
» https://office.sjas-journal.org/index.php/sjas/article/view/231 -
18 G. Castro. Características produtivas, agronômicas e nutricionais do capim-tanzânia em cinco diferentes idades ao corte. Arq. bras. med. vet. zootec. 2010;62. Available from: https://doi.org/10.1590/S0102-09352010000300022
» https://doi.org/10.1590/S0102-09352010000300022 -
19 Silva NV, Santos MVF, Silva VJ, et al. Morphological characteristics and kinetics of in vitro gas production of tall and dwarf elephant grass genotypes as affected by harvest frequencies. J. Agric. Sci. 2025;16. Available from: https://doi.org/10.1017/S0021859625000231
» https://doi.org/10.1017/S0021859625000231 -
20 Cavalcanti AC, Saliba EOS, Couto Filho CC, et al. Avaliação de fenos produzidos com Andropogon gayanus em diferentes idades empregando-se a técnica de produção de gases. Rev. facult. agr. 2018;117. Available from: https://sedici.unlp.edu.ar/handle/10915/74058
» https://sedici.unlp.edu.ar/handle/10915/74058 -
21 Ribeiro GOJ, Velasco FO, Faria Junior WG, et al. Cinética de degradação in situ das silagens de capim Andropogon gayanus produzidas em três idades de corte. Arq bras. med. vet. zootec. 2014;66. Available from: https://doi.org/10.1590/1678-6780
» https://doi.org/10.1590/1678-6780